

Abstract
Introduction
Plasma or saliva cotinine concentrations are used widely as biomarkers of secondhand smoke (SHS) exposure and have been associated with the risk of SHS-related disease. Concentrations of cotinine and other nicotine metabolites are considerably higher in urine than in plasma or saliva, making chemical analysis easier. In addition, urine is often more convenient to collect in some SHS exposure studies. The optimal use of nicotine metabolites in urine, singly or in combination, with or without correction for urine creatinine concentration, to estimate plasma cotinine concentration with low-level nicotine exposure has not been determined.
Methods
We dosed 36 nonsmokers with 100, 200, or 400 μg deuterium-labeled nicotine (simulating exposure to SHS) by mouth daily for 5 days and then measured plasma and urine cotinine and metabolites at various intervals over 24 hr.
Results
A plasma cotinine concentration of 1 ng/ml corresponds on average to a daily intake of 100 μg nicotine. Cotinine concentrations in urine averaged four to five times those in plasma. Correction of urine cotinine for creatinine concentration improved the correlation between urine and plasma cotinine. Measuring multiple cotinine metabolites in urine did not improve the correlation with plasma cotinine, compared with the use of urine cotinine alone.
Discussion
Measurement of urine cotinine corrected for creatinine concentration appears to be the best predictor of plasma cotinine.
Introduction
Plasma cotinine is used widely as a quantitative estimator of intake of nicotine from secondhand smoke (SHS; Benowitz, 1996; U.S. Department of Health and Human Services, 2006). Cotinine, the major proximate metabolite of nicotine, is a specific indicator of nicotine exposure. In nonsmokers, SHS is the major source of nicotine exposure, with a negligible contribution from nicotine in foods or tea (Benowitz, 1996). Plasma and saliva cotinine concentrations are highly correlated, and these measures have been shown to be associated with an increased risk of respiratory disease in children and cardiovascular disease in adults exposed to SHS (Strachan, Jarvis, & Feyerabend, 1990; Whincup et al., 2004).
Although plasma and saliva cotinine concentrations are considered by many researchers to be the best available biomarkers of SHS exposure, such measures are not always easily available. Concentrations of cotinine in SHS-exposed individuals are quite low in the United States. Such levels are often well below 1 ng/ml (Pirkle, Bernert, Caudill, Sosnoff, & Pechacek, 2006), which makes chemical analysis challenging. Concentrations of cotinine are much higher in urine than in plasma and saliva (Hukkanen, Jacob, & Benowitz, 2005), making urine a more suitable biofluid for detecting low-level exposure. Furthermore, urine may be easier to collect in some studies than plasma or saliva.
The concentration of cotinine in urine in relation to its concentration in plasma may be affected by several factors, including urine flow rate, urine pH, and kidney function. The relationship between urine flow and cotinine concentration is complex because cotinine is both filtered and reabsorbed by the kidney (N. Benowitz, Lessov-Schlaggar, & Swan, 2008). The kidney filtration rate of a drug is independent of urine flow, but the extent of renal tubular reabsorption often varies with urine flow rate. If a drug is filtered only, then correction for creatinine, which also is primarily filtered, is a useful way to correct for variability in urine flow rate (the latter of which depends on fluid intake). However, if the drug is highly reabsorbed, then at low flow rates, the extent of reabsorption may increase. This would reduce urine concentrations of cotinine such that correction for creatinine might not be necessary and might even worsen the correlation between urine and plasma cotinine concentrations.
Thompson and colleagues have reported that, in smokers, adjustment of urine cotinine for creatinine concentration using regression equations relating urinary cotinine to urinary creatinine improves the correlation between urine cotinine and serum cotinine (Thompson, Barlow, Wald, & Van Vunakis, 1990). However, a simple correction of urine cotinine concentration for creatinine was not better correlated with serum concentration than absolute urine cotinine concentration. To our knowledge, no such study has been conducted with low-level nicotine exposure, as would be relevant to SHS exposure.
Cotinine is eliminated from the body primarily by metabolism and to a lesser extent by renal excretion (Hukkanen et al., 2005). On average, 15% of cotinine is excreted unchanged in the urine. The major metabolites of cotinine found in urine are cotinine glucuronide (representing 20% of cotinine elimination on average), trans-3′-hydroxycotinine (3HC; representing 50% of cotinine elimination on average), and 3HC glucuronide (representing 10% of cotinine elimination on average). Some researchers (e.g., Hecht et al., 1999, 2005, 2007) have routinely used the sum of urine cotinine and cotinine glucuronide as the preferred urine biomarker of nicotine intake from tobacco. Furthermore, using the sum of cotinine plus 3HC also might improve the correlation with plasma cotinine, as well as increase sensitivity because 3HC concentrations in urine are much higher than those of cotinine (Hukkanen et al., 2005). Neither of these approaches to using urine metabolites as estimators for plasma cotinine has been validated.
In the present study, we gave nonsmokers low doses of deuterium-labeled nicotine for several days to mimic exposure to SHS. We measured concentrations of cotinine in plasma and concentrations of nicotine metabolites in urine at steady state. The study addresses the following questions: (a) Does adjustment of urine cotinine for creatinine concentration improve the correlation with plasma cotinine concentration? (b) Does measurement of the sum of cotinine and cotinine glucuronide improve the correlation with plasma cotinine concentration? (c) Does measurement of cotinine plus 3HC improve the correlation with plasma cotinine concentration? (d) Does time of day of urine measurement affect the correlation between urine metabolite concentrations and plasma cotinine?
Methods
The subjects were 36 healthy nonsmokers, recruited using flyers at local colleges, newspaper advertisements, and a notice on a local Web site. The average participant age was 32.6 years (range = 20–61). Race/ethnicity of the subjects was as follows: 20 non-Hispanic Whites, 5 Hispanics, 8 Asians, and 3 non-Hispanic Blacks. Subjects were studied in three groups of 12. All subjects within a group received the same dose of nicotine, but each group received a different dose of nicotine. Each group included equal numbers of men and women. Subjects were compensated financially for their participation. Written informed consent was obtained from each subject. The study was approved by the University of California San Francisco Committee on Human Research.
Experimental protocol
Groups of subjects received deuterium-labeled nicotine orally in doses of 100, 200, or 400 μg per day, respectively, for 5 days. Five days were selected as an adequate time for plasma cotinine levels and urine nicotine metabolite levels to reach steady state. The doses of nicotine were selected to be similar to doses of nicotine that might be absorbed systemically during exposure to SHS (N. L. Benowitz, 1996). The total daily dose was distributed into four equal doses to simulate exposure to nicotine from SHS over a period of 12 hr of each day. For the first 4 days, subjects took the doses at home. On the final (fifth) day, subjects were admitted to the General Clinical Research Center at San Francisco General Hospital Medical Center, where oral nicotine was administered on the same schedule as the previous 4 days and blood sampling and urine collection were carried out over 24 hr.
Deuterium-labeled nicotine (nicotine-3′-3′-d2) was synthesized in our laboratory and prepared for human administration as described previously (Jacob, Benowitz, & Shulgin, 1988). Deuterium-labeled nicotine was administered so that we could differentiate exposure to nicotine that we provided (in known doses) from exposure to natural nicotine from SHS or from food. Nicotine was prepared in vials containing 10 ml of water. The vials were stored refrigerated until they were dispensed to subjects to take home. Subjects were instructed to take their nicotine doses at 8 a.m., noon, 4 p.m., and 8 p.m. Subjects were given timers to take home that were programmed to signal the times at which each dose was supposed to be taken. Subjects also were asked to record in a log book the date and time when they drank the contents of each vial.
On the morning of day 5, subjects were admitted to the General Clinical Research Center. Blood was obtained at 8 a.m., noon, 4 p.m., and 8 p.m. for measurement of plasma concentrations of nicotine, cotinine, and 3HC. Urine was collected in five blocks at intervals of 8 a.m. to noon, noon to 4 p.m., 4 p.m. to 8 p.m., 8 p.m. to midnight, and midnight to 8 a.m.
Analytical chemistry
Concentrations of nicotine, cotinine, and 3HC in plasma and urine samples were measured by liquid chromatography–tandem mass spectrometry (Dempsey et al., 2004). Urine samples were assayed before and after deconjugation with a glucuronidase enzyme, as described previously (N. L. Benowitz, Jacob, Fong, & Gupta, 1994). The concentration before deconjugation represents the free (unconjugated) concentration, whereas the concentration after deconjugation represents the total (sum of free and conjugated) metabolite.
Data analyses
The primary analysis was linear regression comparing various urine analyte concentrations, with and without correction for creatinine, to the 12-hr average plasma cotinine concentrations. The average of the four plasma cotinine concentrations measured over 12 hr was taken as the best approximation of the steady-state cotinine concentration. As shown in Figure 1, cotinine concentrations were stable throughout the day, so there is little difference in the results from analyzing individual timepoints versus 12-hr average concentrations. Urine metabolite analyses included free cotinine, total (free plus conjugated) cotinine, the sum of free cotinine and free 3HC, and the sum of total cotinine and 3HC—all with and without correction for urine creatinine. Because women on average produce and excrete less creatinine per day than men, a creatinine correction for sex differences was performed (multiplying creatinine concentration in men by 0.68; Jacobs et al., 2002). Analyses were conducted with and without this correction for sex.
Figure 1.

Mean plasma cotinine concentrations at various times of day with three different levels of nicotine intake. Triangles = 400 μg/day (n = 12); squares = 200 μg/day (n = 12); diamonds = 100 μg/day (n = 12). Bars indicate SEM.
Renal clearance of cotinine was computed as Cl r = [U cot]/[AUC − Pl cot], where [U cot] is the amount of cotinine excreted in the urine over 12 hr (8 a.m. to 8 p.m.) and [AUC − Pl cot] is the area under the plasma cotinine concentration–time from 8 a.m. to 8 p.m., determined using the trapezoidal rule. In addition, urine cotinine to plasma cotinine ratios were computed using urine concentrations collected from the 8 a.m. to noon, noon to 4 p.m., and 4 p.m. to 8 p.m. intervals and the average of the plasma cotinine concentration measured at the beginning and end of each urine collection interval.
Results
Figure 1 shows the average plasma cotinine concentrations throughout the day for subjects receiving the three doses of nicotine. Across the day, average plasma cotinine concentrations were 1.07 ng/ml (95% CI = 0.88–1.46), 2.3 ng/ml (95% CI = 1.8–2.8), and 4.3 ng/ml (95% CI = 3.1–5.0) for the 100, 200, and 400 μg/day dose levels, respectively. Figure 2 shows average concentrations of cotinine, cotinine glucuronide, 3HC, and 3HC glucuronide in the urine of subjects receiving the 200-μg nicotine dose at various times of day. The shapes of the curves for the 100- and the 400-μg nicotine dosing groups (data not shown) were similar.
Figure 2.

Mean urine concentrations of cotinine, cotinine glucuronide, trans-3′-hydroxycotinine (3HC), and 3HC glucuronide at various times of day in subjects receiving 200 μg nicotine per day (n = 12). SEM for the analytes are not shown for the sake of clarity, but average SEMs throughout the day were 8.5 for cotinine-d2, 11.4 for cotinine-d2 glucuronide, 36.8 for 3HC-d2, and 15.1 for 3HC-d2 glucuronide. Factors to convert units from pmol/ml to ng/ml are 0.178, 0.354, 0.194, and 0.370 for the four analytes, respectively. MN = midnight.
As shown in Figure 3 and Table 1, urine cotinine corrected for creatinine was in general more highly correlated with plasma cotinine than was cotinine without correction. For example, for the noon to 4 p.m. urine sample, a likely time of day for spot urine collections in clinical research studies, the correlation for urine versus plasma cotinine was 0.78, the 95% CI of which (0.61 to 0.88) did not overlap with the higher correlation of 0.91 between urine cotinine corrected for creatinine versus plasma cotinine. Sex correction of creatinine values had little effect on the correlation coefficients. The sum of cotinine and cotinine glucuronide did not correlate as well with plasma cotinine as did urine cotinine alone, with or without correction for creatinine, although the difference in strength of correlation at some times of day was quite small (see Table 1). Likewise, urine 3HC or the sum of urine cotinine plus 3HC, with or without their glucuronide conjugates, did not generally correlate as well with plasma cotinine as did urine cotinine alone. Correlations between urine cotinine and other urine metabolites with plasma cotinine tended to be strongest in the morning collection (8 a.m. to noon) compared with other times of day. The highest correlation between plasma cotinine and urine cotinine per milligram creatinine was found using the 24-hr pooled urine concentration. The correlation coefficients were .91, when measured at either 8 a.m. to noon or noon to 4 p.m., and .95, when measured over 24 hr. As expected, correction of urine cotinine for creatinine concentration had less effect on the correlations using 24-hr urine samples than on the correlations using the urines sampled at particular times of day.
Figure 3.
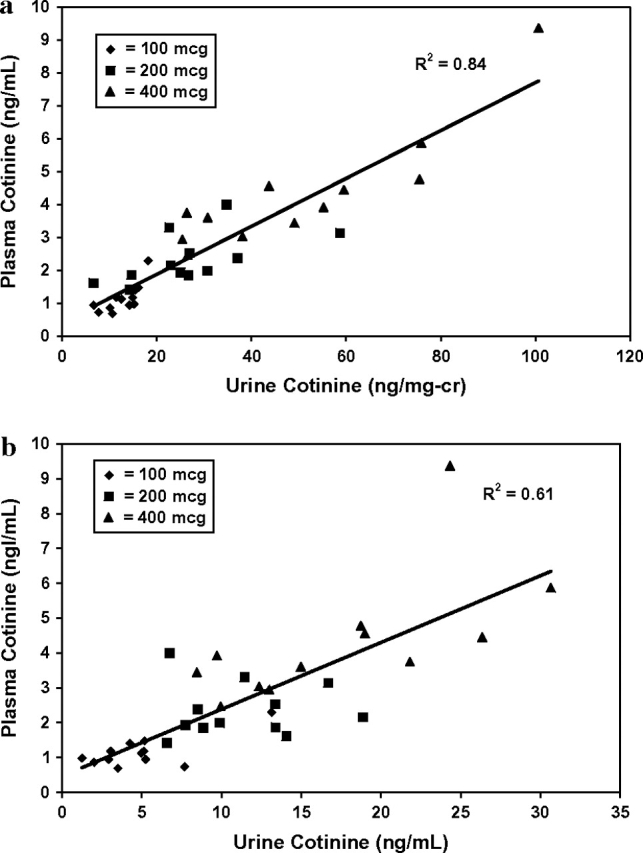
Plasma versus urinary cotinine concentrations using a 12-hr average plasma cotinine level and noon–4 p.m. urine cotinine concentrations. Data were from 36 subjects: 12 received 100 μg nicotine per day (diamonds), 12 received 200 μg/day (squares), and 12 received 400 μg/day (triangles). (A) Urine cotinine concentration corrected for creatinine concentration. (B) Uncorrected urine cotinine concentration.
Table 1.
Correlations between 12-hr average plasma cotinine concentration and cotinine and metabolite concentrations in urine samples collected at various times of day (N = 36)
| Urine analyte | 8 a.m.–noon | Noon–4 p.m. | 4 p.m.–8 p.m. | 8 p.m.–midnight | Midnight–8 a.m. | 24 hr |
| COT (ng/ml) | 0.83 | 0.78 | 0.53 | 0.70 | 0.90 | 0.91 |
| COT (ng/mg creatinine) | 0.91 | 0.91 | 0.82 | 0.88 | 0.83 | 0.95 |
| COT (ng/mg creatinine)a | 0.93 | 0.88 | 0.79 | 0.91 | 0.78 | 0.95 |
| (COT + COTG) (ng/ml) | 0.69 | 0.74 | 0.60 | 0.48 | 0.59 | 0.77 |
| (COT + COTG) (ng/mg creatinine) | 0.88 | 0.77 | 0.80 | 0.82 | 0.73 | 0.86 |
| (COT + COTG) (ng/mg creatinine)a | 0.90 | 0.76 | 0.78 | 0.83 | 0.72 | 0.86 |
| 3HC (ng/ml) | 0.38 | 0.31* | 0.14* | 0.26* | 0.36 | 0.57 |
| 3HC (ng/mg creatinine) | 0.68 | 0.58 | 0.42 | 0.72 | 0.58 | 0.64 |
| 3HC (ng/mg creatinine)a | 0.69 | 0.58 | 0.44 | 0.75 | 0.62 | 0.67 |
| (COT + 3HC) (ng/ml) | 0.55 | 0.50 | 0.25* | 0.37 | 0.47 | 0.75 |
| (COT + 3HC) (ng/mg creatinine) | 0.85 | 0.77 | 0.61 | 0.85 | 0.73 | 0.83 |
| (COT + 3HC) (ng/mg creatinine)a | 0.87 | 0.77 | 0.62 | 0.89 | 0.76 | 0.85 |
| (COT + COTG + 3HC + 3HCG) (ng/ml) | 0.48 | 0.50 | 0.39 | 0.31* | 0.44 | 0.69 |
| (COT + COTG + 3HC + 3HCG) (ng/mg creatinine) | 0.80 | 0.67 | 0.74 | 0.75 | 0.67 | 0.77 |
| (COT + COTG + 3HC + 3HCG) (ng/mg creatinine)a | 0.83 | 0.70 | 0.74 | 0.77 | 0.70 | 0.79 |
Note. COT = cotinine; COTG = cotinine glucuronide; 3HC = trans-3′-hydroxycotinine; 3HCG = 3HC glucuronide.
Creatinine corrected for sex.
*nonsignificant; p > .05 (all other correlations were significant).
The ratios of urine cotinine to plasma cotinine averaged 4.24, with a range of 0.65 to 10.35, and urine cotinine per milligram creatinine to plasma cotinine ratios averaged 0.11 with a range of 0.04 to 0.24 (Table 2). This ratio was not different at different dose levels, but it was significantly lower in the 4 p.m. to 8 p.m. collection than in those from earlier times of day.
Table 2.
Ratios of urine to plasma cotinine concentrations at various times of daya
| 8 a.m.–noon |
Noon–4 p.m. |
4 p.m.–8 p.m. |
|||||||
| Ratio | Mean | 95% CI | Range | Mean | 95% CI | Range | Mean | 95% CI | Range |
| U cot/Pl cot uncorrected | 4.44 | 3.99–5.00 | 1.79–7.84 | 4.58 | 3.91–5.24 | 1.27–10.35 | 3.71* | 3.85–4.37 | 0.65–8,28 |
| U cot/Pl cot per microgram creatinine | 0.116 | 0.103–0.128 | 0.05–0.19 | 0.116 | 0.105–0.127 | 0.04–0.19 | 0.100 | 0.086–0.113 | 0.04–0.24 |
Note. U cot = urine cotinine; Pl cot = plasma cotinine.
Based on average urine cotinine concentration for each collection interval and the mean of plasma cotinine concentration measured at the beginning and the end of each interval.
*Significantly different from other times of day, p < .01.
Renal clearances of cotinine averaged 9.2 ml/min (95% CI = 7.3–11.2), 8.l ml/min (6.4–9.9), and 9.2 ml/min (7.8–10.5) for the 100, 200, and 400 μg daily dose groups, respectively (Table 3). Urine clearance of cotinine was significantly greater for men than women, but this difference was no longer present after clearance was corrected for body weight.
Table 3.
Renal clearance of cotinine in different nicotine dosing groups
| Clearance (ml/min) |
Clearance (ml/min/kg) |
|||||
| Nicotine dose | Mean | 95% CI | Range | Mean | 95% CI | Range |
| Group 1 (100 μg) | 9.2 | 7.3–11.2 | 4.8–14.7 | 0.12 | 0.10–0.14 | 0.07–0.17 |
| Group 2 (200 μg) | 8.1 | 6.4–9.8 | 4.8–11.7 | 0.12 | 0.10–0.14 | 0.06–0.16 |
| Group 3 (400 μg) | 9.2 | 7.8–10.5 | 5.3–12.6 | 0.12 | 0.10–0.13 | 0.09–0.16 |
| All subjects | 8.9 | 9.0–9.7 | 4.8–14.7 | 0.12 | 0.11–0.13 | 0.06–0.17 |
| All men | 10.3* | 9.3–11.4 | 6.2–14.7 | 0.13 | 0.10–0.16 | 0.08–0.17 |
| All women | 7.7* | 4.8–10.6 | 4.8–11.5 | 0.11 | 0.08–0.15 | 0.07–0.16 |
Note. * Comparison men vs. women, p = .0002.
Discussion
Urine cotinine is used widely as a noninvasive marker of nicotine exposure in smokers as well as in nonsmokers who are exposed to SHS (N. L. Benowitz, 1996; U.S. Department of Health and Human Services, 2006). Urine measurement has an advantage over plasma cotinine in that concentrations in urine are four- to fivefold higher and easier to measure in most laboratories, and urine collection is less invasive than blood sampling.
We simulated nicotine exposure from SHS by administering deuterium-labeled nicotine orally in low doses at regular intervals throughout the day. Nicotine taken orally undergoes hepatic first-pass metabolism, so that the ratio of nicotine to cotinine in plasma is lower than when nicotine is inhaled in tobacco smoke. In contrast to nicotine, cotinine undergoes little or no first-pass metabolism (Zevin, Jacob, Geppetti, & Benowitz, 2000). Therefore, cotinine and cotinine metabolite measurements would not be expected to differ after oral administration compared with after inhalation of nicotine.
We found that, on average (across all dosing groups), approximately 1 ng/ml cotinine in plasma at steady state corresponds to a dose of 100 μg nicotine per day. Because considerable individual variability was observed in plasma cotinine levels at any particular dose of nicotine (see Figure 3), the use of plasma cotinine to estimate daily nicotine intake for individuals is only a rough estimate. Urine cotinine concentrations were highly correlated with plasma cotinine concentrations. The extent of correlation was improved substantially by a correction of urine cotinine concentration for urine creatinine. This finding differs from those of Thompson et al. (1990) in smokers. They found no improvement in the correlation between urine cotinine and plasma cotinine concentrations with simple creatinine correction, although they did improve the correlation when they corrected for creatinine using a regression equation.
The strength of the correlation between urine and plasma cotinine concentration varied somewhat with time of day. Correlations tended to be stronger using the morning collection (8 a.m. to noon) compared with other times of day and strongest using the 24-hr pooled collection.
Cotinine in plasma is eliminated unchanged in the urine as well as via metabolism. The major metabolites of cotinine include cotinine glucuronide, 3HC, and 3HC glucuronide, with minor routes of metabolism to cotinine-N-oxide, 5′-hydroxycotinine, and 5′-hydroxynorcotinine (Hukkanen et al., 2005). It might be expected that the sum of cotinine plus cotinine glucuronide would better estimate plasma cotinine. However, this was not the case. Urine cotinine alone was more highly correlated with plasma cotinine compared with the sum of cotinine plus cotinine glucuronide.
3HC is the most prevalent metabolite of cotinine in the urine (Hukkanen et al., 2005). Therefore, measurement of the sum of cotinine plus 3HC would substantially increase the analytical sensitivity of urine measurements with low-level cotinine exposure. We found that the sum of cotinine plus 3HC with or without their glucuronides did not correlate as well with plasma cotinine as did urine cotinine alone.
Renal clearance of cotinine averaged about 9 ml/min and was not affected by the dose of nicotine. This represents 15%–20% of total cotinine clearance, similar to that reported in prior studies (Hukkanen et al., 2005). Men had higher renal clearance of cotinine than women, but this difference disappeared when corrected for body weight. This finding is consistent with the fact that men have higher glomerular filtration rates and greater kidney mass than women (Schwartz, 2007).
Our data on the relationship between plasma cotinine and the daily dose of nicotine indicates that plasma cotinine can be used to quantitatively estimate daily exposure to nicotine when an individual is exposed to SHS. Each 1 ng/ml plasma cotinine represents on average exposure to 100 μg nicotine per day, although considerable individual variability exists. The relationship can be used to estimate daily nicotine exposure in population studies but is less accurate for individuals. Our data on the ratio of urine to plasma cotinine (on average, 4 to 5) allow the use of urine cotinine to estimate plasma cotinine and, in turn, the daily exposure to nicotine from tobacco smoke.
We provide compelling evidence that correction of urine cotinine for creatinine concentration improves the correlation between urine and plasma cotinine, particularly for urine sampled at particular times of day (that is, spot urines). We therefore recommend creatinine correction for future studies. Since correlations between urine cotinine and plasma cotinine are highest in morning urine collections, we recommend samples at that time of day, although correlations remain robust throughout the day. Men and women differ in their daily creatinine excretion due to differences in muscle mass. However, sex correction for urine creatinine did not improve the correlation with plasma cotinine and, therefore, is not necessary.
Although there is reason to believe that measuring multiple cotinine metabolites in urine might enhance the correlation between urine measurements and plasma cotinine, our data did not support this hypothesis. Measurement of urine cotinine corrected for creatinine appears to be the best predictor of plasma cotinine concentration. However, in some situations, urine cotinine concentrations may be below the limit of quantitation. In these cases, the measurement of cotinine plus its glucuronide with or without the measurement of 3HC would enhance sensitivity and would allow a reasonable estimate of plasma cotinine concentration.
This paper focused on predictors of plasma cotinine, which has been the most widely used biomarker and is considered by many researchers to be the gold standard for estimating nicotine exposure from SHS in epidemiology and treatment studies. The optimal urine metabolites to predict daily nicotine intake might differ from those that best predict plasma cotinine concentration. An analysis of the relationship between urine metabolites and nicotine intake will be the subject of a future paper.
Funding
This research was supported by the Flight Attendants Medical Research Institute and U.S. Public Health Service (grants DA02277 and DA12393) and was carried out in part at the General Clinical Research Center at San Francisco General Hospital, with support of the Division of Research Resources (NIH RR00083).
Declaration of Interests
None declared.
Supplementary Material
Acknowledgments
The authors thank Lita Ramos and Janice Cheng for performing the analytical chemistry, Faith Allen for data management, Gunnard Modin for statistical consultation, and Marc Olmsted for editorial assistance.
References
- Benowitz N, Lessov-Schlaggar C, Swan G. Genetic influences in the variation in renal clearance of nicotine and cotinine. Clinical Pharmacology and Therapeutics. 2008;84:243–247. doi: 10.1038/clpt.2008.54. [DOI] [PubMed] [Google Scholar]
- Benowitz NL. Cotinine as a biomarker of environmental tobacco smoke exposure. Epidemiological Reviews. 1996;18:188–204. doi: 10.1093/oxfordjournals.epirev.a017925. [DOI] [PubMed] [Google Scholar]
- Benowitz NL, Jacob P, III, Fong I. Gupta S. Nicotine metabolic profile in man: Comparison of cigarette smoking and transdermal nicotine. Journal of Pharmacology and Experimental Therapeutics. 1994;268:296–303. [PubMed] [Google Scholar]
- Dempsey D, Tutka P, Jacob P, III, Allen F, Schoedel K, Tyndale RF, et al. Nicotine metabolite ratio as an index of cytochrome P450 2A6 metabolic activity. Clinical Pharmacology and Therapeutics. 2004;76:64–72. doi: 10.1016/j.clpt.2004.02.011. [DOI] [PubMed] [Google Scholar]
- Hecht SS, Carmella SG, Chen M, Dor Koch JF, Miller AT, Murphy SE, et al. Quantitation of urinary metabolites of a tobacco-specific lung carcinogen after smoking cessation. Cancer Research. 1999;59:590–596. [PubMed] [Google Scholar]
- Hecht SS, Carmella SG, Murphy SE, Riley WT, Le C, Luo X, et al. Similar exposure to a tobacco-specific carcinogen in smokeless tobacco users and cigarette smokers. Cancer Epidemiology, Biomarkers and Prevention. 2007;16:1567–1572. doi: 10.1158/1055-9965.EPI-07-0227. [DOI] [PubMed] [Google Scholar]
- Hecht SS, Murphy SE, Carmella SG, Li S, Jensen J, Le C, et al. Similar uptake of lung carcinogens by smokers of regular, light, and ultralight cigarettes. Cancer Epidemiology, Biomarkers and Prevention. 2005;14:693–698. doi: 10.1158/1055-9965.EPI-04-0542. [DOI] [PubMed] [Google Scholar]
- Hukkanen J, Jacob P., III Benowitz NL. Metabolism and disposition kinetics of nicotine. Pharmacological Reviews. 2005;57:79–115. doi: 10.1124/pr.57.1.3. [DOI] [PubMed] [Google Scholar]
- Jacob P, III, Benowitz NL. Shulgin AT. Synthesis of optically pure deuterium-labeled nicotine, nornicotine and cotinine. Journal of Labeled Compounds and Radiopharmaceuticals. 1988;25:1117–1128. [Google Scholar]
- Jacobs DR, Jr, Murtaugh MA, Steffes M, Yu X, Roseman J, Goetz FC. Gender- and race-specific determination of albumin excretion rate using albumin-to-creatinine ratio in single, untimed urine specimens: The Coronary Artery Risk Development in Young Adults Study. American Journal of Epidemiology. 2002;155:1114–1119. doi: 10.1093/aje/155.12.1114. [DOI] [PubMed] [Google Scholar]
- Pirkle JL, Bernert JT, Caudill SP, Sosnoff CS, Pechacek TF. Trends in the exposure of nonsmokers in the U.S. population to secondhand smoke: 1988–2002. Environmental Health Perspectives. 2006;114:853–858. doi: 10.1289/ehp.8850. [DOI] [PMC free article] [PubMed] [Google Scholar]
- Schwartz JB. The current state of knowledge on age, sex, and their interactions on clinical pharmacology. Clinical Pharmacology and Therapeutics. 2007;82:87–96. doi: 10.1038/sj.clpt.6100226. [DOI] [PubMed] [Google Scholar]
- Strachan DP, Jarvis MJ, Feyerabend C. The relationship of salivary cotinine to respiratory symptoms, spirometry, and exercise-induced bronchospasm in seven-year-old children. American Review of Respiratory Disease. 1990;142:147–151. doi: 10.1164/ajrccm/142.1.147. [DOI] [PubMed] [Google Scholar]
- Thompson SG, Barlow RD, Wald NJ, Van Vunakis H. How should urinary cotinine concentrations be adjusted for urinary creatinine concentration? Clinica Chimica Acta. 1990;187:289–296. doi: 10.1016/0009-8981(90)90114-8. [DOI] [PubMed] [Google Scholar]
- U.S. Department of Health and Human Services. The health consequences of involuntary exposure to tobacco smoke: A report of the Surgeon General. Rockville, MD: U.S. Department of Health and Human Services; 2006. [Google Scholar]
- Whincup PH, Gilg JA, Emberson JR, Jarvis MJ, Feyerabend C, Bryant A, et al. Passive smoking and risk of coronary heart disease and stroke: prospective study with cotinine measurement. British Medical Journal. 2004;329:200–205. doi: 10.1136/bmj.38146.427188.55. [DOI] [PMC free article] [PubMed] [Google Scholar]
- Zevin S, Jacob P, III, Geppetti P. Benowitz NL. Clinical pharmacology of oral cotinine. Drug and Alcohol Dependence. 2000;60:13–18. doi: 10.1016/s0376-8716(99)00135-0. [DOI] [PubMed] [Google Scholar]
Associated Data
This section collects any data citations, data availability statements, or supplementary materials included in this article.