

Abstract
Background:
It is common to find substantial Alzheimer disease (AD) lesions, i.e., neuritic β-amyloid plaques and neurofibrillary tangles, in the autopsied brains of elderly subjects with normal cognition assessed shortly before death. We have termed this status asymptomatic AD (ASYMAD). We assessed the morphologic substrate of ASYMAD compared to mild cognitive impairment (MCI) in subjects from the Nun Study. In addition, possible correlations between linguistic abilities in early life and the presence of AD pathology with and without clinical manifestations in late life were considered.
Methods:
Design-based stereology was used to measure the volumes of neuronal cell bodies, nuclei, and nucleoli in the CA1 region of hippocampus (CA1). Four groups of subjects were compared: ASYMAD (n = 10), MCI (n = 5), AD (n = 10), and age-matched controls (n = 13). Linguistic ability assessed in early life was compared among all groups.
Results:
A significant hypertrophy of the cell bodies (+44.9%), nuclei (+59.7%), and nucleoli (+80.2%) in the CA1 neurons was found in ASYMAD compared with MCI. Similar differences were observed with controls. Furthermore, significant higher idea density scores in early life were observed in controls and ASYMAD group compared to MCI and AD groups.
Conclusions:
1) Neuronal hypertrophy may constitute an early cellular response to Alzheimer disease (AD) pathology or reflect compensatory mechanisms that prevent cognitive impairment despite substantial AD lesions; 2) higher idea density scores in early life are associated with intact cognition in late life despite the presence of AD lesions.
GLOSSARY
- ACG
= anterior cingulate gyrus;
- AD
= Alzheimer disease;
- ADL
= activities of daily living;
- ASYMAD
= asymptomatic Alzheimer disease;
- BLSA
= Baltimore Longitudinal Study of Aging;
- CERAD
= Consortium to Establish a Registry for Alzheimer’s Disease;
- H-E
= hematoxylin-eosin;
- MCI
= mild cognitive impairment;
- MMSE
= Mini-Mental State Examination;
- NFT
= neurofibrillary tangles;
- NP
= neuritic plaques;
- PCG
= posterior cingulate gyrus;
- PVC
= primary visual cortex.
A puzzling feature of the neurobiology of Alzheimer disease (AD) is the heterogeneity of clinical outcomes in individuals with comparable degrees of pathologic lesions in the brain. The systematic neuropathologic assessment of older adults, particularly participants in longitudinal studies of aging, has revealed that many individuals with documented normal clinical status shortly before death have substantial AD lesions, β-amyloid neuritic plaques (NP) and neurofibrillary tangles (NFT), that can be as severe and have the same distribution as in subjects with mild cognitive impairment (MCI),1 and even in some cases of AD dementia.2,3 In previous studies, this clinical-pathologic status has been reported under various names, such as high pathology controls4 or preclinical AD.5 Since it is not possible to know a priori whether these subjects would have remained clinically intact or eventually would have progressed to MCI or dementia if they had lived longer, we have termed this status asymptomatic AD (ASYMAD).6,7 The clinical-pathologic dissociation that characterizes ASYMAD is substantiated when the AD lesions in these subjects are assessed using standard neuropathologic criteria, i.e., the Consortium to Establish a Registry for Alzheimer’s Disease (CERAD) criteria for NP8 and Braak staging system for NFT,9 and show comparable scores to those present in MCI and in some cases of AD dementia.10
In previous studies6,7 of ASYMAD in the Baltimore Longitudinal Study of Aging (BLSA), we found significant hypertrophy of cell bodies, nuclei, and nucleoli in neurons of CA1-hippocampus (CA1), anterior cingulate gyrus (ACG), posterior cingulate gyrus (PCG), and primary visual cortex (PVC). The neuronal hypertrophy followed an anatomic progression starting from the more anterior regions (CA1 and ACG) in ASYMAD to the more posterior regions, i.e., PCG in MCI, and then PVC in AD. This pattern of progression (CA1-hippocampus/cingulum/occipital cortex) of neuronal hypertrophy matches the topographic sequence of AD pathology as described by Braak & Braak decades ago.9 We have proposed that the hypertrophy of neurons in ASYMAD, as compared to MCI, may reflect a compensatory response to the AD pathology that prevents cognitive decline and accounts for the divergent clinical outcomes of these 2 groups of subjects.
Our previous studies6,7 examined subjects from the BLSA study,11 most of whom were men (75%). The main objective of the present study was to quantify the same morphometric parameters that we examined in the BLSA study, but in a different longitudinal cohort. The Nun Study was ideally suited to this end since all the enrolled subjects are women, therefore complementing the predominance of men in the BLSA study, and all participants had well-documented, rigorous clinical and neuropathologic evaluations. Moreover, many of the participants have available data on linguistic abilities in early life. Based on clinical and autopsy assessments, we defined, similarly as in BLSA studies, 4 groups of subjects: 1) age-matched controls, 2) ASYMAD, 3) MCI, and 4) AD, as defined below. The present study focused on the CA1 region of the hippocampus,12,13 a region which is particularly vulnerable to AD pathogenesis.
METHODS
Clinical and cognitive data.
Participants in the Nun Study are Catholic sisters, who are members of the School Sisters of Notre Dame congregation living in the United States.14 All sisters born before 1917 were asked to participate in the study. Informed written consent was obtained from 678 sisters and they were all enrolled in the study between 1991 and 1993. In the present study, a subset of participants in the Nun Study was selected for the morphometric analyses. Investigations of the Nun Study were approved by the University of Kentucky’s Institutional Review Board.
Selection criteria.
We selected the subjects from the Nun Study database according to the following criteria: 1) cognitive assessment performed less than 12 months before death; 2) availability of CA1-hippocampus tissue sections; 3) exclusion of cases with cerebrovascular diseases, primary or secondary brain tumors, or neurodegenerative diseases other than AD, such as Lewy body diseases or tauopathies. Based on these selection criteria, identical to our previous BLSA studies, we identified and examined the brains of 38 subjects.
Clinical evaluations.
The tools used to diagnose intact cognitive status, MCI, and dementia have been described in previous Nun Study publications.15 Briefly, participants classified as cognitively intact had scores within normal limits on 4 cognitive tests in the neuropsychological battery of CERAD.16,17 They also had intact global cognitive ability as measured by the Mini-Mental State Examination (MMSE)18 and were intact regarding activities of daily living (ADL).19 Sisters with MCI had intact global cognitive function and ADL, but had at least 1 specific area of cognition impaired (usually memory or naming). Dementia patients demonstrated functional decline, with impairments in memory and at least one other area of cognitive function, and impaired ADL. For a more detailed description of the criteria used, see Snowdon et al.14
We had available scores on linguistic abilities in 14 subjects, i.e., idea density and grammatic complexity, obtained from essays that the participants wrote as they entered the convent in their late teens or early 20s. A complete and detailed description of these language variables is reported in Snowdon et al.14 Briefly, idea density was defined as the average number of ideas expressed per 10 words. Ideas corresponded to elementary propositions, typically a verb, adjective, or prepositional phrase. The grammatic complexity was computed using the Developmental Level metric originally developed by Rosenberg and Abbeduto.20
Neuropathologic material and methods.
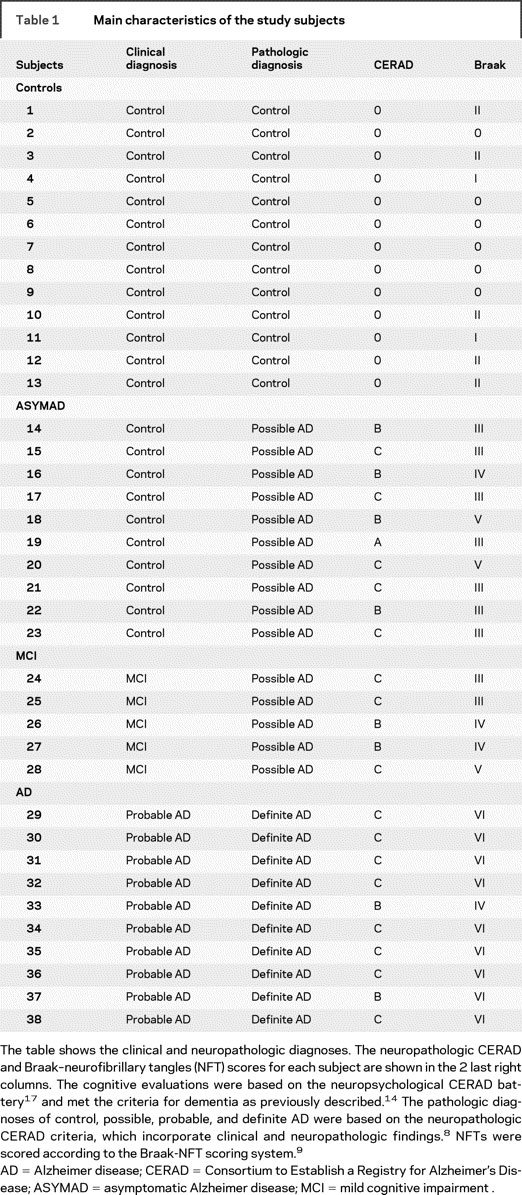
We examined a total of 38 postmortem brains. Brains were removed and examined macroscopically after fixation in 10% buffered formaldehyde for at least 2 weeks. For diagnostic purposes, tissue blocks were dissected from middle frontal gyrus, superior and middle temporal gyri, inferior parietal lobule, occipital cortex (Brodmann areas 17-18), entorhinal cortex, hippocampus, amygdala, thalamus, basal ganglia, and cerebellum. Tissue blocks were processed and embedded in paraffin, cut at 10 μm, and stained with hematoxylin-eosin (H-E) and Hirano-silver method21 for diagnostic purposes. The severity of NP was assigned a semiquantitative and age-adjusted score (0, A, B, or C) according to CERAD8 and the NFT stage was scored (0-VI) according to Braak9 (table 1).
Table 1 Main characteristics of the study subjects
Definition of study groups.
Based on the clinical and neuropathologic criteria described above, we distinguished 4 different groups: 1) controls (n = 13): these age-matched control subjects had normal cognition and no significant AD pathology at autopsy (CERAD 0, Braak 0-II); 2) ASYMAD (n = 10): subjects with normal cognition and AD pathology (CERAD B-C, Braak III-V); 3) MCI (n = 5): subjects with a diagnosis of MCI and AD pathology (CERAD B-C, Braak III-V); 4) AD (n = 10): patients with dementia and definite AD pathology at autopsy (CERAD B-C, Braak IV-VI).
Demographic, cognitive, and neuropathologic data for each subject are summarized in tables 1 and 2.
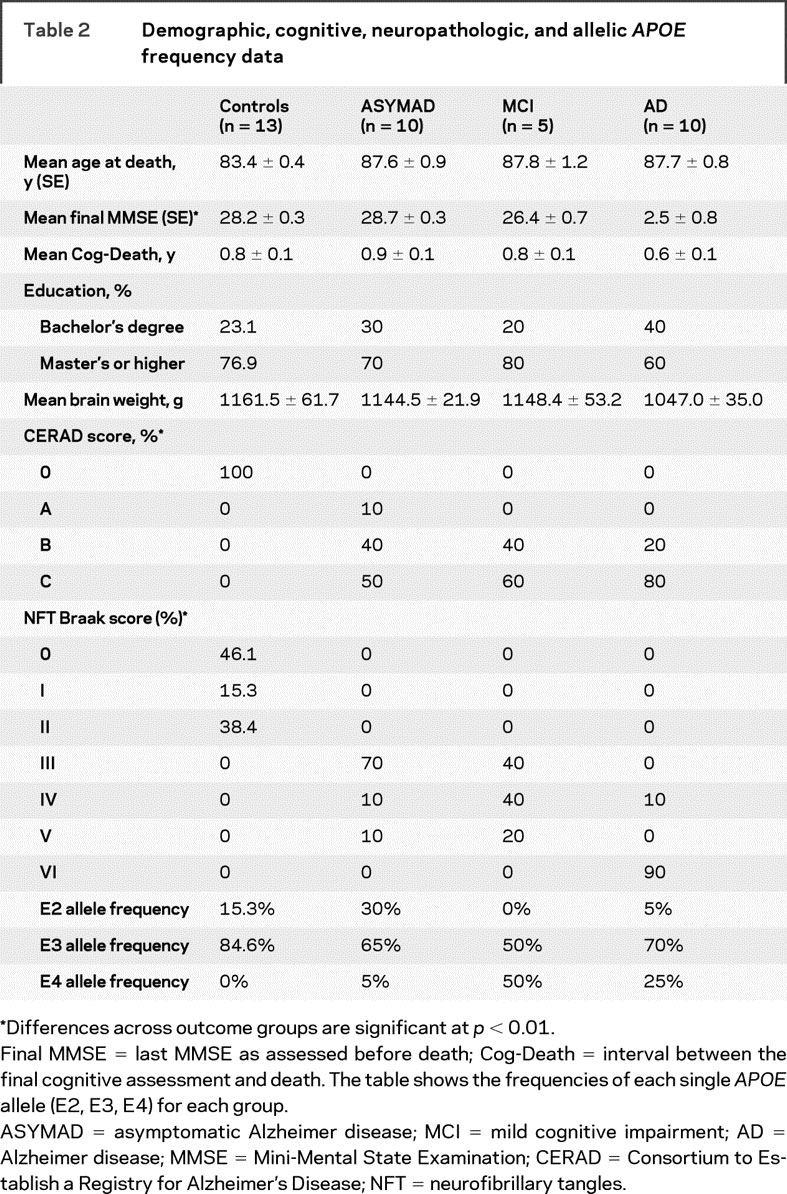
Table 2 Demographic, cognitive, neuropathologic, and allelic APOE frequency data
Stereologic methods.
Serial coronal sections (50 μm thick) from the right CA1-hippocampus region at the level of the lateral geniculate nucleus were obtained. From these sections, we selected randomly 2 sections 500 μm apart and stained them with cresyl violet. For the stereologic analysis, we examined the 2 sections of CA1 with a light microscope interfaced with a StereoInvestigator system.22 Using a 100×, NA 1.30, oil Uplan FL ∞/0.17 objective, the images were captured with a video camera Hitachi HV-C20 3CCD. With the StereoInvestigator Optical Disector software, we outlined the contour of CA1 and selected sampling sites with a grid size = 250 × 250 μm. The CA1 region was defined according to Lorente De No’.23 The disector height was 35 μm with a 2-μm guard zone. Then, using the Isotropic Nucleator probe,24 we placed 8 rays through the center of the nucleolus and marked the intersections of these rays with the edge of the nucleolus, nuclear membrane, and cellular membrane. Based on these measurements, the software calculates the volumes of the nucleolus, nucleus, and cell body. If a ray extended into a dendrite, the ray was cut at the base of the dendrite (figures 1 and 2). We measured between 201 and 238 neurons per each CA1 region. Neurons were measured if their cell bodies were inside the sampling site or if their nuclear membrane intersected or touched the inclusion (green) line. Neurons were excluded if their nuclear membrane intersected or touched the exclusion (red) line. The neurons measured were selected with optical disectors so that the selection was number-weighted, not size-weighted. All stereologic assessments were performed blinded to the clinical and neuropathologic classifications.

Figure 1 Cell body, nuclear, and nucleolar markers for morphometric measurements
(A) Large coronal section of a formalin-fixed brain of a control subject (left hemisphere). (B) Single pyramidal neuron from the CA1-hippocampus region, the specific markers for the morphometric measurements of cell body (a), nucleus (b), and nucleolus (c). The pictures of a, b, and c were realized with a digital camera connected with a light microscope using an oil-objective at 100× magnification.

Figure 2 Pyramidal neurons in 2 different clinicopathologic conditions
(A) Large coronal section of a formalin-fixed brain of a control subject (left hemisphere). (B) Cell body, nuclear, and nucleolar contours of a single pyramidal neuron from the CA1-hippocampus region of an asymptomatic Alzheimer disease (ASYMAD) (a, b, c) and control (d, e, f) subject. Notice the clear enlargements of all 3 neuronal compartments in the ASYMAD subject compared to the age-matched control subject.
APOE genotyping.
Because of the relevance of APOE polymorphism as a risk factor of AD and for the severity of pathology in AD, each subject was genotyped for the APOE gene. APOE genotyping was conducted on DNA isolated from buccal swabs (archival) or from brain tissues as previously described.25
Statistical analyses.
Analysis of variance across groups was performed for continuous variables: mean age at death, means of final MMSE scores, and brain weight. Fisher exact method was used for the categorical variables: CERAD NP score, Braak-NFT staging score, and educational levels.
An exact Fisher test was used to probe the APOE allelic frequencies across groups. For the statistical analyses of APOE frequencies, we compared 3 groups: 1) subjects with cognitive deficits and AD pathology (MCI+AD; n = 15); 2) subjects with preserved cognition and AD pathology (ASYMAD; n = 10); and 3) age-matched controls (n = 13).
For the analysis of language abilities (i.e., idea density and grammatic complexity), we clustered the subjects into 2 main groups: 1) subjects with cognitive deficits and AD pathology (MCI+AD; n = 6); and 2) subjects without cognitive deficits with and without AD pathology (age-matched controls + ASYMAD; n = 8). A t test was performed between these 2 groups for each variable.
RESULTS
We found a marked hypertrophy of all 3 compartments of CA1 neurons in ASYMAD compared with MCI: cell bodies (+44.9%; p < 0.05), nuclei, (+59.7%; p < 0.01), and nucleoli (+80.2%; p < 0.01). A similar change was present in the CA1 neurons of ASYMAD compared to controls: cell bodies (+30.9%; p < 0.05), nuclei (+36.4%; p < 0.01), and nucleoli (+41.9%; p < 0.05). Moreover, we measured a significant atrophy of cell bodies, nuclei, and nucleoli in AD compared with controls. All morphometric data are presented in figure 3. Mean age at death, educational level attained, and intervals between last cognitive evaluation and death were not significantly different among the groups. Although the average brain weight was lower in the AD group compared to all others, no significant differences among the groups were found. The CERAD NP scores showed a significant difference only between controls and all other groups (p < 0.0001), and did not show differences among all other pairs of compared groups: ASYMAD vs MCI, ASYMAD vs AD, and MCI vs AD groups. Braak-NFT scores showed differences in controls compared to all other groups (p < 0.001), between ASYMAD vs AD (p < 0.001), and between MCI vs AD (p < 0.001). Notably, no significant difference was present between the ASYMAD vs MCI group for Braak-NFT scores.
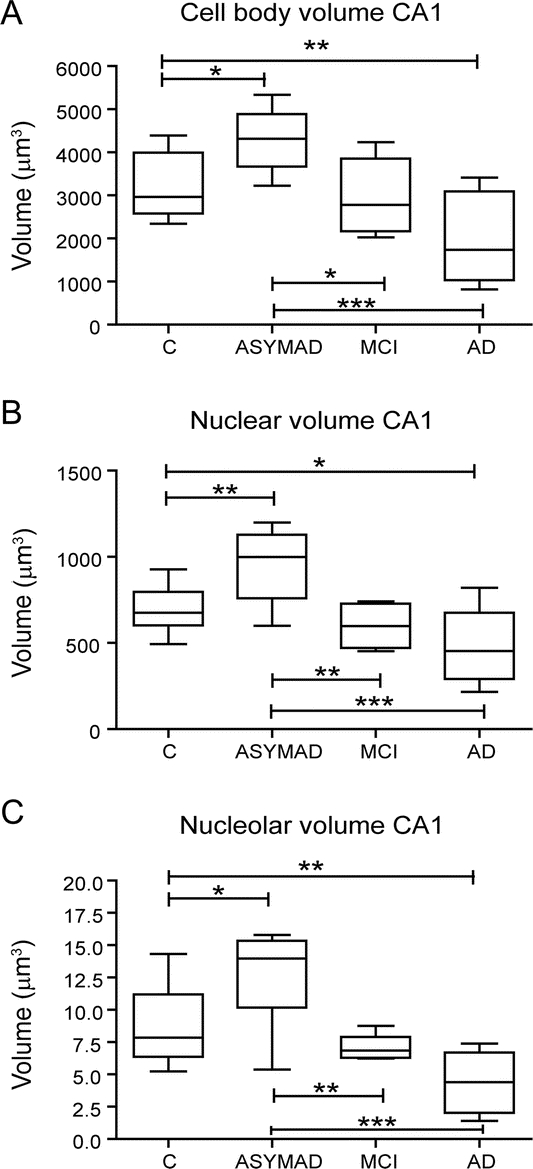
Figure 3 Cell bodies, nuclei, and nucleoli volumes in CA1 neurons of controls, asymptomatic Alzheimer disease (ASYMAD), mild cognitive impairment, and Alzheimer disease
Box plots showing the volumes of the (A) cell bodies, (B) nuclei, and (C) nucleoli of CA1 neurons. Note the marked and significant hypertrophy of cell bodies, nuclei, and nucleoli in ASYMAD compared with other groups. *p < 0.05, **p < 0.01, ***p < 0.001. The bar across the box is the median. The lowest and highest lines at the end of the whiskers correspond to the smallest and the largest sample values.
The mean score of final MMSE was different when comparing controls vs MCI (p < 0.05) and vs AD (p < 0.0001), ASYMAD vs AD (p < 0.0001), and MCI vs AD (p < 0.0001). There were no significant differences in the final MMSE scores of ASYMAD vs controls or ASYMAD vs MCI (table 2). As described in Methods, for the APOE genotypes, we compared ASYMAD subjects vs the combined MCI and AD groups. APOE4 frequency was higher in MCI+AD groups (33%) compared to ASYMAD (5%) (p < 0.001). In contrast, APOE2 frequency was higher in the ASYMAD subjects (30%) compared to the MCI+AD subjects (3.3%) (p < 0.012) (table 2).
The language ability analysis showed a significant higher idea density score in the subjects without cognitive deficits (2 ASYMAD and 6 controls) (score = 6.9) compared to subjects with cognitive deficits (1 MCI and 5 AD) (score = 5.0). By contrast, the mean grammatic complexity score did not show any difference between these 2 groups (figure 4).

Figure 4 Linguistic ability in early life in 2 groups of subjects with an autopsy-confirmed diagnosis 5 decades later
(A) Subjects with intact cognition at death (controls and asymptomatic Alzheimer disease [ASYMAD]) compared with subjects with cognitive deficits (mild cognitive impairment [MCI] and Alzheimer disease) showed a higher idea density mean score. (B) By contrast, a significant difference between the 2 samples was not observed for the grammatic complexity mean score.
DISCUSSION
The major finding of the present study is the significant hypertrophy of cell bodies, nuclei, and nucleoli in CA1 neurons of ASYMAD subjects compared with the MCI and age-matched controls group. These results are similar to those observed in previous studies of ASYMAD subjects from the BLSA cohort. These data support the idea that this neuronal hypertrophy is a general phenomenon, not restricted to participants in a single longitudinal study, and is present in both sexes. In addition, our observations indicate a functional and morphologic plasticity and heterogeneity in response to the AD lesions in the human brain even in the ninth or 10th decade of life. In fact, whereas some subjects develop cognitive impairment (MCI or dementia), others remain relatively unscathed (ASYMAD) in presence of significant and comparable AD pathology. This neuronal hypertrophy might be related to or even underlie the capacity of the ASYMAD subjects to maintain the cognition and effective daily living activities preserved, despite the presence of substantial AD lesions.
This observation of diverging clinical outcomes in subjects with comparable AD lesions is consistent with the brain reserve hypothesis already described by various investigators.26
From a functional perspective, the synapses are the critical structures in neurons and their circuits. The enlargement of the neuronal cell body is probably a surrogate for the expansion of the dendritic arbor and postsynaptic structures. This concept is supported by our observation of hypertrophy of cortical neurons in the APPsw/PS1 δE9 transgenic mouse27 and the observation of an increased number of synaptic contacts in the same animal model.28 Another possibility is that the hypertrophic neurons are extending or growing new axonal terminals along with their presynaptic structures. It is plausible that the larger neuronal somata in ASYMAD reflect adaptive changes of neurons and their circuits to compensate for the damage inflicted by neurotoxic effects of Aβ and tau. It is then attractive to postulate that in ASYMAD, the enlargement of nuclei and nucleoli is the expression of enhanced DNA and RNA syntheses necessary to sustain the repair of injured neurons, and their processes and synapses. This latter notion is further supported by 2 recent studies. One study showed that in the frontal cortex of patients with MCI, there is a paradoxical upregulation of presynaptic boutons.29 The other study reported that in the frontal cortex of old-older normal controls with AD pathology, equivalent to our ASYMAD group, synaptophysin, a presynaptic marker, is enhanced.30
An alternative explanation, based on functional neuroimaging studies,31,32 could be that in ASYMAD, some neurons and circuits are irreversibly damaged by AD pathology, and different and compensatory circuits become operative based on different stages of disease. Consequently, the circuitry of the cerebral cortex may remain functional despite the presence of AD pathology.
At the cellular level, there is a positive linear correlation among the size of the nucleolus, nucleus, and cell body in neurons.33 The nucleolar volume appears as a sensitive indicator of the transcriptional and metabolic activities. Our analyses show that the nucleolus was the compartment with the highest percent of increase in volume. Since the nucleolus is a key organelle for the synthesis, assembly, and production of ribosomes, the nucleolar hypertrophy may reflect enhanced transcriptional and biosynthetic activities. Although the molecular mechanisms underlying the observed hypertrophy of neuronal cell bodies, nuclei, and nucleoli in ASYMAD are beyond the scope of this study, we can formulate some possible explanations drawing from previous studies in animals. Studies in transgenic models have shown that the cell body sizes of neurons, their nuclei and nucleoli are plastic structures and could be influenced by overexpression of the APP gene. Furthermore, neuronal size can also be influenced by exposure to sexual hormones,34 regeneration after axonotomy,35 or brain trauma,36 as well as by learning and enriched environmental experiences.37 One of the main determinants of the cell size is the cell growth, which is modulated by growth factors, i.e., BDNF,38 and by genes and products of the TOR pathway.39 These genes and proteins appear as attractive targets for future studies of ASYMAD.
In terms of the analysis of linguistic ability in this study, it is important to remark that the linguistic scores were available in only 93 out of 678 sisters enrolled in the Nun Study. This explains the availability of these data in only 14 subjects in this study. To circumvent this limitation, we opted to compare the linguistic scores between subjects with or without cognitive deficits. Despite the small number of subjects available, a significant association between higher idea density scores and the absence of cognitive deficits was observed. Although it would have been ideal to examine the linguistic scores in a group composed solely of ASYMAD subjects, this was not possible since only 2 of the ASYMAD subjects had linguistic scores available. Independently of these limitations, it remains a fascinating observation that an intellectual ability measured in the early 20s can predict the likelihood of remaining cognitively normal 5 or 6 decades later, even in the presence of substantial AD pathology. We are aware of the very small size of our samples and the need for a follow-up investigation including larger number of subjects.
It is particularly important to keep in mind that the 4 groups analyzed in this study were clustered based on their clinical states and the severity of NP and NFT. These 2 elements represent insoluble protein aggregates in the brain. We cannot rule out the possibility that although ASYMAD and MCI have comparable NP and NFT scores, they may have different levels of soluble toxin proteins, i.e., Aβ oligomers.
The observation of the 30% frequency of the APOE2 allele in ASYMAD, significantly higher than the MCI and AD group, was unexpected and surprising for its magnitude. Previous studies have shown that the APOE2 allele protects against the development of AD.40 Although the difference in the frequency of APOE2 in ASYMAD was highly significant (p < 0.012) compared to the combined MCI+AD groups, the interpretation of this difference should be tempered by the small sample size. Nevertheless, the difference suggests that the APOE2 allele has the potential to protect the brain from the neurotoxic effects of Aβ and tau, and may be associated with the neuronal hypertrophy. A final caveat is whether individuals with APOE2 alleles have inherently larger neurons. To answer this question, an analysis of a very large sample of old and young control subjects beyond the scope of this study would be required.
AUTHOR CONTRIBUTIONS
Statistical analysis was conducted by Dr. P. Zandi, Department of Mental Health, Bloomberg School of Public Health, Johns Hopkins University, Baltimore, MD.
ACKNOWLEDGMENT
The authors thank Dr. David Snowdon, founder and first director of the Nun Study, for support and collaboration; Dr. Mark Desrosiers for data management; Karen Wall and Paula Thomason for manuscript preparation; Ela Patel and Dianna Tudor for technical support; and the School Sisters of Notre Dame congregation for their participation, assistance, and gift to human health.
Address correspondence and reprint requests to Dr. Juan C. Troncoso, Division of Neuropathology, Department of Pathology, Johns Hopkins University, School of Medicine, Ross Building 558, 720 Rutland Avenue, Baltimore, MD 21205 troncoso@jhmi.edu
Editorial, page 656
e-Pub ahead of print on July 8, 2009, at www.neurology.org.
Supported by the Johns Hopkins University Alzheimer’s Disease Research Center (NIH grant P50AG05146), the Nun Study (NIA grants: R01AG09862, K04AG00553), the University of Kentucky Alzheimer’s Disease Center (NIH grant AG028383), the Abercrombie Foundation, and the Kleberg Foundation.
Disclosure: The authors report no disclosures.
Received November 25, 2008. Accepted in final form May 11, 2009.
REFERENCES
- 1.Petersen RC. Mild cognitive impairment as a diagnostic entity. J Intern Med 2004;256:183–194. [DOI] [PubMed] [Google Scholar]
- 2.Tomlinson BE, Blessed G, Roth M. Observations on the brains of non-demented old people. J Neurol Sci 1968;7:331–356. [DOI] [PubMed] [Google Scholar]
- 3.Katzman R, Terry R, DeTeresa R, et al. Clinical, pathological, and neurochemical changes in dementia: a subgroup with preserved mental status and numerous neocortical plaques. Ann Neurol 1988;23:138–144. [DOI] [PubMed] [Google Scholar]
- 4.Lue LF, Brachova L, Civin WH, Rogers J. Inflammation, A beta deposition, and neurofibrillary tangle formation as correlates of Alzheimer’s disease neurodegeneration. J Neuropathol Exp Neurol 1996;55:1083–1088. [PubMed] [Google Scholar]
- 5.Price JL, Morris JC. Tangles and plaques in nondemented aging and “preclinical” Alzheimer’s disease. Ann Neurol 1999;45:358–368. [DOI] [PubMed] [Google Scholar]
- 6.Riudavets MA, Iacono D, Resnick SM, et al. Resistance to Alzheimer’s pathology is associated with nuclear hypertrophy in neurons. Neurobiol Aging 2007;28:1484–1492. [DOI] [PMC free article] [PubMed] [Google Scholar]
- 7.Iacono D, O’Brien R, Resnick SM, et al. Neuronal hypertrophy in asymptomatic Alzheimer disease. J Neuropathol Exp Neurol 2008;67:578–589. [DOI] [PMC free article] [PubMed] [Google Scholar]
- 8.Mirra SS, Heyman A, McKeel D, et al. The Consortium to Establish a Registry for Alzheimer’s Disease (CERAD), part II: standardization of the neuropathologic assessment of Alzheimer’s disease. Neurology 1991;41:479–486. [DOI] [PubMed] [Google Scholar]
- 9.Braak H, Braak E. Neuropathological stageing of Alzheimer-related changes. Acta Neuropathol (Berl) 1991;82:239–259. [DOI] [PubMed] [Google Scholar]
- 10.Hulette CM, Welsh-Bohmer KA, Murray MG, Saunders AM, Mash DC, McIntyre LM. Neuropathological and neuropsychological changes in “normal” aging: evidence for preclinical Alzheimer disease in cognitively normal individuals. J Neuropathol Exp Neurol 1998;57:1168–1174. [DOI] [PubMed] [Google Scholar]
- 11.Shock NW, Greulich RC, Costa PT, et al. Normal Human Aging: The Baltimore Longitudinal Study of Aging. Washington, DC: US Government Printing Office; 1984. NIH Publication No. 84-2450.
- 12.West MJ, Kawas CH, Martin LJ, Troncoso JC. The CA1 region of the human hippocampus is a hot spot in Alzheimer’s disease. Ann NY Acad Sci 2000;908:255–259. [DOI] [PubMed] [Google Scholar]
- 13.Scheff SW, Price DA, Schmitt FA, DeKosky ST, Mufson EJ. Synaptic alterations in CA1 in mild Alzheimer disease and mild cognitive impairment. Neurology 2007;68:1501–1508. [DOI] [PubMed] [Google Scholar]
- 14.Snowdon DA, Kemper SJ, Mortimer JA, Greiner LH, Wekstein DR, Marksebery WR. Linguistic ability in early life and cognitive function and Alzheimer’s disease in late life: findings from the Nun Study. JAMA 1996;275:528–532. [PubMed] [Google Scholar]
- 15.Tyas SL, Salazar JC, Snowdon DA, et al. Transitions to mild cognitive impairments, dementia, and death: findings from the Nun Study. Am J Epidemiol 2007;165:1231–1238. [DOI] [PMC free article] [PubMed] [Google Scholar]
- 16.Morris JC, Heyman A, Mohs RC, et al. The consortium to establish a registry for Alzheimer’s disease (CERAD), part I: clinical and neuropsychological assessment of Alzheimer’s disease. Neurology 1989;39:1159–1165. [DOI] [PubMed] [Google Scholar]
- 17.Welsh KA, Butters N, Mohs RC, et al. The consortium to establish a registry for Alzheimer’s disease (CERAD), part V: a normative study of the neuropsychological battery. Neurology 1994;44:609–614. [DOI] [PubMed] [Google Scholar]
- 18.Folstein MF, Folstein SE, McHugh PR. “Mini-mental state”: a practical method for grading the cognitive state of patients for the clinician. J Psychiatr Res 1975;12:189–198. [DOI] [PubMed] [Google Scholar]
- 19.Kuriansky J, Gurland BJ, Barry J. The performance test of activities of daily living. Int J Aging Hum Dev 1976;7:343–352. [DOI] [PubMed] [Google Scholar]
- 20.Rosenberg S, Abbeduto L. Indicators of linguistic competence in the peer group conversational behavior of mildly retarded adults. Appl Psycholinguist 1987;8:19–32. [Google Scholar]
- 21.Yamamoto T, Hirano A. A comparative study of modified Bielschowsky, Bodian and Thioflavin S stains on Alzheimer’s neurofibrillary tangles. Neuropathol Appl Neurobiol 1986;12:3–9. [DOI] [PubMed] [Google Scholar]
- 22.MicroBrightField Stereoinvestigator System [computer program]. Version 7. Williston, VT: MicroBrightField Inc. (MBFBioscience); 2007. [Google Scholar]
- 23.Lorente De No’ R. Studies on the structures of the cerebral cortex: I: the area entorhinalis. J Psychol Neurol 1933;45:381–438. [Google Scholar]
- 24.Moller A, Strange P, Gundersen HJ. Efficient estimation of cell volume and number using the nucleator and the disector. J Microsc 1990;159:61–71. [DOI] [PubMed] [Google Scholar]
- 25.Hixson JE, Vernier DT. Restriction isotyping of human apolipoprotein E by gene amplification and cleavage with HhaI. J Lipid Res 1990;31:545–548. [PubMed] [Google Scholar]
- 26.Scarmeas N, Stern Y. Cognitive reserve and lifestyle. J Clin Exp Neuropsychol 2003;25:625–633. [DOI] [PMC free article] [PubMed] [Google Scholar]
- 27.Oh ES, Savonenko AV, King JF, et al. Amyloid precursor protein increases cortical neuron size in transgenic mice. Neurobiol Aging Epub 2008 Feb 25. [DOI] [PMC free article] [PubMed]
- 28.West MJ, Bach G, Soderman A, Jensen JL. Synaptic contact number and size in stratum radiatum CA1 of APP/PS1DeltaE9 transgenic mice. Neurobiol Aging Epub 2008 Mar 11. [DOI] [PubMed]
- 29.Bell KF, Bennett DA, Cuello AC. Paradoxical upregulation of glutamatergic presynaptic boutons during mild cognitive impairment. J Neurosci 2007;27:10810–10817. [DOI] [PMC free article] [PubMed] [Google Scholar]
- 30.Head E, Corrada MM, Kahle-Wrobleski K, et al. Synaptic proteins, neuropathology and cognitive status in the oldest-old. Neurobiol Aging 2009;30:1125–1134. [DOI] [PMC free article] [PubMed] [Google Scholar]
- 31.Woodard JL, Grafton ST, Votaw JR, et al. Compensatory recruitment of neural resources during overt rehearsal of word lists in Alzheimer’s disease. Neuropsychology 1998;12:491–504. [DOI] [PubMed] [Google Scholar]
- 32.Grady CL, McIntosh AR, Beig S, Keightley ML, Burian H, Black SE. Evidence from functional neuroimaging of a compensatory prefrontal network in Alzheimer’s disease. J Neurosci 2003;23:986–993. [DOI] [PMC free article] [PubMed] [Google Scholar]
- 33.Berciano MT, Novell M, Villagra NT, et al. Cajal body number and nucleolar size correlate with the cell body mass in human sensory ganglia neurons. J Struct Biol 2007;158:410–420. [DOI] [PubMed] [Google Scholar]
- 34.Hermel EE, Ilha J, Xavier LL, Rasia-Filho AA, Achaval M. Influence of sex and estrous cycle, but not laterality, on the neuronal somatic volume of the posterodorsal medial amygdala of rats. Neurosci Lett 2006;405:153–158. [DOI] [PubMed] [Google Scholar]
- 35.Vaughan DW. Effects of advancing age on the central response of rat facial neurons to axotomy: Light microscope morphometry. Anat Rec 1990;228:211–219. [DOI] [PubMed] [Google Scholar]
- 36.Farkas O, Povlishock JT. Cellular and subcellular change evoked by diffuse traumatic brain injury: a complex web of change extending far beyond focal damage. Prog Brain Res 2007;161:43–59. [DOI] [PubMed] [Google Scholar]
- 37.Markham JA, Greenough WT. Experience-driven brain plasticity: beyond the synapse. Neuron Glia Biol 2004;1:351–363. [DOI] [PMC free article] [PubMed] [Google Scholar]
- 38.Schindowski K, Belarbi K, Buee L. Neurotrophic factors in Alzheimer’s disease: role of axonal transport. Genes Brain Behav 2008;suppl 1:43–56. [DOI] [PMC free article] [PubMed] [Google Scholar]
- 39.Zhou JN. Roles of autophagy and mTOR signaling in neuronal differentiation of mouse neuroblastoma cells. Cell Signal 2008;20:659–665. [DOI] [PubMed] [Google Scholar]
- 40.Talbot C, Lendon C, Craddock N, Shears S, Morris J, Goate A. Protection against Alzheimer’s disease with APOE epsilon 2. Lancet 1994;343:1432–1433. [DOI] [PubMed] [Google Scholar]