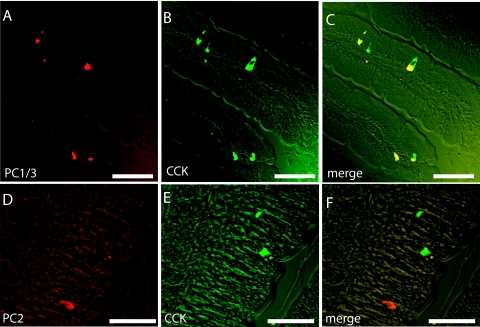
Figure 5.
Immunhistochemical visualization of CCK (green) and PC1/3 (red) (A–C) in I cells of the mouse small intestine. Note the complete colocalization of PC1/3 and CCK in these cells (A–C). In contrast, CCK (green) and PC2 were found in different cells of the of the small intestine (D–F). Scale bars, 50 μm (A-C); 25 μm (D–F).

