Findings suggest that a combination of functional and anatomic in vivo imaging can be used for serial assessment of SSTR2-based reporter gene expression in tumors after in vivo gene transfer.
Abstract
Purpose:
To assess whether a combination of in vivo anatomic and functional imaging can help quantify expression of somatostatin receptor type 2 (SSTR2)–based reporters after in vivo gene transfer.
Materials and Methods:
All animal experiments were approved by an institutional animal care and use committee. Six nude mice bearing two subcutaneous L3.6pl (human pancreatic cancer) tumors were injected intratumorally with an adenovirus containing a human somatostatin receptor type 2 gene chimera (Ad-HA-SSTR2) or a control adenovirus containing green fluorescent protein (Ad-GFP). Two days later, magnetic resonance (MR) imaging was performed to derive tumor weight and analyze morphology. Intravenous injection of Food and Drug Administration–approved indium 111 octreotide was followed by gamma camera imaging (planar imaging and single photon emission computed tomography [SPECT]) the next day. Region-of-interest analysis followed. The procedure was also performed in six nude mice with slow-growing MDA-MB-435 (human breast carcinoma) tumors, which allowed serial imaging 3 days and 2 weeks after adenovirus injection. After imaging, excised tumor weight and biodistribution were assessed. Statistical analyses included a Student t test and linear regression.
Results:
With both tumor types, ex vivo and image-based in vivo biodistribution demonstrated greater uptake (percentage of injected dose per gram) in tumors infected with Ad-HA-SSTR2 than in those infected with Ad-GFP (P < .05). Furthermore, in vivo and ex vivo biodistribution analysis correlated (ex vivo vs planar and MR imaging: r = 0.87, P < .05, n = 24; ex vivo vs SPECT and MR imaging: r = 0.84, P < .05, n = 24). Moreover, in vivo biodistribution distinguished greater expression at the earlier time point in MDA-MB-435 tumors infected with Ad-HA-SSTR2 from waning expression at the later time point (P < .05).
Conclusion:
A combination of in vivo functional and anatomic imaging methods can help quantify gene expression after in vivo gene transfer.
Supplemental material: http://radiology.rsnajnls.org/cgi/content/full/2531081825/DC1
Clinically applicable, noninvasive methods are needed for the quantification of gene expression after in vivo gene transfer. Like drug therapy, gene expression tends to increase, plateau, and often wane. The time course for such change can vary, and thereby, will affect the degree and duration of efficacy. Direct methods for the assessment of expression of the gene of interest have relied primarily on biopsy, which can introduce sampling error and is often performed only once in one location due to patient acceptance and risk. Noninvasive imaging has the potential to allow whole-body, serial evaluation of gene expression by using reporter technology. The reporter may be used alone or may be linked to a gene of interest, such as a therapeutic gene.
To capitalize on the sensitivity of nuclear medicine techniques, reporter gene expression is most often evaluated by using radiopharmaceuticals that either bind to or are substrates for the expressed protein. Reporter genes often encode enzymes, transporters, or receptors (1–5). Although a small number of systems have been designed, most do not use radiopharmaceuticals that are Food and Drug Administration approved for clinical use. Indium 111 (111In) octreotide is currently utilized in humans to detect tumors (eg, rare neuroendocrine tumors) that express the somatostatin receptor type 2 gene (6). Previously, we demonstrated imaging of a human somatostatin receptor type 2 (HA-SSTR2) gene chimera, whose epitope tag affords immunologic techniques that markedly decrease the expense of analysis and whose receptor portion is amenable to imaging in vivo. Expression in vitro assessed by using an antibody to the epitope tag correlates with biodistribution of 111In-octreotide evaluated in excised tumors (7).
Radiopharmaceuticals that localize reporters are commonly imaged by using positron emission tomography (PET) or gamma camera imaging. The latter may be used for either planar or tomographic (single photon emission computed tomography [SPECT]) imaging. The functional image produced with a nuclear medicine camera is based on radiopharmaceutical decay, not on underlying anatomy. In addition, nuclear medicine cameras have poorer resolution than anatomic methods such as computed tomography (CT) and magnetic resonance (MR) imaging; therefore, the images are more prone to volume-averaging artifacts that occur when the object of interest is less than 2.7 times the resolution of the imaging system (8).
Anatomic definition is often critical, particularly for cancer. Tumors can dramatically change in size and morphology both with and without therapy. To control for such variability, expression is usually normalized to protein content or cell number in vitro or to tumor weight ex vivo. Anatomic imaging may be used to obtain such information in vivo (9–12). For small-animal imaging models, MR imaging currently provides superb soft-tissue contrast at submillimeter spatial resolution compared with subcentimeter spatial resolution for PET or gamma camera imaging.
Gene therapy most frequently employs in vivo delivery, and among vectors, adenovirus is most commonly used. Because gene expression and tumor size can change after in vivo gene transfer, noninvasive methods of normalizing gene expression to tumor size are needed. The purpose of this study was to assess whether a combination of in vivo anatomic and functional imaging can help quantify expression of SSTR2-based reporters after in vivo gene transfer.
Materials and Methods
Cell Lines
Human pancreatic cancer cells, L3.6pl (a gift from Dr Lee Ellis), were grown in Eagle minimum essential medium supplemented with 10% fetal bovine serum, 2 mmol/L glutamine, and 1× streptomycin and penicillin. Human breast cancer cells, MDA-MB-435 (American Type Culture Collection, Rockville, Md), were maintained in Eagle minimum essential medium supplemented with 5% fetal bovine serum, 110 mg/L sodium pyruvate, 2 mmol/L glutamine, 1× streptomycin and penicillin, and 2× vitamin solution (GIBCO, Carlsbad, Calif). All cells were cultured at 37°C with 5% CO2.
Construction of Ad-CMV-HA-SSTR2 and in Vitro Analysis of Expression
Briefly, cytomegalovirus promoter-immunoglobulin κ-HA-hSTR2, obtained by polymerase chain reaction from the HA-SSTR2 plasmid (pDisplay; Invitrogen, Carlsbad, Calif) (7), was used to create an adenovirus by employing a commercial system (pAdEasy; QBiogene, Carlsbad, Calif). The control adenovirus contained a cytomegalovirus promoter and green fluorescent protein. Expression was detected in vitro by using immunofluorescence, enzyme-linked immunosorbent assay, and Western blotting (7,9). See Appendix E1 (http://radiology.rsnajnls.org/cgi/content/full/2531081825/DC1) for details.
Biodistribution and Imaging
All animal experiments were approved by the institutional animal care and use committee. Animal numbers were based on previous imaging data and on a power calculation to provide a power of 0.96 with a two-sided α of .05 for separating a twofold difference in biodistribution. Six nude mice were injected subcutaneously with 2.3 × 10⁶ L3.6pl cells in both shoulders. Six days later, one tumor was injected with 1 × 10⁹ plaque-forming units of adenovirus containing human somatostatin receptor type 2 gene chimera (Ad-HA-SSTR2), and the other tumor was injected with 1 × 10⁹ plaque-forming units of adenovirus containing green fluorescent protein (Ad-GFP). Two days later, MR imaging was performed. The same day, the animals were injected in the tail vein with 11 MBq (300 μCi) of 111In-octreotide (Mallinckrodt, St Louis, Mo). Planar and SPECT imaging were performed the next day.
For the time course experiment, six nude mice were injected with 1 × 10⁵ MDA-MB-435 cells subcutaneously at two sites. Twelve weeks later, one tumor was injected with 1 × 10¹⁰ plaque-forming units of Ad-HA-SSTR2, and the other tumor was injected with 1 × 10¹⁰ plaque-forming units of Ad-GFP. Two days later, MR imaging was performed. The same day, the animals were injected in the tail vein with 11 MBq (300 μCi) of 111In-octreotide. Planar and SPECT imaging were performed the next day. Two weeks later, MR imaging was repeated, and on the same day, the animals were injected in the tail vein with 11 MBq (300 μCi) of 111In-octreotide. Planar and SPECT imaging were performed the next day.
MR imaging and gamma camera imaging and image analyses were as described previously (9). See Appendix E1 (http://radiology.rsnajnls.org/cgi/content/full/2531081825/DC1) for details.
Afterward, the mice were sacrificed, and organs and tumors were dissected and weighed; associated radioactivity was determined with a gamma counter. The correlation of the ex vivo and image-based in vivo analysis of biodistribution of 111In-octreotide after in vivo adenoviral infection of L3.6pl tumors at the single time point and MDA-MB-435 tumors at the second time point was assessed by an investigator (V.K., with 7 years of experience in these methods).
Statistical Analysis
Groups were compared by using Student t tests. Linear regression was used to analyze the correlations in the data. Analyses were performed by using spreadsheet software (Excel, 2000; Microsoft, Redmond, Wash). In all analyses, a P value less than .05 was considered to indicate a significant difference.
Results
Cells Infected with Ad-HA-SSTR2 Express HA-SSTR2
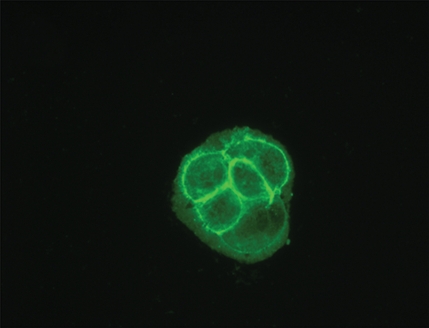
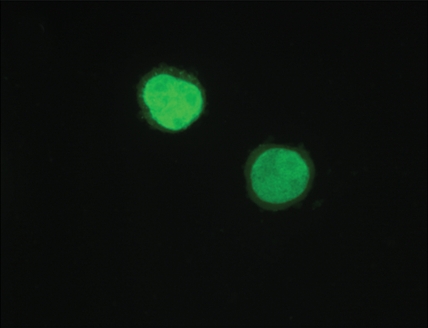
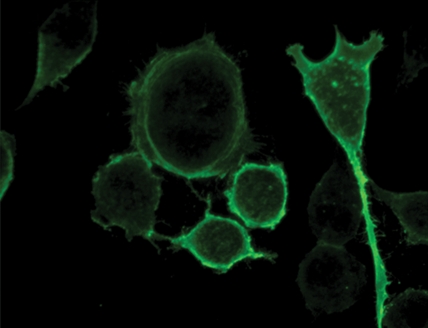
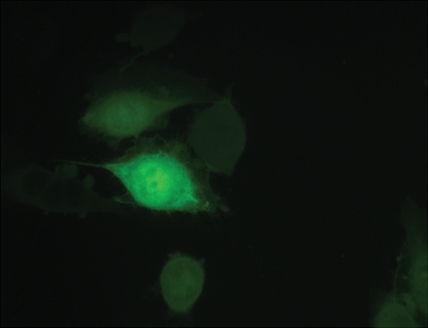
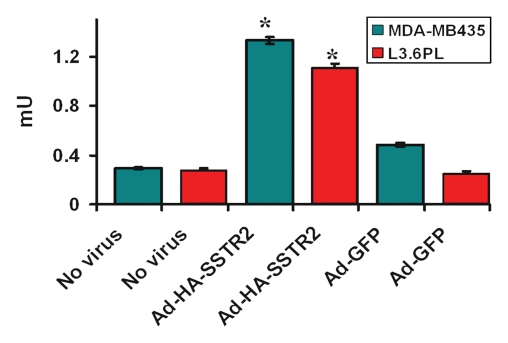
Immunofluorescence and quantitative enzyme-linked immunosorbent assay targeting the hemagglutinin A epitope tag were performed after adenovirus infection (Fig 1). After infection of L3.6pl or MDA-MB-435 cells with Ad-HA-SSTR2, expression was seen along the cell membrane, as expected. Cytoplasmic expression was seen after infection with Ad-GFP. Quantitative enzyme-linked immunosorbent assay results (Fig 1e) confirmed that MDA-MB-435 or L3.6pl cells infected with Ad-HA-SSTR2 express HA-SSTR2; in comparison, uninfected or Ad-GFP–infected cells resulted in only background signal (P < .001).
Figure 1a:
(a–d) Immunofluorescence and enzyme-linked immunosorbent assay in cells infected with Ad-HA-SSTR2. Immunofluorescence targeting the hemagglutinin A domain demonstrates cell membrane localization of the fusion protein in (a) L3.6pl and (c) MDA-MB-435 cells after infection with Ad-HA-SSTR2. Cells infected with Ad-GFP show diffuse fluorescence in the cytoplasm in (b) L3.6pl and (d) MDA-MB-435 cells. (e) Graph shows enzyme-linked immunosorbent assay targeting the hemagglutinin A domain before and after infection with Ad-HA-SSTR2 or Ad-GFP. Expression was seen in both cell types infected with Ad-HA-SSTR2. * = P < .001, n = 3, ttest comparing Ad-HA-SSTR2 and Ad-GFP by cell line. mU = milliunits. Error bars = standard deviation.
Figure 1b:
(a–d) Immunofluorescence and enzyme-linked immunosorbent assay in cells infected with Ad-HA-SSTR2. Immunofluorescence targeting the hemagglutinin A domain demonstrates cell membrane localization of the fusion protein in (a) L3.6pl and (c) MDA-MB-435 cells after infection with Ad-HA-SSTR2. Cells infected with Ad-GFP show diffuse fluorescence in the cytoplasm in (b) L3.6pl and (d) MDA-MB-435 cells. (e) Graph shows enzyme-linked immunosorbent assay targeting the hemagglutinin A domain before and after infection with Ad-HA-SSTR2 or Ad-GFP. Expression was seen in both cell types infected with Ad-HA-SSTR2. * = P < .001, n = 3, ttest comparing Ad-HA-SSTR2 and Ad-GFP by cell line. mU = milliunits. Error bars = standard deviation.
Figure 1c:
(a–d) Immunofluorescence and enzyme-linked immunosorbent assay in cells infected with Ad-HA-SSTR2. Immunofluorescence targeting the hemagglutinin A domain demonstrates cell membrane localization of the fusion protein in (a) L3.6pl and (c) MDA-MB-435 cells after infection with Ad-HA-SSTR2. Cells infected with Ad-GFP show diffuse fluorescence in the cytoplasm in (b) L3.6pl and (d) MDA-MB-435 cells. (e) Graph shows enzyme-linked immunosorbent assay targeting the hemagglutinin A domain before and after infection with Ad-HA-SSTR2 or Ad-GFP. Expression was seen in both cell types infected with Ad-HA-SSTR2. * = P < .001, n = 3, ttest comparing Ad-HA-SSTR2 and Ad-GFP by cell line. mU = milliunits. Error bars = standard deviation.
Figure 1d:
(a–d) Immunofluorescence and enzyme-linked immunosorbent assay in cells infected with Ad-HA-SSTR2. Immunofluorescence targeting the hemagglutinin A domain demonstrates cell membrane localization of the fusion protein in (a) L3.6pl and (c) MDA-MB-435 cells after infection with Ad-HA-SSTR2. Cells infected with Ad-GFP show diffuse fluorescence in the cytoplasm in (b) L3.6pl and (d) MDA-MB-435 cells. (e) Graph shows enzyme-linked immunosorbent assay targeting the hemagglutinin A domain before and after infection with Ad-HA-SSTR2 or Ad-GFP. Expression was seen in both cell types infected with Ad-HA-SSTR2. * = P < .001, n = 3, ttest comparing Ad-HA-SSTR2 and Ad-GFP by cell line. mU = milliunits. Error bars = standard deviation.
Figure 1e:
(a–d) Immunofluorescence and enzyme-linked immunosorbent assay in cells infected with Ad-HA-SSTR2. Immunofluorescence targeting the hemagglutinin A domain demonstrates cell membrane localization of the fusion protein in (a) L3.6pl and (c) MDA-MB-435 cells after infection with Ad-HA-SSTR2. Cells infected with Ad-GFP show diffuse fluorescence in the cytoplasm in (b) L3.6pl and (d) MDA-MB-435 cells. (e) Graph shows enzyme-linked immunosorbent assay targeting the hemagglutinin A domain before and after infection with Ad-HA-SSTR2 or Ad-GFP. Expression was seen in both cell types infected with Ad-HA-SSTR2. * = P < .001, n = 3, ttest comparing Ad-HA-SSTR2 and Ad-GFP by cell line. mU = milliunits. Error bars = standard deviation.
In Vivo Assessment of HA-SSTR2 Expression in L3.6pl Tumors after in Vivo Gene Transfer
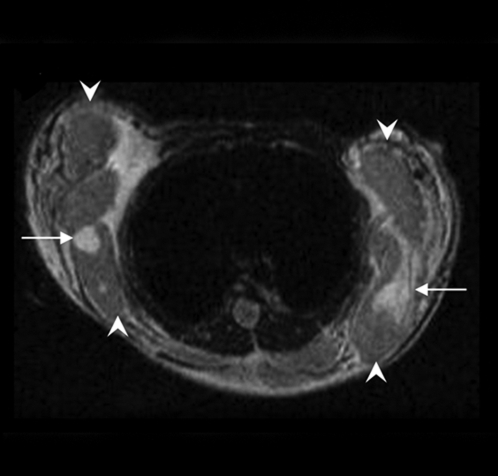
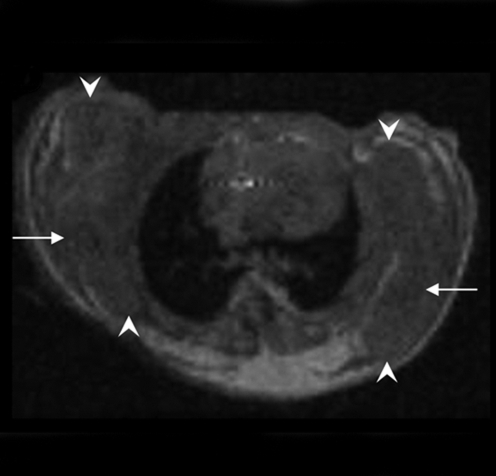
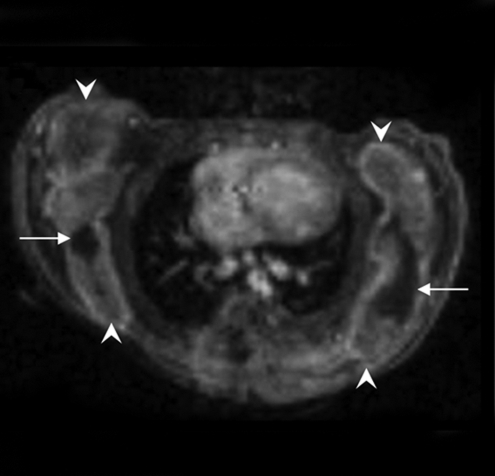
Planar imaging results demonstrated increased uptake of 111In-octreotide in L3.6pl tumors injected with Ad-HA-SSTR2 but not in those injected with the control virus (Fig 2). The normal route of excretion for 111In-octreotide is primarily through the kidneys, with a secondary route through the hepatobiliary system; and, such a pattern was seen. MR imaging results clearly demonstrated the L3.6pl tumors (Fig 2). Some of these rapidly growing tumors demonstrated areas of hemorrhage and/or necrosis, which do not contribute to the functional signal that requires viable cells to express the transgene.
Figure 2a:
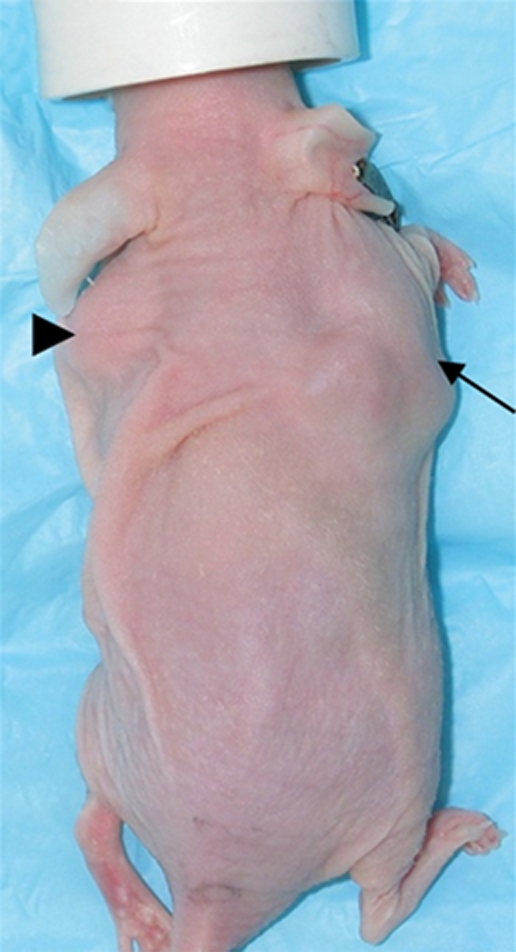
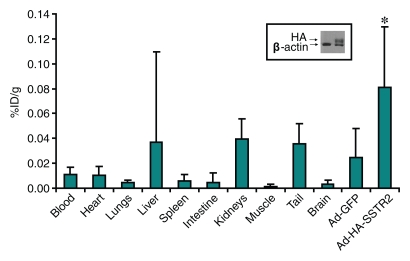
Imaging and ex vivo biodistribution data in L3.6pl tumors. Representative (a) white light and (b) gamma camera images of L3.6pl-bearing mice infected in vivo with Ad-HA-SSTR2. Left tumor was injected with Ad-GFP (arrowhead); right tumor was injected with Ad-HA-SSTR2 (arrow). Two days later, intravenous injection of 111In-octreotide followed. The next day, (a) white light and (b) gamma camera imaging were performed. Increased uptake was seen in tumors infected with Ad-HA-SSTR2 (arrow) on planar image. K = kidneys, N = nose. (c–e) MR images in mice bearing subcutaneous L3.6pl tumors. Axial (c) T2-weighted, (d) T1-weighted, and (e) contrast material–enhanced T1-weighted images at the level of the thorax show subcutaneous tumors (arrowheads). Areas of hemorrhage and/or necrosis (arrows) that cannot contribute to gene expression are seen as areas of increased signal intensity within the tumor (c) on T2-weighted image and as areas without enhancement (e) on contrast-enhanced T1-weighted image. (f) Graph shows ex vivo biodistribution of 111In-octreotide in mice bearing subcutaneous L3.6pl tumors injected in vivo with Ad-HA-SSTR2 or control virus. After gamma camera imaging, tumors were excised for ex vivo biodistribution analysis. Increased uptake was seen in tumors infected with Ad-HA-SSTR2. Inset: Western blot results in tumors with anti-hemagglutinin A antibody for the expressed HA-SSTR2 fusion protein and with anti-β-actin antibody for the housekeeping protein β-actin. * = P < .027, n = 6, t test comparing tumors infected with Ad-HA-SSTR2 and those infected with Ad-GFP. %ID/g = percentage of injected dose per gram. Error bars = standard deviation.
Figure 2b:
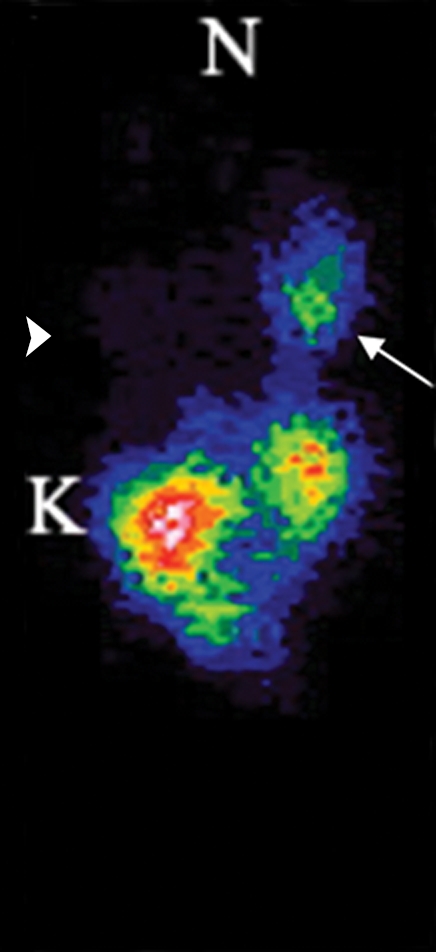
Imaging and ex vivo biodistribution data in L3.6pl tumors. Representative (a) white light and (b) gamma camera images of L3.6pl-bearing mice infected in vivo with Ad-HA-SSTR2. Left tumor was injected with Ad-GFP (arrowhead); right tumor was injected with Ad-HA-SSTR2 (arrow). Two days later, intravenous injection of 111In-octreotide followed. The next day, (a) white light and (b) gamma camera imaging were performed. Increased uptake was seen in tumors infected with Ad-HA-SSTR2 (arrow) on planar image. K = kidneys, N = nose. (c–e) MR images in mice bearing subcutaneous L3.6pl tumors. Axial (c) T2-weighted, (d) T1-weighted, and (e) contrast material–enhanced T1-weighted images at the level of the thorax show subcutaneous tumors (arrowheads). Areas of hemorrhage and/or necrosis (arrows) that cannot contribute to gene expression are seen as areas of increased signal intensity within the tumor (c) on T2-weighted image and as areas without enhancement (e) on contrast-enhanced T1-weighted image. (f) Graph shows ex vivo biodistribution of 111In-octreotide in mice bearing subcutaneous L3.6pl tumors injected in vivo with Ad-HA-SSTR2 or control virus. After gamma camera imaging, tumors were excised for ex vivo biodistribution analysis. Increased uptake was seen in tumors infected with Ad-HA-SSTR2. Inset: Western blot results in tumors with anti-hemagglutinin A antibody for the expressed HA-SSTR2 fusion protein and with anti-β-actin antibody for the housekeeping protein β-actin. * = P < .027, n = 6, t test comparing tumors infected with Ad-HA-SSTR2 and those infected with Ad-GFP. %ID/g = percentage of injected dose per gram. Error bars = standard deviation.
Figure 2c:
Imaging and ex vivo biodistribution data in L3.6pl tumors. Representative (a) white light and (b) gamma camera images of L3.6pl-bearing mice infected in vivo with Ad-HA-SSTR2. Left tumor was injected with Ad-GFP (arrowhead); right tumor was injected with Ad-HA-SSTR2 (arrow). Two days later, intravenous injection of 111In-octreotide followed. The next day, (a) white light and (b) gamma camera imaging were performed. Increased uptake was seen in tumors infected with Ad-HA-SSTR2 (arrow) on planar image. K = kidneys, N = nose. (c–e) MR images in mice bearing subcutaneous L3.6pl tumors. Axial (c) T2-weighted, (d) T1-weighted, and (e) contrast material–enhanced T1-weighted images at the level of the thorax show subcutaneous tumors (arrowheads). Areas of hemorrhage and/or necrosis (arrows) that cannot contribute to gene expression are seen as areas of increased signal intensity within the tumor (c) on T2-weighted image and as areas without enhancement (e) on contrast-enhanced T1-weighted image. (f) Graph shows ex vivo biodistribution of 111In-octreotide in mice bearing subcutaneous L3.6pl tumors injected in vivo with Ad-HA-SSTR2 or control virus. After gamma camera imaging, tumors were excised for ex vivo biodistribution analysis. Increased uptake was seen in tumors infected with Ad-HA-SSTR2. Inset: Western blot results in tumors with anti-hemagglutinin A antibody for the expressed HA-SSTR2 fusion protein and with anti-β-actin antibody for the housekeeping protein β-actin. * = P < .027, n = 6, t test comparing tumors infected with Ad-HA-SSTR2 and those infected with Ad-GFP. %ID/g = percentage of injected dose per gram. Error bars = standard deviation.
Figure 2d:
Imaging and ex vivo biodistribution data in L3.6pl tumors. Representative (a) white light and (b) gamma camera images of L3.6pl-bearing mice infected in vivo with Ad-HA-SSTR2. Left tumor was injected with Ad-GFP (arrowhead); right tumor was injected with Ad-HA-SSTR2 (arrow). Two days later, intravenous injection of 111In-octreotide followed. The next day, (a) white light and (b) gamma camera imaging were performed. Increased uptake was seen in tumors infected with Ad-HA-SSTR2 (arrow) on planar image. K = kidneys, N = nose. (c–e) MR images in mice bearing subcutaneous L3.6pl tumors. Axial (c) T2-weighted, (d) T1-weighted, and (e) contrast material–enhanced T1-weighted images at the level of the thorax show subcutaneous tumors (arrowheads). Areas of hemorrhage and/or necrosis (arrows) that cannot contribute to gene expression are seen as areas of increased signal intensity within the tumor (c) on T2-weighted image and as areas without enhancement (e) on contrast-enhanced T1-weighted image. (f) Graph shows ex vivo biodistribution of 111In-octreotide in mice bearing subcutaneous L3.6pl tumors injected in vivo with Ad-HA-SSTR2 or control virus. After gamma camera imaging, tumors were excised for ex vivo biodistribution analysis. Increased uptake was seen in tumors infected with Ad-HA-SSTR2. Inset: Western blot results in tumors with anti-hemagglutinin A antibody for the expressed HA-SSTR2 fusion protein and with anti-β-actin antibody for the housekeeping protein β-actin. * = P < .027, n = 6, t test comparing tumors infected with Ad-HA-SSTR2 and those infected with Ad-GFP. %ID/g = percentage of injected dose per gram. Error bars = standard deviation.
Figure 2e:
Imaging and ex vivo biodistribution data in L3.6pl tumors. Representative (a) white light and (b) gamma camera images of L3.6pl-bearing mice infected in vivo with Ad-HA-SSTR2. Left tumor was injected with Ad-GFP (arrowhead); right tumor was injected with Ad-HA-SSTR2 (arrow). Two days later, intravenous injection of 111In-octreotide followed. The next day, (a) white light and (b) gamma camera imaging were performed. Increased uptake was seen in tumors infected with Ad-HA-SSTR2 (arrow) on planar image. K = kidneys, N = nose. (c–e) MR images in mice bearing subcutaneous L3.6pl tumors. Axial (c) T2-weighted, (d) T1-weighted, and (e) contrast material–enhanced T1-weighted images at the level of the thorax show subcutaneous tumors (arrowheads). Areas of hemorrhage and/or necrosis (arrows) that cannot contribute to gene expression are seen as areas of increased signal intensity within the tumor (c) on T2-weighted image and as areas without enhancement (e) on contrast-enhanced T1-weighted image. (f) Graph shows ex vivo biodistribution of 111In-octreotide in mice bearing subcutaneous L3.6pl tumors injected in vivo with Ad-HA-SSTR2 or control virus. After gamma camera imaging, tumors were excised for ex vivo biodistribution analysis. Increased uptake was seen in tumors infected with Ad-HA-SSTR2. Inset: Western blot results in tumors with anti-hemagglutinin A antibody for the expressed HA-SSTR2 fusion protein and with anti-β-actin antibody for the housekeeping protein β-actin. * = P < .027, n = 6, t test comparing tumors infected with Ad-HA-SSTR2 and those infected with Ad-GFP. %ID/g = percentage of injected dose per gram. Error bars = standard deviation.
Figure 2f:
Imaging and ex vivo biodistribution data in L3.6pl tumors. Representative (a) white light and (b) gamma camera images of L3.6pl-bearing mice infected in vivo with Ad-HA-SSTR2. Left tumor was injected with Ad-GFP (arrowhead); right tumor was injected with Ad-HA-SSTR2 (arrow). Two days later, intravenous injection of 111In-octreotide followed. The next day, (a) white light and (b) gamma camera imaging were performed. Increased uptake was seen in tumors infected with Ad-HA-SSTR2 (arrow) on planar image. K = kidneys, N = nose. (c–e) MR images in mice bearing subcutaneous L3.6pl tumors. Axial (c) T2-weighted, (d) T1-weighted, and (e) contrast material–enhanced T1-weighted images at the level of the thorax show subcutaneous tumors (arrowheads). Areas of hemorrhage and/or necrosis (arrows) that cannot contribute to gene expression are seen as areas of increased signal intensity within the tumor (c) on T2-weighted image and as areas without enhancement (e) on contrast-enhanced T1-weighted image. (f) Graph shows ex vivo biodistribution of 111In-octreotide in mice bearing subcutaneous L3.6pl tumors injected in vivo with Ad-HA-SSTR2 or control virus. After gamma camera imaging, tumors were excised for ex vivo biodistribution analysis. Increased uptake was seen in tumors infected with Ad-HA-SSTR2. Inset: Western blot results in tumors with anti-hemagglutinin A antibody for the expressed HA-SSTR2 fusion protein and with anti-β-actin antibody for the housekeeping protein β-actin. * = P < .027, n = 6, t test comparing tumors infected with Ad-HA-SSTR2 and those infected with Ad-GFP. %ID/g = percentage of injected dose per gram. Error bars = standard deviation.
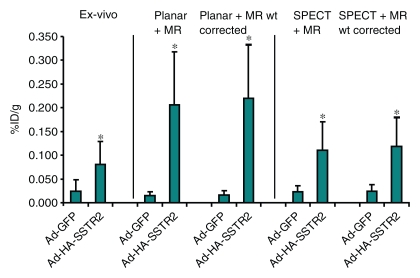
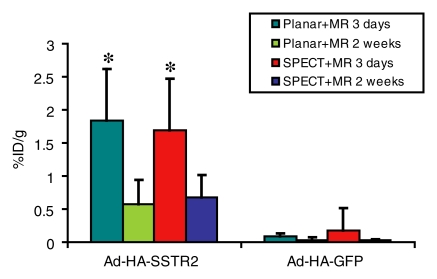
After imaging, the mice were sacrificed for ex vivo biodistribution analysis (Fig 2). Tumors injected with Ad-HA-SSTR2 had significantly greater uptake of 111In-octreotide than tumors injected with the control virus (P = .027, n = 6); HA-SSTR2 expression was confirmed with Western blotting. In vivo biodistribution analysis by using planar and MR imaging or SPECT and MR imaging also demonstrated greater uptake in tumors injected with Ad-HA-SSTR2 than in tumors injected with the control virus (P = .002 and P = .006, respectively; n = 6) (Fig 3). There was no statistically significant difference in in vivo biodistribution in Ad-HA-SSTR2–infected tumors or in control virus–infected tumors assessed with planar and MR imaging or SPECT and MR imaging. Removing areas of necrosis and/or hemorrhage detected by using MR imaging to calculate tumor weight showed a mild trend of increased uptake in tumors injected with Ad-HA-SSTR2, but this was not statistically significant. The proportion of necrosis and/or hemorrhage was small (approximately 10% in each tumor) and was noted in tumors injected with either virus.
Figure 3:
Graph of ex vivo and image-based in vivo analysis of biodistribution of 111In-octreotide into L3.6pl tumors after in vivo adenoviral infection. Biodistribution into tumors as assessed with ex vivo analysis of excised tumors or in vivo analysis by using planar and MR imaging or SPECT and MR imaging is displayed. In vivo biodistribution analysis after subtracting hemorrhagic and/or necrotic areas from MR images (Planar + MR wt corrected) (SPECT + MR wt corrected) is displayed. * = P < .05, n = 6, ttest comparing tumors infected with Ad-HA-SSTR2 with those infected with Ad-GFP for each biodistribution evaluation method (planar and MR imaging, P = .002; SPECT and MR imaging, P = .006; planar and MR imaging weight corrected, P = .001; SPECT and MR imaging weight corrected, P = .004). There was no significant difference in in vivo biodistribution after Ad-HA-SSTR2 infection or control virus infection assessed with planar and MR imaging or SPECT and MR imaging. %ID/g = percentage of injected dose per gram. Error bars = standard deviation.
Longitudinal Evaluation of Expression after in Vivo Gene Transfer
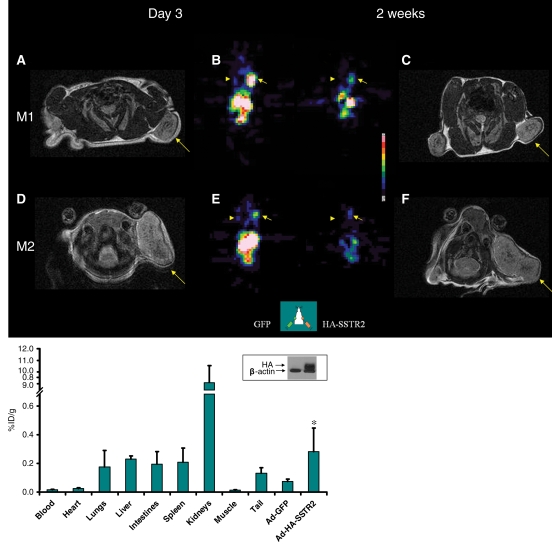
For serial imaging, slow-growing MDA-MB-435 cells were used. Expression wanes approximately 2 weeks after adenovirus infection. MR images (Fig 4) demonstrated that tumors were of various sizes at the first imaging session. At the second imaging session, tumor growth varied; for example, one tumor remained relatively stable in size and another increased in size. There was variability in the amount of 111In-octreotide uptake at the first SPECT imaging time point; for example, greater expression was seen in one mouse than in another mouse. Visually, as expected, expression waned at the second time point in all tumors injected with Ad-HA-SSTR2. No prominent uptake was seen in tumors injected with the control virus. The apparent size of tumors on functional SPECT images did not correspond with the size of tumors on anatomic MR images. Weight derived by using volume assessment on MR images correlated with weight of excised MDA-MB-435 tumors (r = 0.98, P < .001, n = 12, data not shown on Figure 4), as we have demonstrated previously for subcutaneous tumors (9).
Figure 4:
Longitudinal MR and SPECT imaging data in MDA-MB-435 tumor–bearing mice infected in vivo with Ad-HA-SSTR2. A, D, E, and H, Axial T2-weighted MR images and, B, C, F, and G, SPECT images 3 days (A, B, E, and F) and 2 weeks (C, D, G, and H) after adenoviral infection in two representative mice, M1 (A, B, C, and D) and M2 (E, F, G, and H). MR images are focused on the tumor on the left side to demonstrate tumor size. Tumor size does not correspond with size of the object on the SPECT image. There was variability between animals (M1 vs M2) in change in tumor size, stable in M1 (A vs D, arrow) and increased in M2 (E vs H, arrow), and in amount of uptake at first time point (B vs F, arrow) and second time point (C vs G, arrow). Increased uptake was seen in tumors infected with Ad-HA-SSTR2 (B, C, F, and G, arrow) versus those infected with control Ad-GFP virus (B, C, F, and G, arrowhead). Uptake decreased in tumors infected with Ad-HA-SSTR2 in both mice at the later time point (C vs B and G vs F, arrow). Left tumor was injected with Ad-GFP; right tumor was injected with Ad-HA-SSTR2. Two days later, MR imaging and intravenous injection of 111In-octreotide were performed. The next day, gamma camera imaging was performed. Two weeks later, MR imaging and intravenous injection of 111In-octreotide were performed. The next day, gamma camera imaging was performed. I, Graph of ex vivo biodistribution of 111In-octreotide injected in mice bearing subcutaneous MDA-MB-435 tumors injected in vivo with Ad-HA-SSTR2 or control virus. After the second imaging time point (2 weeks after adenovirus injection), tumors were excised for ex vivo biodistribution analysis. Increased uptake was seen in tumors infected with Ad-HA-SSTR2. Inset: Western blot results in tumors with anti-hemagglutinin A antibody for the expressed HA-SSTR2 fusion protein and with anti-β-actin antibody. * = P = .01, n = 6, t test comparing tumors infected with Ad-HA-SSTR2 versus tumors infected with Ad-GFP. %ID/g = percentage of injected dose per gram. Error bars = standard deviation.
Ex vivo biodistribution analysis after the second imaging time point demonstrated greater uptake in MDA-MB-435 tumors injected with Ad-HA-SSTR2 than in tumors injected with the control virus (P = .01, n = 6), and HA-SSTR2 expression was confirmed by Western blotting results. Differences in biodistribution between mice bearing L3.6pl tumors and mice bearing MDA-MB-435 tumors likely relate to in vivo permissibility to adenovirus infection, the amount of HA-SSTR2 expression by cell type, and smaller tumor burden of slow-growing MDA-MB-435 tumors compared with fast-growing L3.6pl tumors. Decreased uptake in all organs was noted on gamma camera images at the later time point in mice bearing MDA-MB-435 tumors (Fig 4), despite delivery of the same dose of radiopharmaceutical; and, this is likely because the tumor expressing HA-SSTR2 acts as a reservoir for the radiopharmaceutical.
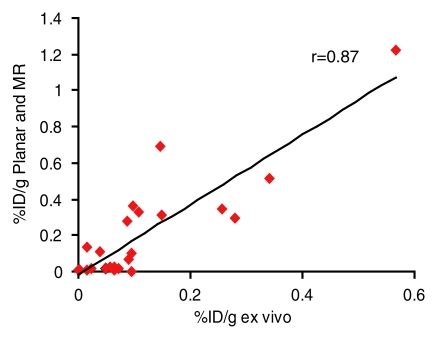
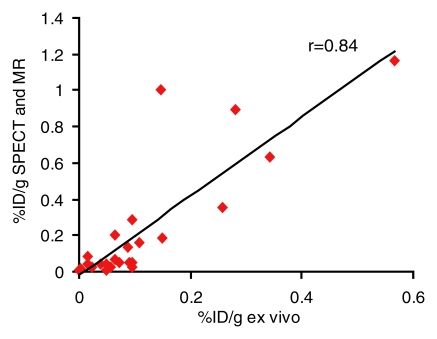
Ex vivo and image-based in vivo assessment of expression by tumors after in vivo gene transfer were correlated. Noninvasive, image-based assessment of biodistribution by using planar and MR imaging (r = 0.87, P < .001, n = 24, coefficient of the x variable = 1.9, and standard error of the x variable = 0.2) or SPECT and MR imaging (r = 0.84, P < .001, n = 24, coefficient of the x variable = 2.2, and standard error of the x variable = 0.3) correlated with biodistribution assessed by using excised MDA-MB-435 and L3.6pl tumors (Fig 5).
Figure 5a:
(a, b) Graphs show correlation of ex vivo and image-based in vivo analysis of biodistribution of 111In-octreotide into MDA-MB-435 and L3.6pl tumors after in vivo adenoviral infection. Percentage of injected dose per gram (%ID/g) of excised tumors correlated with that derived from (a) planar and MR images (r = 0.87, n = 24, P < .001) or (b) SPECT and MR images (r = 0.84, n = 24, P < .001).
Figure 5b:
(a, b) Graphs show correlation of ex vivo and image-based in vivo analysis of biodistribution of 111In-octreotide into MDA-MB-435 and L3.6pl tumors after in vivo adenoviral infection. Percentage of injected dose per gram (%ID/g) of excised tumors correlated with that derived from (a) planar and MR images (r = 0.87, n = 24, P < .001) or (b) SPECT and MR images (r = 0.84, n = 24, P < .001).
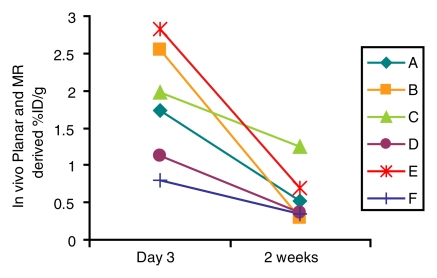
In vivo biodistribution by using planar and MR imaging or SPECT and MR imaging was used to compare uptake at the initial and later imaging time points in the MDA-MB-435 model. With planar and MR imaging or SPECT and MR imaging, uptake by tumors injected with Ad-HA-SSTR2 was greater at the earlier time point and waned at the second time point (P = .01 and P = .004, respectively; n = 6) (Fig 6a). No such difference over time was seen with the control virus, as expected. At both time points, tumors injected with Ad-HA-SSTR2 had greater uptake than tumors injected with the control virus (P = .003 and P = .001 respectively; n = 6) at planar and MR imaging or at SPECT and MR imaging. Thus, as a group, expression of HA-SSTR2 waned 2 weeks after Ad-HA-SSTR2 injection. When evaluating individual tumors injected with Ad-HA-SSTR2 (Fig 6b), there was variance among tumors in the amount of expression at the first or second time point. In addition, there was variance among tumors in the rate of loss of HA-SSTR2 expression, with individual tumors demonstrating more rapid loss and others demonstrating a slower rate of loss of expression. Thus, the rate of change in expression after in vivo gene transfer varied among tumors.
Figure 6a:
Longitudinal in vivo analysis of 111In-octreotide biodistribution in MDA-MB-435 tumors 3 days and 2 weeks after adenoviral infection. (a) Graph shows greater biodistribution at 3 days than at 2 weeks in tumors injected with Ad-HA-SSTR2 at planar and MR imaging or SPECT and MR imaging (P < .01 and P = .004, respectively; n = 6, t test comparing 2 weeks and 3 days for each biodistribution evaluation method). At both time points, greater biodistribution of the radiotracer was noted in tumors injected with Ad-HA-SSTR2 than in tumors injected with control virus at planar and MR imaging or SPECT and MR imaging (P < .003 and P = .001, respectively; n = 6, t test comparing tumors infected with Ad-HA-SSTR2 and those infected with Ad-GFP for each biodistribution evaluation method by time point). (b) Graph of individual tumors injected with Ad-HA-SSTR2 shows variability in amount of initial expression at day 3, rate of decrease in expression (2 weeks vs day 3), and amount of expression at 2-week time point. In all cases, expression wanes at later time point. * = P < .05, Ad-HA-SSTR2 at 3 days versus at 2 weeks. %ID/g = percentage of injected dose per gram. Error bars = standard deviation.
Figure 6b:
Longitudinal in vivo analysis of 111In-octreotide biodistribution in MDA-MB-435 tumors 3 days and 2 weeks after adenoviral infection. (a) Graph shows greater biodistribution at 3 days than at 2 weeks in tumors injected with Ad-HA-SSTR2 at planar and MR imaging or SPECT and MR imaging (P < .01 and P = .004, respectively; n = 6, t test comparing 2 weeks and 3 days for each biodistribution evaluation method). At both time points, greater biodistribution of the radiotracer was noted in tumors injected with Ad-HA-SSTR2 than in tumors injected with control virus at planar and MR imaging or SPECT and MR imaging (P < .003 and P = .001, respectively; n = 6, t test comparing tumors infected with Ad-HA-SSTR2 and those infected with Ad-GFP for each biodistribution evaluation method by time point). (b) Graph of individual tumors injected with Ad-HA-SSTR2 shows variability in amount of initial expression at day 3, rate of decrease in expression (2 weeks vs day 3), and amount of expression at 2-week time point. In all cases, expression wanes at later time point. * = P < .05, Ad-HA-SSTR2 at 3 days versus at 2 weeks. %ID/g = percentage of injected dose per gram. Error bars = standard deviation.
Discussion
In vivo imaging, by using both anatomic and functional methods, can help quantify expression of a SSTR2 gene chimera after in vivo gene transfer. By using a single time point approach and tumors derived from stable cell lines transfected with HA-SSTR2, we have previously demonstrated in vivo quantification of expression (9). In the current study, expression after in vivo gene transfer was measurable with functional and anatomic imaging in two different human tumors; and, change in expression over time was demonstrated. Previous studies (4,13) have described repetitive reporter imaging by using nuclear medicine imaging (such as PET) alone. After in vivo delivery, transgene expression usually increases, plateaus, and then wanes. This cycle differs with the delivery vehicles used and can differ with the same delivery vehicle—for example, depending on the quantity delivered, type of tissue or tumor, alterations to the surface of the vehicle, or specific inserted elements. Among delivery vehicles, adeno-associated virus may require 2–6 weeks for the onset of expression (14); whereas, adenovirus, as we observed, typically only requires a few days. With the latter, expression often decreases after approximately 2–3 weeks (15), consistent with our findings; however, this can vary (16). Multiple temporally separated injections of in vivo gene therapy can improve therapeutic outcome (17). During the course of treatment, the mass may grow or regress.
We noted change in tumor size during longitudinal imaging. Expression normalized to tumor weight could be followed within an individual subject by using imaging alone. Among subjects, there was variability in the amount of normalized expression at the first and second time points and in the rate of change in expression over time.
These findings may be useful in monitoring gene therapy in humans. As with drug therapy, gene therapy will require a threshold of normalized expression to achieve efficacy. Initial imaging in individual patients may be used to determine if the required expression is achieved; and if not, reinjection may be performed immediately. Imaging at a second time point in individual patients may be used to determine if the required expression is maintained, so that reinjection may be delayed until needed; thus, potential toxicity by the therapeutic gene product may be avoided. On the other hand, if expression wanes below the required threshold for therapeutic efficacy, reinjection may be instituted. Thus, variability in expression among patients may be addressed, and variability in expression within individual patients may be addressed for personalizing therapy.
In addition to solitary tumors, normalization of expression is also important in the setting of metastases because of disparity in the size and morphology of each metastasis. To approach multifocal lesions, intravenous delivery of gene therapy has been explored (18). With chemotherapy, it is not uncommon for a patient to have a mixed therapeutic response, which consists of responding and nonresponding tumors. Due to heterogeneity in tumor size and susceptibility to therapy, quantification will require normalization of expression to tumor weight in individual tumors. Fortunately, in the clinic, combination functional and anatomic systems, such as PET/CT and SPECT/CT, are available for measuring normalized expression in a variety of metastases over various locations in the body in one sitting. For small-animal imaging, CT has poor soft-tissue resolution, especially in nude mice, which have small amounts of fat; MR imaging has superior soft-tissue resolution. The feasibility of combined PET and MR imaging systems has recently been described (19–21), including in humans (22).
Delivered alone or in combination with other therapies such as chemotherapy or radiation therapy, the goal of gene therapy in oncology is to kill the tumor. With or without treatment, tumors tend to undergo hemorrhage and/or necrosis, which results in areas that cannot functionally express the gene. Such areas were noted in L3.6pl tumors. After therapy, necrosis and/or hemorrhage may significantly increase and indeed may replace almost the entire tumor volume—for example, after imatinib treatment of gastrointestinal stromal tumors (23). The superior spatial resolution and tissue characterization of anatomic imaging at CT or MR imaging compared with nuclear medicine imaging can be used to eliminate such areas that do not contribute to the functional signal when normalizing expression. Such areas may also be delineated by using traditional intravenous contrast material and/or novel imaging agents (24). In animal studies, this is not possible with traditional tumor measurement methods such as calipers or ex vivo tumor weight that are unable to gauge morphology within the tumor.
Normalization is important for the assessment of promoter activity in vivo. Tumor size may parallel or oppose promoter activity and thus will influence interpretation of increased or decreased activity by a single promoter or when comparing among promoters. Normalizing expression to size can also be important in the assessment of organs whose size may differ among individuals or may change due to age or pathologic condition.
For delivery, direct injection is feasible when there is a solitary or small number of target(s). A limitation of direct injection into a large tumor may be that only part of the tumor receives the gene. Quantification of expression in the entire tumor may then be assessed, or one may anatomically define what portion (such as a quadrant) of the tumor is to be used for normalization. Section-by-section evaluation may be performed to normalize functional signal with anatomic imaging (10). For smaller tumors, delivery is less of an issue after intratumoral injection. Clinically, for a greater number of tumors or large tumors, intravenous or intraarterial gene delivery may be more practical than intratumoral injections. Quantification may be performed as described previously. When comparing in vivo with ex vivo biodistribution, the slope suggests that a correction factor, approximately two in the current study, should be taken into account. In this study, we used a dedicated small-animal camera (mCAM; Siemens Medical Solution, Hoffmann Estates, Ill) that is similar to cameras used in humans. As they are developed, dedicated small-animal gamma cameras achieve higher resolution and will depict smaller amounts of radioactivity than clinically available systems that are at approximately 5-mm resolution with a collimator. Although, in theory, essentially infinite spatial resolution is achievable by using magnification techniques with a gamma camera, in practice, spatial resolution is still in the 1.0–0.5-mm range for small animals, given the cost of increased imaging time. Small-animal MR imaging systems routinely provide less than 0.2-mm resolution, and clinical CT scanners can already achieve submillimeter resolution.
SSTR2-based reporters can be imaged with PET or gamma camera (SPECT or planar) imaging–based methods (7,25,26). The latter can be used with Food and Drug Administration–approved agents that are currently in clinical use, such as 111In-octreotide. Within the armamentarium of SSTR2-based reporters is the potential to use those that do not induce signaling (26). Ideally, a reporter should not interfere with normal cellular function. Avoiding signaling by the reporter should be advantageous in various diseases because reporter-mediated signaling may interfere with normal intracellular signaling or therapy; for example, reporter-mediated signaling may interfere with signaling pathways that are to be exploited by a cointroduced therapeutic gene.
In this study, we used a common gene therapy vector and a SSTR2-based reporter that can be imaged by using Food and Drug Administration–approved radiopharmaceuticals. Findings suggest that a combination of functional and anatomic in vivo imaging can be used for serial assessment of SSTR2-based reporter gene expression in tumors after in vivo gene transfer. This should enable noninvasive assessment of gene expression for applications such as developing and characterizing delivery vehicles, assessing promoter activity, as well as dosing and monitoring gene therapy.
Advances in Knowledge.
A combination of in vivo functional and anatomic imaging can help quantify gene expression after in vivo gene transfer of SSTR2-based reporters.
After in vivo gene delivery, change in gene expression over time can be distinguished by using SSTR2-based reporters in combination with in vivo functional and anatomic imaging.
Supplementary Material
Acknowledgments
We thank Mary Carr, Paula Garcia, and Tiffany Raczy for administrative support and Lea Newland for library support.
Received October 14, 2008; revision requested November 22; revision received January 14, 2009; accepted February 24; final version accepted March 16.
V.K. supported by the Topfer Fund for Pancreatic Cancer Research, U.S. Department of Energy (DE-FG02-03ER63599), and The University of Texas M. D. Anderson Cancer Center Start-up Funds.
Funding: This work was supported by National Institutes of Health grants (P30CA16672 and RCA123841A).
Authors stated no financial relationship to disclose.
Abbreviations:
- Ad-GFP
- adenovirus containing green fluorescent protein gene
- Ad-HA-SSTR2
- adenovirus containing human somatostatin receptor type 2 gene chimera
References
- 1.Tjuvajev JG, Finn R, Watanabe K, et al. Noninvasive imaging of herpes virus thymidine kinase gene transfer and expression: a potential method for monitoring clinical gene therapy. Cancer Res 1996; 56: 4087– 4095 [PubMed] [Google Scholar]
- 2.Zinn KR, Buchsbaum DJ, Chaudhuri TR, et al. Noninvasive monitoring of gene transfer using a reporter receptor imaged with a high-affinity peptide radiolabeled with 99mTc or 188Re. J Nucl Med 2000; 41: 887– 895 [PubMed] [Google Scholar]
- 3.Gambhir SS, Barrio JR, Wu L, et al. Imaging of adenoviral-directed herpes simplex virus type 1 thymidine kinase reporter gene expression in mice with radiolabeled ganciclovir. J Nucl Med 1998; 39: 2003– 2011 [PubMed] [Google Scholar]
- 4.MacLaren DC, Gambhir SS, Satyamurthy N, et al. Repetitive, non-invasive imaging of the dopamine D2 receptor as a reporter gene in living animals. Gene Ther 1999; 6: 785– 791 [DOI] [PubMed] [Google Scholar]
- 5.Groot-Wassink T, Aboagye EO, Glaser M, Lemoine NR, Vassaux G. Adenovirus biodistribution and noninvasive imaging of gene expression in vivo by positron emission tomography using human sodium/iodide symporter as reporter gene. Hum Gene Ther 2002; 13: 1723– 1735 [DOI] [PubMed] [Google Scholar]
- 6.John M, Meyerhof W, Richter D, et al. Positive somatostatin receptor scintigraphy correlates with the presence of somatostatin receptor subtype 2. Gut 1996; 38: 33– 39 [DOI] [PMC free article] [PubMed] [Google Scholar]
- 7.Kundra V, Mannting F, Jones AG, Kassis AI. Noninvasive monitoring of somatostatin receptor type 2 chimeric gene transfer. J Nucl Med 2002; 43: 406– 412 [PubMed] [Google Scholar]
- 8.Kessler RM, Ellis JR, Jr, Eden M. Analysis of emission tomographic scan data: limitations imposed by resolution and background. J Comput Assist Tomogr 1984; 8: 514– 522 [DOI] [PubMed] [Google Scholar]
- 9.Yang D, Han L, Kundra V. Exogenous gene expression in tumors: noninvasive quantification with functional and anatomic imaging in a mouse model. Radiology 2005; 235: 950– 958 [DOI] [PubMed] [Google Scholar]
- 10.Kim TJ, Ravoori M, Landen CN, et al. Antitumor and antivascular effects of AVE8062 in ovarian carcinoma. Cancer Res 2007; 67: 9337– 9345 [DOI] [PubMed] [Google Scholar]
- 11.Bankson JA, Ji L, Ravoori M, Han L, Kundra V. Echo-planar imaging for MRI evaluation of intrathoracic tumors in murine models of lung cancer. J Magn Reson Imaging 2008; 27: 57– 62 [DOI] [PubMed] [Google Scholar]
- 12.Kundra V, Ng CS, Ma J, Bankson JA, et al. In vivo imaging of prostate cancer involving bone in a mouse model. Prostate 2007; 67: 50– 60 [DOI] [PubMed] [Google Scholar]
- 13.Green LA, Yap CS, Nguyen K, et al. Indirect monitoring of endogenous gene expression by positron emission tomography (PET) imaging of reporter gene expression in transgenic mice. Mol Imaging Biol 2002; 4: 71– 81 [DOI] [PubMed] [Google Scholar]
- 14.Flotte TR, Beck SE, Chesnut K, et al. A fluorescence video-endoscopy technique for detection of gene transfer and expression. Gene Ther 1998; 5: 166– 173 [DOI] [PubMed] [Google Scholar]
- 15.Zsengeller ZK, Wert SE, Hull WM, et al. Persistence of replication-deficient adenovirus-mediated gene transfer in lungs of immune-deficient (nu/nu) mice. Hum Gene Ther 1995; 6: 457– 467 [DOI] [PubMed] [Google Scholar]
- 16.Merron A, Peerlinck I, Martin-Duque P, et al. SPECT/CT imaging of oncolytic adenovirus propagation in tumours in vivo using the Na/I symporter as a reporter gene. Gene Ther 2007; 14: 1731– 1738 [DOI] [PubMed] [Google Scholar]
- 17.Lin SH, Pu YS, Luo W, Wang Y, Logothetis CJ. Schedule-dependence of C-CAM1 adenovirus gene therapy in a prostate cancer model. Anticancer Res 1999; 19: 337– 340 [PubMed] [Google Scholar]
- 18.Waddington SN, McVey JH, Bhella D, et al. Adenovirus serotype 5 hexon mediates liver gene transfer. Cell 2008; 132: 397– 409 [DOI] [PubMed] [Google Scholar]
- 19.Catana C, Procissi D, Wu Y, et al. Simultaneous in vivo positron emission tomography and magnetic resonance imaging. Proc Natl Acad Sci U S A 2008; 105: 3705– 3710 [DOI] [PMC free article] [PubMed] [Google Scholar]
- 20.Judenhofer MS, Wehrl HF, Newport DF, et al. Simultaneous PET-MRI: a new approach for functional and morphological imaging. Nat Med 2008; 14: 459– 465 [DOI] [PubMed] [Google Scholar]
- 21.Raylman RR, Majewski S, Velan SS, et al. Simultaneous acquisition of magnetic resonance spectroscopy (MRS) data and positron emission tomography (PET) images with a prototype MR-compatible, small animal PET imager. J Magn Reson 2007; 186: 305– 310 [DOI] [PMC free article] [PubMed] [Google Scholar]
- 22.Schlemmer HP, Pichler BJ, Schmand M, et al. Simultaneous MR/PET imaging of the human brain: a feasibility study. Radiology 2008; 248: 1028– 1035 [DOI] [PubMed] [Google Scholar]
- 23.Choi H, Charnsangavej C, Faria SC, et al. Correlation of computed tomography and positron emission tomography in patients with metastatic gastrointestinal stromal tumor treated at a single institution with imatinib mesylate: proposal of new computed tomography response criteria. J Clin Oncol 2007; 25: 1753– 1759 [DOI] [PubMed] [Google Scholar]
- 24.Jackson EF, Esparza-Coss E, Wen X, et al. Magnetic resonance imaging of therapy-induced necrosis using gadolinium-chelated polyglutamic acids. Int J Radiat Oncol Biol Phys 2007; 68: 830– 838 [DOI] [PMC free article] [PubMed] [Google Scholar]
- 25.Rogers BE, Parry JJ, Andrews R, et al. MicroPET imaging of gene transfer with a somatostatin receptor-based reporter gene and 94mTc-demotate 1. J Nucl Med 2005; 46: 1889– 1897 [PubMed] [Google Scholar]
- 26.Han L, Yang D, Kundra V. Signaling can be uncoupled from imaging of the somatostatin receptor type 2. Mol Imaging 2007; 6: 427– 437 [PubMed] [Google Scholar]
Associated Data
This section collects any data citations, data availability statements, or supplementary materials included in this article.


