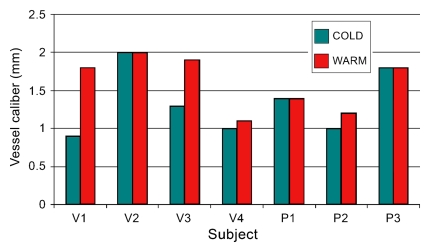
Figure 4b:
Results of provocative temperature challenge in seven subjects. (a) Graph shows number of visualized vessel segments per hand in volunteers (V) and patients (P). Note the increase in the number of visualized segments on warming observed in healthy volunteers, compared with a minimal change in the patient subgroup. (b) Graph shows caliber of a representative vessel in the hand of each subject. The terminal radial artery was measured for patient 3 (P3), and the superficial arch was measured in all other subjects, at identical positions on cold and warm images. An increase in vessel caliber was observed in three volunteers (V) and one patient (P).

