13C MR spectroscopic measurements of cerebral glucose uptake and metabolism lead to an understanding of the brain tricarboxylic acid cycle that, correlated with ornithine transcarbamylase deficiency severity, will potentially affect patient care.
Abstract
Purpose:
To determine cerebral glutamate turnover rate in partial–ornithine transcarbamylase deficiency (OTCD) patients by using carbon 13 (13C) magnetic resonance (MR) spectroscopy.
Materials and Methods:
The study was performed with approval of the institutional review board, in compliance with HIPAA regulations, and with written informed consent of the subjects. MR imaging, hydrogen 1 (1H) MR spectroscopy, and 13C MR spectroscopy were performed at 1.5 T in 10 subjects, six patients with OTCD and four healthy control subjects, who were in stable condition. Each received intravenous 13C-glucose (0.2 g/kg), C1 or C2 position, as a 15-minute bolus. Cerebral metabolites were determined with proton decoupling in a parieto-occipital region (n = 9) and without proton decoupling in a frontal region (n = 1) during 60–120 minutes.
Results:
Uptake and removal of cerebral glucose ([1-13C]–glucose or [2-13C]–glucose) were comparable in healthy control subjects and subjects with OTCD (P = .1). Glucose C1 was metabolized to glutamate C4 and glucose C2 was metabolized to glutamate C5 at comparable rates, both of which were significantly reduced in OTCD (combined, P = .04). No significant differences in glutamine formation were found in subjects with OTCD (P = .1). [2-13C]–glucose and its metabolic products were observed in anterior cingulate gyrus without proton decoupling in one subject with OTCD.
Conclusion:
Treatments that improve cerebral glucose metabolism and glutamate neurotransmission may improve neurologic outcome in patients with OTCD, in whom prevention and treatment of hyperammonemic episodes appear to be insufficient.
Supplemental material: http://radiology.rsnajnls.org/cgi/content/full/2523081878/DC1
© RSNA, 2009
The urea cycle disorders (UCDs) are a common group of inborn errors of metabolism (1,2). Syndromes involving deficiencies of five urea cycle enzymes and three cofactors and transporters have been described (3–5). The only X-linked disorder is ornithine transcarbamylase deficiency (OTCD), which has an estimated incidence of 1 in 14 000 (6). More than 240 mutations have been identified in the ornithine carbamoyltransferase gene, OTC (7). Up to 60% of hemizygous males have a mutation involving the enzyme-active site that manifests with hyperammonemic (HA) coma in the newborn (8,9). The remaining 40% demonstrate peripheral mutations in the gene, and onset of symptoms is present later in life, with a less severe phenotype. However, even these patients show substantial neurologic deficits (10).
Approximately 85% of heterozygous female carriers are asymptomatic on the basis of clinical history. The remainder may manifest behavioral aberrations and learning disabilities, protein intolerance, cyclical vomiting, strokelike episodes, and HA coma (11–14). Specific neurocognitive deficits exist in these patients (15). Despite average IQ scores, they display a neurobehavioral phenotype characterized by a nonverbal learning disability, associated with white matter dysfunction. Although several theories exist, it is not well understood how HA disrupts brain function. It is clear that HA coma in neonatal-onset UCDs is associated with severe brain injury. Approximately half of affected infants die of cerebral edema; moreover, those who survive 3 days or more of coma invariably have an intellectual disability (9). In children with partial defects, an association between the number and severity of recurrent HA episodes (ie, with or without coma) and subsequent cognitive and neurologic deficits does exist (10). What is less clear is the effect of milder or subclinical HA episodes on the brain.
With the use of proton (hydrogen 1 [1H]) magnetic resonance (MR) spectroscopy, we identified potential biomarkers of neurologic injury in a cross-sectional population of patients with partial OTCD, both symptomatic and asymptomatic, and in these patients, many had experienced a clinical event of HA several years prior to inclusion in this study (16). Thus, we provided evidence that even heterozygous subjects with asymptomatic OTCD may sustain subtle biochemical changes, white matter alterations, and associated cognitive deficits. UCDs are believed to impair neurotransmission. Most synapses in the central nervous system use glutamate as the major excitatory neurotransmitter. Results of studies in the sparse fur mouse, an animal model of OTCD, suggest impairments of cholinergic and glutamatergic transmission (17). To our knowledge, this impairment in glutamatergic neurotransmission has not been investigated in patients with OTCD. With the use of carbon 13 (13C) MR spectroscopy, we observed abnormalities in cerebral glutamate metabolism in patients with chronic hepatic encephalopathy. The purpose of our study was to determine cerebral glutamate turnover rate in patients with partial OTCD by using 13C MR spectroscopy.
Materials and Methods
Patient Demographics
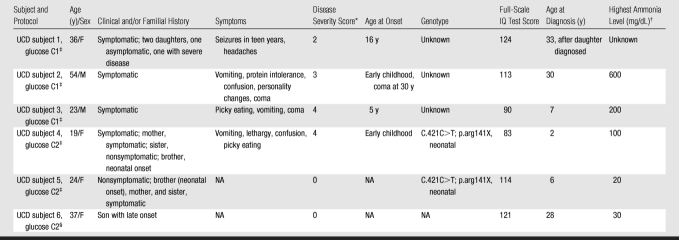
This study was compliant with the Heath Insurance Portability and Accountability Act, approval was obtained from the institutional review board of Huntington Memorial Hospital (Pasadena, Calif), and written informed consent was obtained from all subjects. Between November 2007 and August 2008, six OTCD patients were recruited from the National Urea Cycle Disorders Foundation (La Canada, Calif) and metabolism clinics across the United States in which patients with UCDs receive care. Several of these subjects also participated in a study at the National Institutes of Health–funded Rare Diseases Clinical Research Center (Washington, DC), which was established to study the natural history of UCDs. The sixth OTCD patient (Table) was recruited after completion of the initial trial and was examined with a different 13C MR spectroscopic protocol. We included male subjects with late-onset OTCD, as well as asymptomatic and symptomatic female subjects heterozygous for OTCD, with varying ages at diagnosis and metabolic control, who had IQ scores above 80, as measured by the Wechsler Abbreviated Scales of Intelligence by an author (A.L.G.), who was blinded to MR spectroscopic results. Patients were excluded from participation if they had an IQ less than 80, had acute illness at the time of study, were pregnant, or had contraindications to MR imaging owing to the presence of ferromagnetic metallic devices. Patients ranged in age from 19 to 54 years (mean age, 31 years). Four healthy control subjects were recruited by two authors (N.S., K.C.H.) from local communities, and these subjects ranged in age from 23 to 55 years, with a mean age of 31 years (two female subjects: mean age, 23 years; two male subjects: mean age, 39 years). All OTCD subjects were either asymptomatic or had HA in the past but were stable and in good health at the time of imaging. In two cases, a mutation had been identified; in the remainder, the diagnosis was made by biochemical means. Patient demographics are shown in the Table.
Patient Demographics and 13C-Glucose MR Spectroscopic Protocol
Note.—NA = not available.
* Disease severity score was defined as follows: 0 = no episode of symptomatic HA, 1 = single episode of HA, 2 = recurrent symptomatic HA, 3 = HA plus single episode of stage 3 coma without increased intracranial pressure, 4 = multiple episodes of HA plus single episode of stage 3 coma without increased intracranial pressure, 5 = multiple episodes of HA plus single episode of stage 3 coma plus one episode of increased intracranial pressure, and 6 = multiple episodes of HA plus single episode of stage 3 coma plus multiple episodes of increased intracranial pressure.
† To convert to Système International units in micromoles per liter, multiply value in micrograms per deciliter by 0.59. Normal range is 50–80 μmol/L, and metabolic cutoff level is greater than 100 μmol/L.
‡ Study was performed in the parietal brain.
§ Both parietal (data not shown) and frontal brain were examined.
13C-Glucose Infusion and 13C MR Spectroscopy
All participants fasted for at least 6 hours prior to the infusion protocols. 13C-enriched glucose from Cambridge Isotope Laboratories (Andover, Mass) was prepared as a pyrogen-free solution by a licensed pharmacist who is not an author (18). As part of a larger program designed to validate use of 13C MR spectroscopy of the frontal cortex for future clinical studies (19), incremental variants of earlier procedures were applied and compared with statistical analysis.
Either [1-13C]–glucose (n = 3 for OTCD patients, n = 2 for control subjects) or [2-13C]–glucose (n = 3 for OTCD patients, n = 2 for control subjects) infusion was performed by one author (O.A.). An infusion of 99% 13C-enriched glucose, at 0.23 g per kilogram of body weight (20% wt/vol), was administered intravenously as a single dose during 15 minutes. Serial blood samples (drawn every 10–15 minutes) at the end of the examination were collected in control subjects and OTCD patients ([2-13C]–glucose infusion). Total blood glucose was determined in situ by using a monitoring system (FreeStyle Flash; Abbott Diabetes Care, Alameda, Calif). Fractional 13C enrichment of glucose in plasma was determined by using 13C MR spectroscopy with an 11.5-T solid-state spectrometer (Bruker Optics, Billerica, Mass) by two authors (N.S., O.A.).
13C MR Spectroscopic Acquisition
Proton-decoupled 13C MR spectroscopy was performed by three authors (N.S., K.C.H., and B.D.R., with 15, 10, and 25 years of experience in clinical MR spectroscopy, respectively). Imaging was performed with a 1.5-T MR unit (Signa; GE Healthcare, Milwaukee, Wis) equipped with a broadband exciter, a dual-tuned half-head (surface) 1H-13C radiofrequency coil, a stand-alone proton decoupler, and a vector signal generator (model E4433B; Agilent Technologies, Englewood, Colo). The dual-tuned half-head 1H-13C radiofrequency coil (18), which could readily be dismounted from the MR imager, was applied to either the parieto-occipital region of the head or the forehead, whereby the anterior portions of the frontal lobe were included in the field of view. This frontal area roughly corresponds to Brodmann areas 9–11, 46, and possibly 47 (anatomically including the dorsolateral prefrontal cortex, anterior prefrontal cortex, orbitofrontal area, and inferior prefrontal gyrus) (19). A conventional rectangular 90° radiofrequency pulse-and-acquire data acquisition scheme was used with pulse width of 252 μsec. The radiofrequency-pulse power was optimized for a 45° flip angle (to minimize lipid scalp signal). Spectra were recorded from an estimated 140 and 200 mL of brain (frontal and parieto-occipital regions, respectively) by using a spectral width of 5000 Hz, 1024 data points, and repetition time of 1.5 seconds ([1-13C]–glucose infusion) and of 2.0 seconds ([2-13C]–glucose infusion). A wideband alternating-phase low-power technique for zero-residual splitting–four (or WALTZ-4) bilevel decoupling and nuclear Overhauser effect (or NOE) scheme with a bandwidth of 1000 Hz was used. Safety precautions were followed: The proton-pulse power for decoupling was 7 W during the data acquisition and 0.7 W during the nuclear Overhauser effect period, calibrated for cable loss, by using an external power meter (model E4418B; Agilent Technologies) at the point prior to the radiofrequency coil transmit port and continuously displayed during in vivo human studies. Power was well below the specific absorption rate guideline (18).
Natural-abundance 13C MR spectroscopy was performed for up to 25 minutes before the start of the glucose infusion. After the start of the infusion, serial spectra, with 3.2 minutes for [1-13C]–glucose infusion and 6.4 minutes for [2-13C]–glucose infusion, were acquired. A complete neurochemical brain examination, including proton MR imaging localizer, point-resolved spatially localized 1H MR spectroscopy, and homogeneity adjustment, natural-abundance, and 13C-enriched 13C MR spectroscopy, was achieved within 100 minutes for OTCD patients and 160 minutes for control subjects. Participants were imaged for as long as they could comfortably tolerate the examination. A longer period, up to 184 minutes, permitting better curve fitting beyond the steady state of 13C brain metabolite enrichment, was tolerated in control subjects.
Data and Statistical Analysis
Automatic, observer-independent software for 1H-decoupled 13C spectra (20), spectral analysis software (SAGE; GE HealthCare), and programming language (IDL; GE HealthCare) were used for data processing by two authors (N.S., K.C.H.), who were blinded to patient identity.
Absolute concentrations were determined as described in detail previously (18). Because myo-inositol is systematically reduced in patients with OTCD (21), whereas N-acetylaspartate remains constant, an internal quantitative reference, N-acetylaspartate, was employed to match proton and natural-abundance 13C spectra. All spectra and difference spectra were plotted, while the times after the start of infusion when 13C accumulation was first evident in the metabolites were recorded. Summed peak amplitudes of α and β anomers of glucose C1 or C2 fit function were used to describe the rate at which intravenously infused glucose (fractional enrichment) appeared in the brain; time to reach peak brain 13C-glucose and decay constant were used to describe the glucose signal decay. Time courses, peak amplitude, and fractional enrichment for glutamate, glutamine, and bicarbonate were recorded. Well-established biochemical criteria, confirmed in the present study, determine the different metabolic fates of cerebral 13C-glucose as follows: glutamate C5 and C1 (C2, C3, and C4 less evident after glucose C2 infusion); glutamine C5 and C1 (C2, C3, and C4 less evident after glucose C2 infusion); and aspartate C1 and C4 (C2 and C3 less evident after glucose C2 infusion). The rate of enrichment of the principal 13C metabolite, glutamate from glucose, was determined from the linear slope of TGlu/TGlc versus time, where TGlu is the time course of buildup and decay of glutamate and TGlc is the time course of buildup and decay of glucose, as previously described in detail elsewhere (18–22). Researchers in those studies (18–22) indicated that there is a linear relationship between substrate (glucose) and product (glutamate). For the calculation of fractional enrichment, glutamate and glutamine were estimated from natural-abundance 13C spectra from control subjects and OTCD patients.
Because glucose metabolism is unaffected by substitution of stable 13C for the natural carbon 12, data from the two 13C MR spectroscopic protocols were pooled after analysis. For continuous variables, the means and standard deviations were estimated separately for the OTCD and control groups, and an analysis was performed to determine whether variance in the two groups was the same by using the F test, followed by analysis with the two-sample t test with use of macros (QI Macros for Excel; Lifestar, Denver, Colo), add-on options for a spreadsheet (Excel; Microsoft, Redmond, Wash). All comparisons yielding a difference with P < .05 were considered significant.
Results
Cerebral Glucose Enrichment after Intravenous Infusion of [2-13C]–Glucose
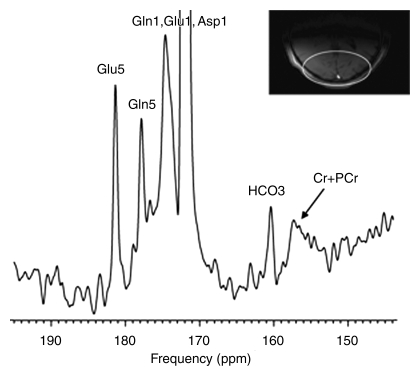
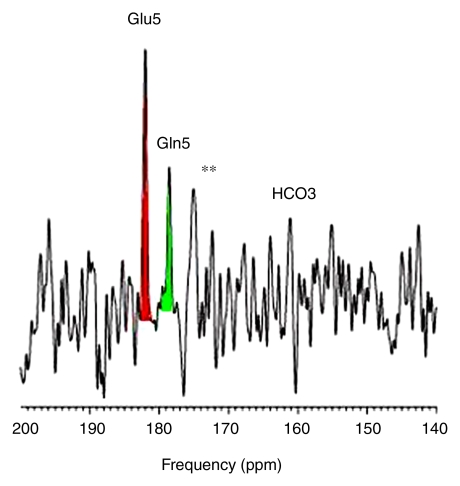
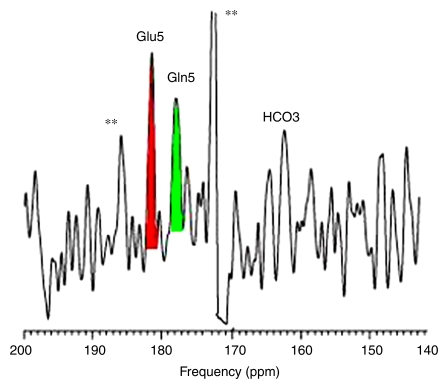
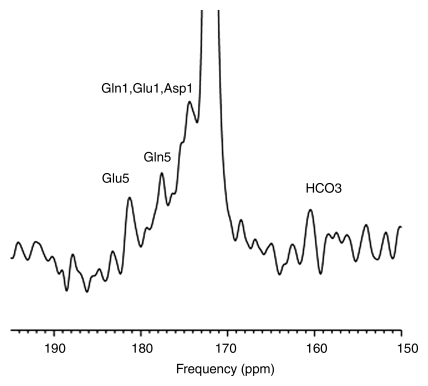
Intravenous infusion of [2-13C]–glucose achieved a mean of 45% 13C-glucose fractional enrichment (range, 42%–49%) in blood after 20 minutes, rapidly enriching the cerebral glucose pool. [2-13C]–glucose appeared in brain spectra as glucose C2 β and α anomers. Because of spectral overlap with intrinsic cerebral myo-inositol (72.1–75.3 ppm [23]), there is a subtle line-broadening of both glucose C2 resonances, which was readily removed by creation of different spectra between natural-abundance and enriched brain spectra. Further metabolism of intracerebral [2-13C]–glucose occurred as predicted during three consecutive turns of the neuronal tricarboxylic acid and the glial neuronal glutamine-glutamate cycles, resulting in substantial enrichment of glutamate C5, glutamine C5, and aspartate C1 (first turn), overlapping resonances of glutamate C1 plus glutamine C1 (second turn), and bicarbonate (third turn) (Fig 1). The remaining resonances in Figure 1 were defined as carbonyl carbon (-C=O) resonance of unenriched lipid (172 ppm) and cerebral creatine plus phosphocreatine (158.9 ppm). Comparable (but not identical) results were observed when [2-13C]–glucose was administered intravenously to patients with OTCD. Enriched β and α anomers of [2-13C]–glucose and its metabolic products glutamate C5, glutamine C5, and bicarbonate are illustrated in Figure 2.
Figure 1:
13C MR spectra (160–190 ppm) of normal brain after enrichment with [2-13C]–glucose. Spectra summed for 184 minutes after 13C-glucose infusion identify enriched cerebral metabolites glutamate C5 (Glu5) (182 ppm), glutamine C5 (Gln5) (178.4 ppm), glutamate C1 (Glu1), glutamine C1 (Gln1) (175 ppm), as well as aspartate C1 (Asp1), and bicarbonate (HCO3) (161 ppm). Carbonyl carbon (-C=O) resonance of unenriched lipid (172 ppm) and unenriched creatine plus phosphocreatine (Cr + PCr) were observed. Inset: Axial image shows parieto-occipital brain region included in MR spectroscopic field of view (ellipse).
Figure 2a:
Cerebral metabolism of [2-13C]–glucose in (a) healthy control subject with normal brain glutamate C5, glutamine C5, and bicarbonate (b) and representative OTCD patient with similar 13C metabolites. Difference spectra were created by subtraction of natural-abundance from enriched-brain spectra acquired 40–60 minutes after [2-13C]–glucose infusion. ** = Artifacts of difference spectroscopy. Keys are same as for Figure 1.
Figure 2b:
Cerebral metabolism of [2-13C]–glucose in (a) healthy control subject with normal brain glutamate C5, glutamine C5, and bicarbonate (b) and representative OTCD patient with similar 13C metabolites. Difference spectra were created by subtraction of natural-abundance from enriched-brain spectra acquired 40–60 minutes after [2-13C]–glucose infusion. ** = Artifacts of difference spectroscopy. Keys are same as for Figure 1.
Cerebral [1-13C]–Glucose Enrichment and Metabolism
Cerebral enrichment and metabolism of intravenously infused [1-13C]–glucose in healthy subjects (Fig E1 [http://radiology.rsnajnls.org/cgi/content/full/2523081878/DC1]) showed rapid appearance of enriched glucose C1 β and α anomers preceding enrichment of glutamate C4 (first turn of neuronal tricarboxylic acid), glutamate C2 and C3 (second turn), glutamate C1, and bicarbonate (third turn).
Effect of OTCD on Cerebral 13C-Glucose and Glutamate Metabolism
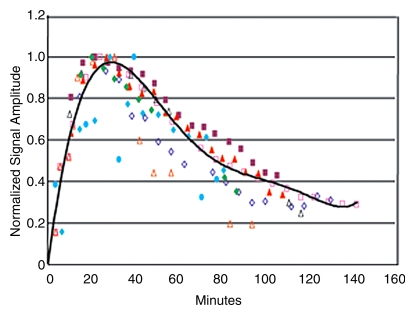
No differences in cerebral 13C-glucose were observed in pooled OTCD patients (n = 5) versus pooled control subjects (n = 4) (Fig 3a). There were no significant differences between healthy control subjects and OTCD patients with respect to mean rate of increase (9.4 min−1 ± 3.8 [standard deviation] vs 7.8 min−1 ± 0.4, P = .4), mean time to peak (23 minutes ± 2 vs 26 minutes ± 7, P = .1), and mean rate of decline (67 min−1 ± 12 vs 34 min−1 ± 16, P = .3).
Figure 3a:
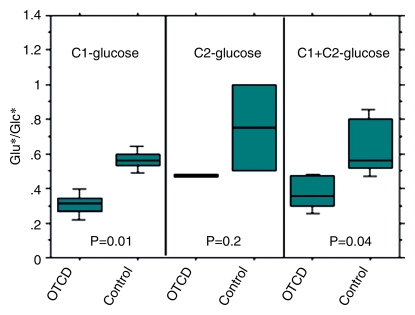
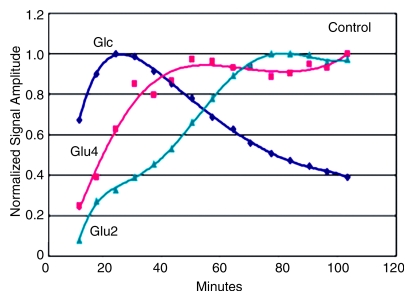
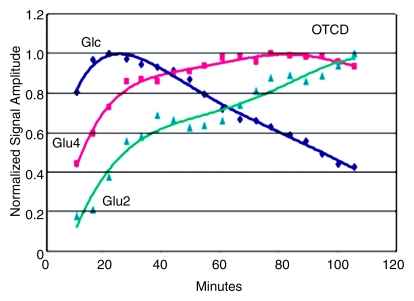
Effects of OTCD on cerebral metabolism of 13C-glucose and glutamate (Glu). (a) Comparative rates of cerebral accumulation and removal of infused [1-13C]– and [2-13C]–glucose in OTCD (open symbols) and healthy (solid symbols) subjects. Proton-decoupled spectra were acquired from posterior parietal brain in nine subjects (five OTCD patients and four healthy control subjects) for 2 hours after enrichment by means of intravenous glucose (Glc) (0.15 g/kg) enriched in either C1 (n = 5) or C2 (n = 5) position. Both isotopes of glucose showed rapid increase to peak brain 13C-glucose at 20 minutes or longer and slower elimination by 120 minutes. No significant differences between C1 and C2 or between OTCD patients and healthy subjects were observed (numeric rates and P values are in text). (b) Relative rates of cerebral enrichment of glutamate from 13C-glucose in OTCD patients and control subjects. Box plots of rates of glutamate enrichment from glucose C1, glucose C2, and combination of glucose C1 and C2 in OTCD patients and control subjects. Metabolic product is Glu4/Glc1 for glucose C1, where Glc1 = glucose C1 and Glu4 = glutamate C4, Glu5/Glc2 for glucose C2, where Glu5 = glutamate C5 and Glc2 = glucose C2. Metabolic product is Glu4,5/Glc1,2, where Glu4,5 = glutamate C4 and C5 and Glc1,2 = glucose C1 and C2; results for glucose C1 and C2 (C1 + C2) were pooled. Glu* = glutamate C4 or C5 and Glc* = glucose C1 or C2. Time course of appearance of [1-13C]–glucose and glutamate in brain of representative (c) control subject and (d) OTCD patient. Proton-decoupled 13C brain spectra were acquired in 6-minute blocks for 100 minutes after intravenous infusion of [1-13C]–glucose. Peak heights of glucose (Glc), glutamate C4 (Glu4), and glutamate C2 (Glu2) were plotted. Enrichment of brain glucose precedes glutamate C4 (first turn), which in turn precedes enrichment of glutamate C2 (second turn). From slopes of linear line–fit Glu4/Glc1, where Glu4 = glutamate C4 and Glc1 = glucose C1, versus time (and Glu5/Glc1 vs time, where Glu5 = glutamate C5) in all subjects; the rates of glutamate formation in OTCD patients were lower than in healthy control subjects, as on b.
Figure 3b:
Effects of OTCD on cerebral metabolism of 13C-glucose and glutamate (Glu). (a) Comparative rates of cerebral accumulation and removal of infused [1-13C]– and [2-13C]–glucose in OTCD (open symbols) and healthy (solid symbols) subjects. Proton-decoupled spectra were acquired from posterior parietal brain in nine subjects (five OTCD patients and four healthy control subjects) for 2 hours after enrichment by means of intravenous glucose (Glc) (0.15 g/kg) enriched in either C1 (n = 5) or C2 (n = 5) position. Both isotopes of glucose showed rapid increase to peak brain 13C-glucose at 20 minutes or longer and slower elimination by 120 minutes. No significant differences between C1 and C2 or between OTCD patients and healthy subjects were observed (numeric rates and P values are in text). (b) Relative rates of cerebral enrichment of glutamate from 13C-glucose in OTCD patients and control subjects. Box plots of rates of glutamate enrichment from glucose C1, glucose C2, and combination of glucose C1 and C2 in OTCD patients and control subjects. Metabolic product is Glu4/Glc1 for glucose C1, where Glc1 = glucose C1 and Glu4 = glutamate C4, Glu5/Glc2 for glucose C2, where Glu5 = glutamate C5 and Glc2 = glucose C2. Metabolic product is Glu4,5/Glc1,2, where Glu4,5 = glutamate C4 and C5 and Glc1,2 = glucose C1 and C2; results for glucose C1 and C2 (C1 + C2) were pooled. Glu* = glutamate C4 or C5 and Glc* = glucose C1 or C2. Time course of appearance of [1-13C]–glucose and glutamate in brain of representative (c) control subject and (d) OTCD patient. Proton-decoupled 13C brain spectra were acquired in 6-minute blocks for 100 minutes after intravenous infusion of [1-13C]–glucose. Peak heights of glucose (Glc), glutamate C4 (Glu4), and glutamate C2 (Glu2) were plotted. Enrichment of brain glucose precedes glutamate C4 (first turn), which in turn precedes enrichment of glutamate C2 (second turn). From slopes of linear line–fit Glu4/Glc1, where Glu4 = glutamate C4 and Glc1 = glucose C1, versus time (and Glu5/Glc1 vs time, where Glu5 = glutamate C5) in all subjects; the rates of glutamate formation in OTCD patients were lower than in healthy control subjects, as on b.
Figure 3c:
Effects of OTCD on cerebral metabolism of 13C-glucose and glutamate (Glu). (a) Comparative rates of cerebral accumulation and removal of infused [1-13C]– and [2-13C]–glucose in OTCD (open symbols) and healthy (solid symbols) subjects. Proton-decoupled spectra were acquired from posterior parietal brain in nine subjects (five OTCD patients and four healthy control subjects) for 2 hours after enrichment by means of intravenous glucose (Glc) (0.15 g/kg) enriched in either C1 (n = 5) or C2 (n = 5) position. Both isotopes of glucose showed rapid increase to peak brain 13C-glucose at 20 minutes or longer and slower elimination by 120 minutes. No significant differences between C1 and C2 or between OTCD patients and healthy subjects were observed (numeric rates and P values are in text). (b) Relative rates of cerebral enrichment of glutamate from 13C-glucose in OTCD patients and control subjects. Box plots of rates of glutamate enrichment from glucose C1, glucose C2, and combination of glucose C1 and C2 in OTCD patients and control subjects. Metabolic product is Glu4/Glc1 for glucose C1, where Glc1 = glucose C1 and Glu4 = glutamate C4, Glu5/Glc2 for glucose C2, where Glu5 = glutamate C5 and Glc2 = glucose C2. Metabolic product is Glu4,5/Glc1,2, where Glu4,5 = glutamate C4 and C5 and Glc1,2 = glucose C1 and C2; results for glucose C1 and C2 (C1 + C2) were pooled. Glu* = glutamate C4 or C5 and Glc* = glucose C1 or C2. Time course of appearance of [1-13C]–glucose and glutamate in brain of representative (c) control subject and (d) OTCD patient. Proton-decoupled 13C brain spectra were acquired in 6-minute blocks for 100 minutes after intravenous infusion of [1-13C]–glucose. Peak heights of glucose (Glc), glutamate C4 (Glu4), and glutamate C2 (Glu2) were plotted. Enrichment of brain glucose precedes glutamate C4 (first turn), which in turn precedes enrichment of glutamate C2 (second turn). From slopes of linear line–fit Glu4/Glc1, where Glu4 = glutamate C4 and Glc1 = glucose C1, versus time (and Glu5/Glc1 vs time, where Glu5 = glutamate C5) in all subjects; the rates of glutamate formation in OTCD patients were lower than in healthy control subjects, as on b.
Figure 3d:
Effects of OTCD on cerebral metabolism of 13C-glucose and glutamate (Glu). (a) Comparative rates of cerebral accumulation and removal of infused [1-13C]– and [2-13C]–glucose in OTCD (open symbols) and healthy (solid symbols) subjects. Proton-decoupled spectra were acquired from posterior parietal brain in nine subjects (five OTCD patients and four healthy control subjects) for 2 hours after enrichment by means of intravenous glucose (Glc) (0.15 g/kg) enriched in either C1 (n = 5) or C2 (n = 5) position. Both isotopes of glucose showed rapid increase to peak brain 13C-glucose at 20 minutes or longer and slower elimination by 120 minutes. No significant differences between C1 and C2 or between OTCD patients and healthy subjects were observed (numeric rates and P values are in text). (b) Relative rates of cerebral enrichment of glutamate from 13C-glucose in OTCD patients and control subjects. Box plots of rates of glutamate enrichment from glucose C1, glucose C2, and combination of glucose C1 and C2 in OTCD patients and control subjects. Metabolic product is Glu4/Glc1 for glucose C1, where Glc1 = glucose C1 and Glu4 = glutamate C4, Glu5/Glc2 for glucose C2, where Glu5 = glutamate C5 and Glc2 = glucose C2. Metabolic product is Glu4,5/Glc1,2, where Glu4,5 = glutamate C4 and C5 and Glc1,2 = glucose C1 and C2; results for glucose C1 and C2 (C1 + C2) were pooled. Glu* = glutamate C4 or C5 and Glc* = glucose C1 or C2. Time course of appearance of [1-13C]–glucose and glutamate in brain of representative (c) control subject and (d) OTCD patient. Proton-decoupled 13C brain spectra were acquired in 6-minute blocks for 100 minutes after intravenous infusion of [1-13C]–glucose. Peak heights of glucose (Glc), glutamate C4 (Glu4), and glutamate C2 (Glu2) were plotted. Enrichment of brain glucose precedes glutamate C4 (first turn), which in turn precedes enrichment of glutamate C2 (second turn). From slopes of linear line–fit Glu4/Glc1, where Glu4 = glutamate C4 and Glc1 = glucose C1, versus time (and Glu5/Glc1 vs time, where Glu5 = glutamate C5) in all subjects; the rates of glutamate formation in OTCD patients were lower than in healthy control subjects, as on b.
The time courses of glutamate C4 and C2 and [1-13C]–glucose appearing in the brain of one control subject (Fig 3c) and of one OTCD patient (Fig 3d) illustrate the principal differences between OTCD patients and control subjects.
The slope of straight-line fits of Glu4/Glc1, where Glu4 is glutamate C4 and Glc1 is glucose C1, and Glu5/Glc2, where Glu5 is glutamate C5 and Glc2 is glucose C2, which define the rate of incorporation of 13C into cerebral glutamate at the first turn of tricarboxylic acid (C4 or C5), was 46% slower in OTCD patients than in control subjects (P = .04 for pooled data) (Fig 3b).
Neuronal Metabolic Activity in Frontal Brain
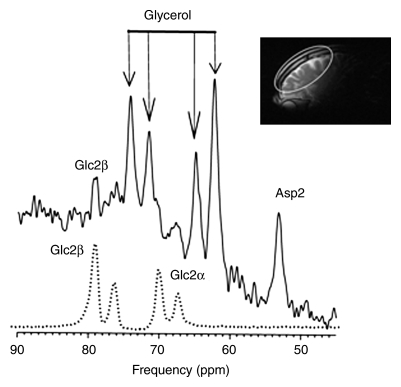
The β and α anomers of glucose (and natural-abundance cerebral glycerol) each appear as two peaks of approximately 50% signal intensity (19). [2-13C]–β-glucose and its primary metabolites (glutamate C5, glutamine C5, glutamate C1 plus glutamine C1, aspartate C1, and bicarbonate) were all readily observed in this frontal brain examination (Fig 4), confirming that the technique is applicable to the frontal brain regions studied.
Figure 4a:
13C spectra from frontal brain of OTCD patient. After infusion of [2-13C]–glucose, 13C-enriched cerebral metabolites were assayed in posterior brain with low-power noise decoupling. 13C MR spectra were then acquired from frontal brain for further 40 minutes. (a) Glucose C2 (Glc2), with β and α anomers, was detected as four rather than two resonances and (b) metabolic products, glutamate C5 (Glu5), glutamine C5 (Gln5), bicarbonate (HCO3), and aspartate C2 (Asp2), were identified. Asp1 = aspartate C1, Gln1 = glutamine C1, Glu1 = glutamate C1. Inset: Sagittal image shows frontal brain region included in MR spectroscopic field of view (ellipse).
Figure 4b:
13C spectra from frontal brain of OTCD patient. After infusion of [2-13C]–glucose, 13C-enriched cerebral metabolites were assayed in posterior brain with low-power noise decoupling. 13C MR spectra were then acquired from frontal brain for further 40 minutes. (a) Glucose C2 (Glc2), with β and α anomers, was detected as four rather than two resonances and (b) metabolic products, glutamate C5 (Glu5), glutamine C5 (Gln5), bicarbonate (HCO3), and aspartate C2 (Asp2), were identified. Asp1 = aspartate C1, Gln1 = glutamine C1, Glu1 = glutamate C1. Inset: Sagittal image shows frontal brain region included in MR spectroscopic field of view (ellipse).
Discussion
In this report, we describe a substantial abnormality in cerebral glutamate synthesis from glucose in patients with OTCD. Furthermore, these neuropsychological and metabolic findings are largely uncorrected by the currently available treatments (protein restriction and nitrogen scavenger therapy) and have been observed in subjects who consider themselves asymptomatic (15). The implication must be that this single therapy is insufficient to entirely ameliorate the metabolic effects of OTCD. Such is the probable interpretation of the present findings with 13C MR spectroscopy also. As in an earlier study of patients with hepatic encephalopathy secondary to cirrhosis and liver failure, we have identified substantial reduction in the rate at which glutamate is synthesized from administered glucose.
Glutamate neurotransmission is carried out by a glial neuronal process that includes the oxidation of glucose and the glutamine-glutamate cycle (24). Incorporation of [1-13C]–labeled glucose into cerebral glutamate and glutamine pools allows for direct in vivo measurement of glutamate neurotransmission by using proton-decoupled 13C MR spectroscopy (25–27). The metabolic model predicts that, with conditions of increased plasma ammonia, the increase in the rate of glutamine synthesis is stoichiometrically coupled to the increase in the uptake of the anaplerotic substrates CO2 and ammonia and the efflux of glutamine from the brain. Bluml et al (18) showed that there is disturbed neurotransmitter glutamate-glutamine cycling in chronic hepatic encephalopathy. Glutamate enrichment is decreased and glutamine enrichment is increased.
Although 1H MR spectroscopy is a sensitive tool to detect biochemical abnormalities in individual patients, in vivo 13C MR spectroscopy can reliably be used to quantitate distinct signal intensity values from glutamate and glutamine. Unambiguous assignment of these metabolites can contribute to a better understanding of the pathogenesis and treatment of brain dysfunction in UCDs.
13C MR spectroscopic measurements of cerebral glucose uptake and metabolism lead to an understanding of the brain tricarboxylic acid cycle that, correlated with OTCD severity, will potentially affect patient care. The natural abundance of glucose is 1% and, therefore, enrichment with a nonradioactive 13C-labeled substrate administered intravenously is required to follow the fate of label incorporation into glutamine, glutamate, aspartate, and finally to bicarbonate. To our knowledge, these important studies have not, to date, been performed in humans with UCDs. Studies in rats have applied 13C nuclear MR spectroscopy to directly examine the effects of ammonia on the activity of pyruvate carboxylase (ie, the anaplerotic pathway) and the amino acid metabolism in the rat brain in vivo (28).
Investigators in most studies in which 13C MR spectroscopy is used have determined cycling from isotopic labeling of glutamine and glutamate by using a [1-13C]–glucose tracer, which provides the label through neuronal and glial pyruvate dehydrogenase or through glial pyruvate carboxylase. To measure the anaplerotic contribution, 13C incorporation into glutamate and glutamine in the occipital-parietal region of patients who are awake, we also used an infusion of [2-13C]–glucose, which labels the C2 and C3 positions of glutamine and glutamate exclusively through pyruvate carboxylase. The particular features of the present study that relate to the glial anaplerotic pathway do not suggest that this activity is substantial in OTCD patients. Rather, we consider that the defect lies in the major metabolic pathways through neurons and glia, which contribute to glutamate neurotransmission in the well-known glutamine-glutamate cycle. However, the use of [2-13C]–glucose also served another valuable purpose: Because this approach allowed detection of 13C brain metabolism without the forbidden proton-decoupling conventionally employed, we were able to safely examine frontal brain regions to confirm a similar pattern of metabolism.
Our study had limitations. First, the study sample was small, but this is a problem in performing studies in such rare conditions. Second, there was only one study in the frontal brain where no decoupling was applied; therefore, it is possible that this approach might not be practical in studying dynamics and exchange rate. Third, clinical heterogeneity and differences between the sex of our control subjects and that of the patients may have influenced findings; therefore, evaluation of a larger cohort with variable clinical severity is needed. Our protocol proved acceptable in this patient population, as no participant complaints or adverse events were encountered.
We discussed our results by comparing the two methods of 13C enrichment, as well as the potential to use these methods to collect preliminary data on subjects with metabolic defects that lead to faulty ammonia regulation and neurotransmission. The implications for normalizing neurodevelopment in this rare inherited enzyme defect may be substantial for the effect of the future direction of neuroprotection in this and related inborn errors of metabolism, as well as in the much more common chronic hepatic encephalopathy.
Advances in Knowledge.
Reduced glutamate neurotransmission was documented in ornithine transcarbamylase deficiency (OTCD) patients.
Feasibility of 13C MR spectroscopy in frontal brain structures was demonstrated.
Implications for Patient Care.
Treatments that improve cerebral glucose metabolism and glutamate neurotransmission may improve neurologic outcome in OTCD patients, in whom prevention and treatment of hyperammonemic episodes appears insufficient.
Newer 13C MR spectroscopic techniques may elucidate other cognitive brain disorders.
Supplementary Material
Acknowledgments
We thank the subjects for their participation and Cindy LeMons, National Urea Cycle Disorders Foundation, for her enthusiasm with regard to this study.
Received November 29, 2008; revision requested January 30, 2009; final revision received February 12; accepted March 11; final version accepted April 6.
K.C.H. supported by National Alliance for Research on Schizophrenia and Depression, and B.D.R. supported by Rudi Schulte Research Institutes.
Funding: This research was supported by the National Institutes of Health (grant K25DA21112), National Center for Research Resources (grant K12RR17613), and National Center for Research Resources/National Institute of Child Health and Human Development (grant U54 RR019453).
Authors stated no financial relationship to disclose.
Abbreviations:
- HA
- hyperammonemia
- OTCD
- ornithine transcarbamylase deficiency
- UCD
- urea cycle disorder
References
- 1.Nagata N, Matsuda I, Matsuura T, et al. Retrospective survey of urea cycle disorders. II. Neurological outcome in forty-nine Japanese patients with urea cycle enzymopathies. Am J Med Genet 1991; 40( 4): 477– 481 [DOI] [PubMed] [Google Scholar]
- 2.Applegarth DA, Toone JR, Lowry RB. Incidence of inborn errors of metabolism in British Columbia, 1969–1996. Pediatrics 2000; 105( 1): e10. [DOI] [PubMed] [Google Scholar]
- 3.Brusilow SW, Maestri NE. Urea cycle disorders: diagnosis, pathophysiology, and therapy. Adv Pediatr 1996; 43: 127– 170 [PubMed] [Google Scholar]
- 4.Dionisi-Vici C, Rizzo C, Burlina AB, et al. Inborn errors of metabolism in the Italian pediatric population: a national retrospective survey. J Pediatr 2002; 140( 3): 321– 327 [DOI] [PubMed] [Google Scholar]
- 5.Tuchman M, Jaleel N, Morizono H, Sheehy L, Lynch MG. Mutations and polymorphisms in the human ornithine transcarbamylase gene. Hum Mutat 2002; 19( 2): 93– 107 [DOI] [PubMed] [Google Scholar]
- 6.Kang ES, Snodgrass PJ, Gerald PS. Ornithine transcarbamylase deficiency in the newborn infant. J Pediatr 1973; 82( 4): 642– 649 [DOI] [PubMed] [Google Scholar]
- 7.Maestri NE, Clissold D, Brusilow SW. Neonatal onset ornithine transcarbamylase deficiency: a retrospective analysis. J Pediatr 1999; 134( 3): 268– 272 [DOI] [PubMed] [Google Scholar]
- 8.McCullough BA, Yudkoff M, Batshaw ML, Wilson JM, Raper SE, Tuchman M. Genotype spectrum of ornithine transcarbamylase deficiency: correlation with the clinical and biochemical phenotype. Am J Med Genet 2000; 93( 4): 313– 319 [DOI] [PubMed] [Google Scholar]
- 9.Msall M, Batshaw ML, Suss R, Brusilow SW, Mellits ED. Neurologic outcome in children with inborn errors of urea synthesis: outcome of urea-cycle enzymopathies. N Engl J Med 1984; 310( 23): 1500– 1505 [DOI] [PubMed] [Google Scholar]
- 10.Msall M, Monahan PS, Chapanis N, Batshaw ML. Cognitive development in children with inborn errors of urea synthesis. Acta Paediatr Jpn 1988; 30( 4): 435– 441 [DOI] [PubMed] [Google Scholar]
- 11.Christodoulou J, Qureshi IA, McInnes RR, Clarke JT. Ornithine transcarbamylase deficiency presenting with strokelike episodes. J Pediatr 1993; 122( 3): 423– 425 [DOI] [PubMed] [Google Scholar]
- 12.Maestri NE, Lord C, Glynn M, Bale A, Brusilow SW. The phenotype of ostensibly healthy women who are carriers for ornithine transcarbamylase deficiency. Medicine (Baltimore) 1998; 77( 6): 389– 397 [PubMed] [Google Scholar]
- 13.Mamourian AC, du Plessis A. Urea cycle defect: a case with MR and CT findings resembling infarct. Pediatr Radiol 1991; 21( 8): 594– 595 [DOI] [PubMed] [Google Scholar]
- 14.Pridmore CL, Clarke JT, Blaser S. Ornithine transcarbamylase deficiency in females: an often overlooked cause of treatable encephalopathy. J Child Neurol 1995; 10( 5): 369– 374 [DOI] [PubMed] [Google Scholar]
- 15.Gyato K, Wray J, Huang ZJ, Yudkoff M, Batshaw ML. Metabolic and neuropsychological phenotype in women heterozygous for ornithine transcarbamylase deficiency. Ann Neurol 2004; 55( 1): 80– 86 [DOI] [PubMed] [Google Scholar]
- 16.Gropman AL, Seltzer RR, Yudkoff M, Sawyer A, VanMeter J, Fricke ST. 1H MRS allows brain phenotype differentiation in sisters with late onset ornithine transcarbamylase deficiency (OTCD) and discordant clinical presentations. Mol Genet Metab 2008; 94( 1): 52– 60 [DOI] [PMC free article] [PubMed] [Google Scholar]
- 17.Robinson MB, Hopkins K, Batshaw ML, McLaughlin BA, Heyes MP, Oster-Granite ML. Evidence of excitotoxicity in the brain of the ornithine carbamoyltransferase deficient sparse fur mouse. Brain Res Dev Brain Res 1995; 90( 1–2): 35– 44 [DOI] [PubMed] [Google Scholar]
- 18.Bluml S, Moreno-Torres A, Ross BD. [1-13C]glucose MRS in chronic hepatic encephalopathy in man. Magn Reson Med 2001; 45( 6): 981– 993 [DOI] [PubMed] [Google Scholar]
- 19.Sailasuta N, Robertson LW, Harris KC, Gropman AL, Allen PS, Ross BD. Clinical NOE 13C MRS for neuropsychiatric disorders of the frontal lobe. J Magn Reson 2008; 195( 2): 219– 225 [DOI] [PMC free article] [PubMed] [Google Scholar]
- 20.Shic F, Ross B. Automated data processing of [1H-decoupled] 13C MR spectra acquired from human brain in vivo. J Magn Reson 2003; 162( 2): 259– 268 [DOI] [PubMed] [Google Scholar]
- 21.Gropman AL, Fricke ST, Seltzer RR, et al. 1H MRS identifies symptomatic and asymptomatic subjects with partial ornithine transcarbamylase deficiency. Mol Genet Metab 2008; 95( 1–2): 21– 30 [DOI] [PMC free article] [PubMed] [Google Scholar]
- 22.Lin AP, Shic F, Enriquez C, Ross BD. Reduced glutamate neurotransmission in patients with Alzheimer's disease: an in vivo (13)C magnetic resonance spectroscopy study. MAGMA 2003; 16( 1): 29– 42 [DOI] [PubMed] [Google Scholar]
- 23.Bluml S. In vivo quantitation of cerebral metabolite concentrations using natural abundance 13C MRS at 1.5 T. J Magn Reson 1999; 136( 2): 219– 225 [DOI] [PubMed] [Google Scholar]
- 24.Magistretti PJ, Pellerin L. Cellular mechanisms of brain energy metabolism: relevance to functional brain imaging and to neurodegenerative disorders. Ann N Y Acad Sci 1996; 777: 380– 387 [DOI] [PubMed] [Google Scholar]
- 25.Mason GF, Petersen KF, de Graaf RA, Shulman GI, Rothman DL. Measurements of the anaplerotic rate in the human cerebral cortex using 13C magnetic resonance spectroscopy and [1-13C] and [2-13C] glucose. J Neurochem 2007; 100( 1): 73– 86 [DOI] [PMC free article] [PubMed] [Google Scholar]
- 26.Gruetter R, Seaquist ER, Kim S, Ugurbil K. Localized in vivo 13C-NMR of glutamate metabolism in the human brain: initial results at 4 tesla. Dev Neurosci 1998; 20( 4–5): 380– 388 [DOI] [PubMed] [Google Scholar]
- 27.Moreno A, Ross BD, Bluml S. Direct determination of the N-acetyl-L-aspartate synthesis rate in the human brain by (13)C MRS and [1-(13)C]glucose infusion. J Neurochem 2001; 77( 1): 347– 350 [DOI] [PubMed] [Google Scholar]
- 28.Kanamatsu T, Tsukada Y. Effects of ammonia on the anaplerotic pathway and amino acid metabolism in the brain: an ex vivo 13C NMR spectroscopic study of rats after administering [2-13C]] glucose with or without ammonium acetate. Brain Res 1999; 841( 1–2): 11– 19 [DOI] [PubMed] [Google Scholar]
Associated Data
This section collects any data citations, data availability statements, or supplementary materials included in this article.


