

Abstract
Current mass spectrometers provide a number of alternative methodologies for producing tandem mass spectra specifically for phosphopeptide analysis. In particular, generation of MS3 spectra in a data-dependent manner upon detection of the neutral loss of a phosphoric acid in MS2 spectra is a popular technique for circumventing the problem of poor phosphopeptide backbone fragmentation. The newer Multistage Activation method provides another option. Both these strategies require additional cycle time on the instrument and therefore reduce the number of spectra that can be measured in the same amount of time. Additional informatics is often required to make most efficient use of the additional information provided by these spectra as well. This work presents a comparison of several commonly used mass spectrometry methods for the study of phosphopeptide-enriched samples: an MS2-only method, a Multistage Activation method, and an MS2/MS3 data-dependent neutral loss method. Several strategies for dealing effectively with the resulting MS3 data in the latter approach are also presented and compared. The overall goal is to infer whether any one methodology performs significantly better than another for identifying phosphopeptides. On data presented here, the Multistage Activation methodology is demonstrated to perform optimally and does not result in significant loss of unique peptide identifications.
Keywords: Protein phosphorylation, mass spectrometry, MS3, Multistage Activation, phosphoproteomics, bioinformatics, peptide identification, database search
INTRODUCTION
Phosphorylation is one of the most highly studied and ubiquitous protein post-translational modifications (PTMs), playing a key role in regulating the cell cycle, cell growth and death, metabolism, transcription, morphology and motility, and differentiation due to its prominence in signal transduction and protein complex formation (1, 2). The fact that there are over 500 protein kinases in mammals (3, 4), a number that is likely doubled in plants (5), and that an estimated 30% or more of proteins are phosphorylated at some point during their life cycle (2), underscores the biological importance of this modification. Alterations in normal phosphorylation patterns have been implicated in a number of diseases, including cancer (6–8) and Alzheimer’s (9). The accurate identification of phosphorylation sites on phosphoproteins, and understanding the dynamics of this modification in response to cellular and environmental factors, is thus critical for elucidating the systems biology of complex disease mechanisms and global regulatory networks. Consequently, development of methods for detecting and characterizing phosphorylated proteins has been an active area of research in the proteomics community. In particular, high throughput analysis of phosphorylation using directed enrichment methods followed by mass spectrometry (MS) has become a standard approach for phosphoprotein detection (10–18).
There are several aspects of phosphoproteomics that make it a challenging endeavor. The primary difficulty is one of stoichiometry: phosphoproteins are often expressed in relatively low amounts in a cell, and few of these proteins exist in a phosphorylated form at any one time. Also, enrichment strategies, while improving, are often limiting, and may not yet be at the necessary efficiency for sample-limited studies and clinical work. Thirdly, phosphopeptides can exhibit poor fragmentation in a mass spectrometer. Lastly, informatics approaches for processing the results of phosphopeptide mass spectrometry data are not yet routine.
The third issue mentioned, the poor fragmentation of phosphopeptides, is due to the fact that the phosphate moiety is often the most labile element on the peptide. In the case of collision-induced dissociation (CID) in ion trap mass spectrometers, much of the fragmentation energy used to produce a tandem mass spectrum (MS/MS or MS2) often is absorbed in the dissociation of the phosphate group. The resulting spectrum is therefore often dominated by one or several peaks corresponding to the neutral loss of phosphoric acid (−98 Da), with little other fragmentation information useful for identification of the peptide sequence (19). This issue has been addressed using data-dependent MS3 methodologies for generating mass spectra, typically on ion-trap instruments. Subjecting neutral-loss fragment masses to a further cycle of fragmentation often produces a spectrum with much more useful sequence information for the peptide (20). Therefore, phosphopeptides have often been analyzed by automated data-dependent triggering of MS3 acquisition whenever the neutral loss ion of the appropriate mass is detected in an MS2 spectrum as a dominant peak (16, 21–27).
Despite the apparent advantages, researchers are beginning to question the merits of generating MS3 data for phosphopeptide studies. An argument given is that, due to increased capacity in the newer ion traps, spectra generated already contain sufficient fragmentation information in their MS2 spectra to uniquely identify the peptide. Although the dominant peak is most often still due to the neutral loss of the phosphate, sufficient information is contained in the smaller peaks to derive amino acid sequence information (28). Moreover, it is argued that the cycle time spent on generating MS3 information detracts from the overall number of MS2 spectra that can be produced, potentially reducing the number of unique identifications. Addressing this concern, an alternative strategy for fragmentation of phosphopeptides has been proposed and made available on current instrumentation, referred to as Multistage Activation (MSA) or “Pseudo MSn” (29). With MSA, the neutral loss product ion in the MS2 spectrum is activated and fragmented without an additional isolation cycle. The product ions of the neutral loss fragment, along with the initial MS2 product ions, are trapped together resulting in a composite spectrum. This methodology has shown improved search scores by automated search algorithms, such as Mascot (30), over conventional MS2 equivalents. This, ideally, would translate into a higher number of peptide identifications at any given scoring threshold (29).
One consequence of the MS3 methodology discussed above is that the downstream informatics processing of MS3 spectra requires additional consideration. These informatics processing methods are often not equivalent to those used for processing MS2 spectra alone. The first issue is one of redundancy: MS2 and MS3 spectra are typically derived from the same peptide and generate matches to identical peptides using database searching tools. The resulting matches must be integrated together in some manner in final reports (25). Another issue is that the measured precursor masses associated with MS3 spectra will not always correspond to the masses of appropriate database peptides calculated using the same rules that are applied in the case of MS2 spectra. For example, in phosphopeptide analyses variable modifications of −18 Da due to loss of phosphoric acid from S or T residues may need to be specified for MS3 spectra, while the normal +80 Da phosphorylation modification on S, T, and Y are used for MS2. In the past, this often prompted workflows in which MS2 and MS3 spectra were processed separately, since it is computationally inefficient, and an unnecessary source of false positive identifications, to perform a combined search which permits both the −18 Da loss for MS3 spectra and the +80 Da addition for MS2 spectra. When using search tools that consider fragment ions with phosphate neutral loss (e.g. Mascot), this issue can be circumvented by replacing the precursor mass of the MS3 spectrum with that of the precursor selected and isolated in the initial stage full-scan mass spectrum. This replacement allows both levels of spectra to be searched together. Moreover, any MS3 spectrum generated from a peptide in which amino acids are lost in addition to the phosphate moiety during the first stage of fragmentation, requires the search to be conducted in a semi-tryptic manner. This is due to the loss of one tryptic termini which also requires searching for internal ion masses. Some search platforms may find this problematic: internal ion searching is permitted by Mascot, for example, but not by SEQUEST or X! Tandem. Also, semi-tryptic searching may be time-prohibitive as it is computationally intensive.
These considerations have led several investigators to develop their own algorithms for handling MS3 spectra. Olsen and Mann described a custom scoring algorithm for MS3 spectra: their final score for a peptide is the product of the Mascot-generated MS2 probability and a custom MS3 score, implemented in a modified version of their MSQUANT software (20). Hoffert et al. developed a framework called PhosphoPIC that processes SEQUEST results of phosphopeptide-enriched samples to allow more effective filtering and post-search compilation of the data (24). In addition to standard database peptide sequence searching, methods for computing a score associated with the localization of phosphorylation on the peptide have been published. Beausoleil et al. describe a probability score indicative of whether the specific site of phosphorylation can be localized to a particular residue (31). Ruttenberg et al. implement a more sophisticated scoring model for localizing sites of phosphorylation in their PhosphoScore algorithm (32)
In our previous publication (25), in the context of discussing a custom MS2/MS3 data processing methodology, an initial assessment of the merits of generating MS3 spectra was performed. An MS2-only methodology was compared to an approach of generating MS3 spectra on a phosphopeptide-enriched sample (25). Initial results indicated that generating MS3 spectra may indeed result in fewer unique peptide identifications. However, there was evidence that the number of unique sites of phosphorylation increased as a result of using a MS3 methodology. The goal of this extension of work is to address this issue more precisely and to add to the comparison the newer MSA methodology. Overall, we seek to provide evidence as to whether a particular methodology for analyzing phosphopeptide data performs significantly better than another, both in terms of the number and quality of identifications. In as equivalent a manner as possible, we compare three approaches: an MS2-only methodology, an MS2/MS3 methodology, and an MSA methodology, using an LTQ-FT mass spectrometer. All methods were run in triplicate using two phosphopeptide-enriched samples: an S. cerevisiae cytosolic protein extract affinity purified using titanium dioxide, and a D. melanogaster protein extract enriched with IMAC. The primary criterion for comparing methodologies is the number of unique peptide identifications. We also examine the effect of the method on the determination of the site of modification as well as whether there is an effect on the fragment ion mass accuracy. For MS2/MS3 data, we also compare several different informatics methods for interpretation of the resulting spectra.
EXPERIMENTAL METHODS
Sample Preparation
Two sample preparations were used in this study. For the primary analysis, S. cerevisiae wild type (BY7092: can1::STE2pr-Sp_his5 lyp1Delta his3Delta leu2Delta ura3Delta met15Delta) was grown to OD ~ 0.8 at 30°C in synthetic defined (SD) medium (per liter 1.7 g YNB, 5 g ammonium sulfate, 2 % glucose, 0.03 g isoleucine, 0.15 g valine, 0.04 g adenine, 0.02 g arginine, 0.1 g leucine, 0.03 g lysine, 0.02 g methionine, 0.05 g phenylalanine, 0.2 g threonine, 0.02 g histidine, 0.02 g tryptophane, 0.03 g tyrosine, 0.02 g uracil, 0.1 g glutamic acid and 0.1 g aspartic acid were used). Cells were harvested at 30°C by centrifugation. They were then washed once in SD medium, and after collection by centrifugation were shock frozen in liquid nitrogen. Pellets were thawed in ice cold lysis buffer (20 mM TrisHCl pH 8.0, 100 mM KCl, 10 mM EDTA, 0.1 % NP40, 20 nM calyculin A, 200 nM okadaic acid, 4.8 μm cypermethrin (all bought from Merck KGaA, Darmstadt, Germany), 2 mM vanadate, 10 mM sodium pyrophosphate and 10 mM NaF) using 1 ml of lysis buffer per gram of yeast. Yeast were lysed by glass bead beating (acid washed glass beads were used). Starting with roughly 2 mg of material, phosphopeptides were isolated after a tryptic digest of the protein using titanium dioxide affinity purification as previously published (33). A total peptide amount of 1 μg after isolation was divided into nine equal samples, 2 μg each, with triplicate replicate samples run on the instrument for each of the three mass spectrometry methods described in the next section.
To address sample complexity effects, a secondary sample was utilized: a trypsin-digested, IMAC-enriched cytosolic protein extract from Drosophila melanogaster Kc167 cells. The preparation of the samples is described in detail in (33). Again, a pre-isolation amount of 2 mg yielding a final total peptide amount of 1 μg post-isolation was divided into nine equal samples, with triplicate replicate samples run on the instrument for each of the three mass spectrometry methods.
Mass spectrometry
Chromatography and mass spectrometry methodologies were completed as previously described in (33), except that an LTQ-FT (ThermoFischer Scientific, Bremen, Germany) and a linear gradient from 2 % to 25% acetonitrile over 90 minutes was utilized.
Three mass spectrometry methodologies are explored in this study: a standard MS2-only methodology (abbreviated as “MS2” in this document), a Multistage Activation (MSA) methodology, and a method which generates both MS2 and data-dependent MS3 spectra (abbreviated “MS2+3”). For the MS2 methodology, all peptide precursor ions eluting from the column were detected by the Fourier transform (FT) analyzer. Fragmentation of the precursor and detection of the product ions occurred in the linear trap in a data dependent manner for the top six ions provided the precursor exceeded a threshold of 500 ion counts. MSA is a standard option (the instrument software Xcalibur version 1.4 or later) for all linear ion trap instruments from Thermo Electron Corporation such as the LTQ, LTQ-FT, and LTQ-Orbitrap. For the MSA methodology, precursor scanning was also completed in the FT while subsequent fragmentation and detection occurred in the LT. During fragmentation, if a phosphate neutral loss of 98, 49, 32.66 and 24.5 m/z below the precursor ion mass was detected there was an additional activation as described in (29) of all four neutral loss m/z values. This MSA event was repeated for the top five ions in a data dependent manner provided the precursor exceeded a threshold of 500 ion counts. Finally, for the MS2/MS3 method, the first and second scan events were analogous to the MS2 method. However, an additional subsequent scan event, an MS3 spectrum, was obtained in the event that a phosphate neutral loss (−98 Da for singly, −49 Da for doubly and −32.7 Da for triply and −24.5 Da for quadruply charged peptides) was detected in the MS2 spectra. This MS2/MS3 experiment was completed for the top three precursor peptide ions. A threshold of 200 and 50 ion counts was used for triggering an MS2 and MS3 scan event, respectively. Wideband activation was enabled for all MS2 and MS3 scan events. The isolation width for selecting an MS2 ion from the MS1 precursor scan was set to 2 m/z and an isolation width of 4 m/z for selecting the neutral loss ion in an MS2 scan for MS3 was used.
A profile of spectral counts for each of the nine instrument runs is shown in Table 1. Charge state could be determined with accuracy due to the high mass resolution of the FT. Singly-charged peaklists were excluded from further analysis in the extraction phase because of their high false positive likelihood and are not shown in the figure. Note that spectra with charge states greater than eight are not considered by Mascot, the primary search engine used in this study. Also, PeptideProphet does not analyze 6+ or higher assignments.
Table 1. Spectra counts for the MS2, MSA, and MS2+3 datasets.
The final term in the filename specifies the type of run: MS2 for MS2-only, MSA for Multistage Activation, and MS3 for MS2/MS3 runs. Columns indicating the number of spectra of each precursor charge state are indicated; designations such as ‘373/15’ represent the number of MS2/MS3 spectra of that charge state. Singly-charged peaklists were excluded from the analysis.
| Run | Total Spectra | MS2 | MS3 | MSA | charge +2 | charge +3 | charge +4 | charge +5 | charge >= +6 |
|---|---|---|---|---|---|---|---|---|---|
| MS2_1 | 6800 | 6800 | - | - | 3555 | 2738 | 473 | 29 | 4 |
| MS2_2 | 6956 | 6956 | - | - | 3684 | 2794 | 433 | 38 | 6 |
| MS2_3 | 7003 | 7003 | - | - | 3709 | 2790 | 462 | 34 | 7 |
|
| |||||||||
| MSA_1 | 5654 | - | - | 5654 | 2888 | 2328 | 409 | 27 | 2 |
| MSA_2 | 5800 | - | - | 5800 | 3047 | 2337 | 385 | 28 | 3 |
| MSA_3 | 5737 | - | - | 5737 | 2970 | 2352 | 385 | 27 | 3 |
|
| |||||||||
| MS2+3_1 | 8199 | 4779 | 3420 | - | 2390/1752 | 2022/1444 | 344/213 | 21/4 | 2/0 |
| MS2+3_2 | 8348 | 4908 | 3440 | - | 2480/1788 | 2042/1437 | 354/209 | 30/6 | 2/0 |
| MS2+3_3 | 8213 | 4813 | 3400 | - | 2417/1764 | 2043/1430 | 329/203 | 24/3 | 0/0 |
Database Searching and Results Analysis
MzXML files were generated from binary ThermoFinnigan *.raw files using the ReAdW tool available in the Trans-Proteomic Pipeline (TPP) v. 3.5 suite of programs (34–36). Peaklist files in *. dta format were extracted from the mzXML files using mzxml2search tool: for MS2/MS3 runs, the -M option was used to extract MS2 and MS3 peaklists separately1. The database used to search the yeast samples was an export of yeast sequences from the NCBI non redundant protein database, downloaded Dec 2007. The file consisted of 11081 sequences to which the reversed set of sequences was appended for a total of 22162 forward/reversed entries. The database for the fly samples consisted of all D. melanogaster sequences exported from the UniProt database (37), 26311 entries total, to which the reversed set of sequences was appended. Peaklists were searched using Mascot with parameters for the MS2, MSA and sum MS2/MS3 (described below) spectra as follows: peptide tolerance of 50 ppm, fragment ion tolerance of 0.8 Da; full trypsin digestion, two possible missed cleavages; fixed carbamidomethyl modification of 57.02 for Cysteine; variable modifications of +80 Da for Ser, Thr, and Tyr, and +16 Da for Met. The instrument type was set to ESI-TRAP; this is significant in that it determines the types of ions that Mascot utilizes for scoring. However, the ESI-TRAP setting does not calculate internal ions. A comparison of the performance of this instrument setting with a setting that utilizes internal ions showed that the latter significantly degraded the quality of search results (data not shown).
Two approaches for database searching of MS2/MS3 spectra were utilized in this work: 1) MS3 spectra were searched simultaneously with MS2 spectra, utilizing the MS2 precursor mass (see below). The resulting MS2 and MS3 peptide assignments were processed post-database search using the method described in (25), which pairs consecutive MS2 and MS3 spectra and adjusts the probability scores of both spectra based on whether the sequence assignments of these spectra match. 2) Sum spectra were assembled from individual MS2 and MS3 peaklists (see below) and searched with Mascot using the same set of search conditions. MSA spectra are composite spectra containing MS2 fragment ions as well as ions generated by activating several neutral loss product ions from the initial MS2 event. These spectra required no special processing to search with Mascot.2
Search results generated by Mascot in the *. dat format were converted to pepxml format using the TPP mascot2xml program. The results were then analyzed using PeptideProphet (35), resulting in a probability score for each spectrum. PeptideProphet was run with the “−A” option (high mass accuracy data) and “−l” option, which results in alternate processing of peptides having high homology score (no penalty applied in PeptideProphet) which often occurs for phosphopeptides when the specific site of phosphorylation is ambiguous. ProteinProphet (36) was also run on the pepxml result files from PeptideProphet for each of the MS2, MSA, and MS2+3 cases, combining results of the three replicate experiments for each method type for a total of three final result sets at the protein level.
MS3 precursor mass replacement
The current version of the Thermo Electron instrument software has an option of replacing the precursor mass of the MS3 spectrum with that of the precursor selected and isolated in the initial stage full-scan mass spectrum, the precursor mass of the MS2 spectrum. This allows both levels of spectra to be searched together using the standard +80 Da phosphopeptide variable modification, provided the search engine incorporates fragment ions with a neutral loss of phosphoric acid in the scoring function. These neutral losses are considered by the Mascot search tool used in this work.
The MS3 precursor ion replacement method is illustrated in Figure 1 using a toy model of fragmentation of the theoretical phosphopeptide MLLS[+80]LK. If the isolated MS3 precursor ion mass is utilized for database searching, a −18 Da shift would be required for correct identification of the peptide in the database. By utilizing the MS2 precursor mass, and allowing a +80 Da shift on S as a variable modification, the peptide would be identified as phosphorylated (+80 Da on S), with the relevant peaks in the spectrum labeled as fragment ions with −98 Da neutral loss (y3-p, y4-p, and y5-p in this example).
Figure 1. MS3 precursor mass replacement.

A toy fragmentation model of the theoretical phosphopeptide MLLS[+80]LK ([M+H]+ = 784 Da). Only y-ions are shown for clarity. Calculated peaks are +1 charge, and peak intensity is arbitrary. a) Precursor spectrum (MS1). b) MS2 spectrum, with a dominant neutral loss peak in red. c) MS3 spectrum corresponding to the fragmentation of the 686 Da neutral loss peak. Database search with the MS3 precursor mass, −18 Da shift on S as a variable modification. Observed peaks are labeled as y ions. d) MS3 spectrum, database search with precursor mass replacement (MS2 precursor mass), +80 Da shift on S residue as a variable modification. Peaks corresponding to fragment ions containing S residue are labeled as y-p ions: y3-p, y4-p, and y5-p (p: − 98 Da neutral loss).
Sum MS2/MS3 spectra
Sum spectra were assembled by first extracting MS2 and MS3 peaklists separately from a raw data file, keeping track of the MS level of each scan. The scan numbers of the peaklists were then examined to identify consecutive MS2/MS3 pairs, as described in (25). Consecutive spectra were then merged as follows: first, the intensities of peaks in the two spectra were normalized by comparing the base peak intensity of each spectrum, adjusting the MS3 peak intensities to match MS2 levels. Then a new peaklist was constructed composed of peaks from the individual spectra. If two peaks from the MS2 and the MS3 spectra were within a specified tolerance of each other (0.4 Da for all data presented here), the peaks were combined by adding the intensities. A single m/z value - the value from the most intense of the two original peaks - was used in the sum spectrum for the peak.
A note on terminology: for the remainder of this manuscript, the terms MS2 and MS3 will be used when referring generally to spectra of these types, and MS2 and MS2+3 when referring to the specific datasets produced by the MS2-only and MS2/MS3 methodologies discussed in this manuscript. Individual replicates of each method will be labeled with an underscore and number, e.g. MS2_1, MS2_2, MSA_1, MS2+3_1, etc.
Phosphopeptide site localization score
Recently, Beausoleil et al. (31), described an algorithm that computes a probability of phosphorylation being localized to a specific site on a peptide, called an Ascore3. For this work, a custom version of this algorithm was implemented in the Python programming language. At the time this work was being performed, openly available versions of phosphopeptide localization scoring algorithms such as PhosphoScore (32) were not available. There are several differences between our implementation and the published version of Ascore. Most importantly for this work, our implementation allows the calculation of a score for MS3 spectra, a feature not supported in the online version of the Ascore algorithm provided by the Gygi lab. Also, the published implementation calculates multiple scores for multiply-phosphorylated peptides, whereas our version only reports the highest scoring permutation. Thirdly, our custom implementation produces slightly different scores than the published version, likely due to differences in the assignment of labels to ions in the spectrum. We note that the algorithm has not been extensively tested using standardized or synthetic data sets as has been done with other implementations (31, 32). However, the relative ranking of scores produced by our algorithm should be valid. Given that the use of our implementation is for comparative purposes, specifically to determine if the MS methodologies differ in their ability to localize sites of modification, we believe it is a valid and useful representation of the algorithm.
It should also be noted that the localization calculations do not utilize the ion assignments used by Mascot for generating a score for a peptide assignment. Our localization score calculation takes as input a peaklist and the corresponding peptide sequence assigned by Mascot. The algorithm calculates theoretical fragmentation masses based on the peptide sequence. Fragment masses are assigned to a peak in the spectrum if a calculated fragment mass is within a user-defined threshold of that peak (the fragment mass tolerance used in the Mascot search, 0.8 Da, was used for these data). The theoretical fragmentation calculations are done using custom Python modules which are themselves based largely on a Python library written by the UCSD computational mass spectrometry group, freely available as part of the InsPecT search platform4 (38).
RESULTS AND DISCUSSIONS
Phosphopeptide example
Figure 2 illustrates an example of each of these three methodologies - MS2, MSA, MS2+3 - analyzing the same phosphopeptide, WIpSKDDYTWEK. Shown in Figure 1a is the full scan MS2 spectrum obtained in a double stage methodology (MS2). The normalized abundance (normalized to the dominant peak) of this spectrum is 2.01×10³. Clearly abundant is the doubly charged phospho-neutral loss precursor ion (726.92 m/z). However, observed within the lower abundance ions are the y-ion (6 of 10 ions) and b-ion (3 of 10) series representing the primary sequence of the peptide. Also shown is one b-H3PO4 ion (labeled as b-p). Figure 1b shows the full scan MS3 spectrum obtained in a triple stage methodology. The normalized abundance is 2.86×101, approximately two orders of magnitude less than the MS2 scan. There is no real predominant peak useful for establishing a background noise threshold. Ions clearly visible are the y-ion (5 of 10 ions) and b-ion (1 of 10) series representing the primary sequence. Four b-H3PO4 ions are readily observable in this scan, adding confidence over the MS2 spectrum in the localization of the phosphate moiety. Figure 1c shows the MSA spectrum with a normalized intensity of 7.18×10², a 35% decrease from the MS2 scan. More information is readily distinguishable in this spectrum as there is no predominant neutral loss precursor ion. Both the y-ion (6 of 10 ions) and b-ion (8 of 10) series representing the primary sequence, plus 6 b- H3PO4 ions are observed, which offers the most confident localization information regarding the phosphate moiety. In total, 10 fragment ions were seen in both the MS2 and MS3 spectra, indicating that there may not be any advantage to either methodology for the determination of primary sequence and localization of the phosphate moiety. In contrast, there were 20 ions clearly identified in the MSA spectrum for this peptide indicating that the MSA methodology may provide an improved ability to identify both the primary sequence and the site of localization of the phosphate moiety in some instances. Often however, equivalent peaks are also available in the MS2 spectra as data distinguishable by an automated algorithm, even if they appear to occur at lower signal-to-noise levels upon observation. Thus, even though MSA and MS3 spectra may appear to contain richer fragmentation in certain examples, the only way to really determine if a methodology provides a significant advantage is to examine a large dataset.
Figure 2. Direct comparison of MS methodology on phosphopeptide WIpSKDDYTWEK.
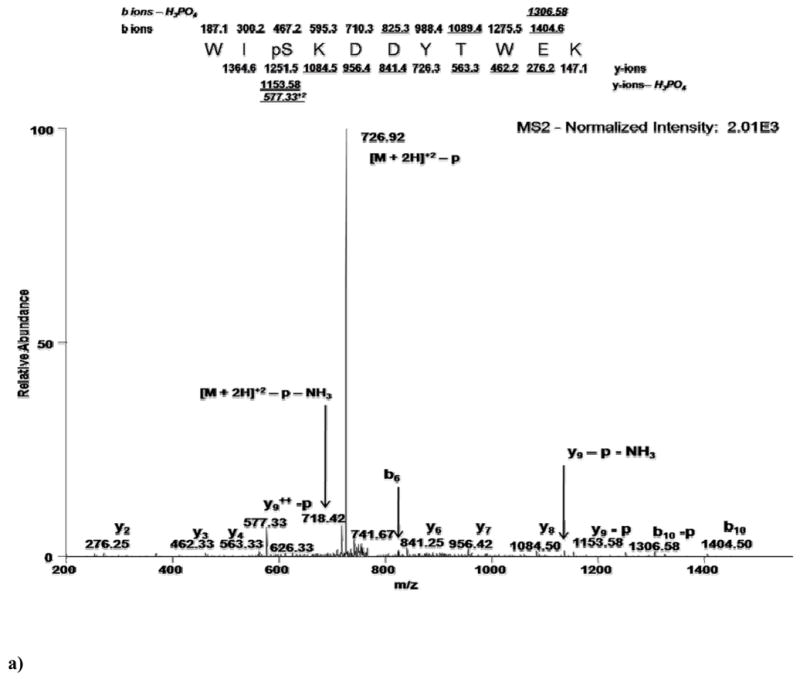
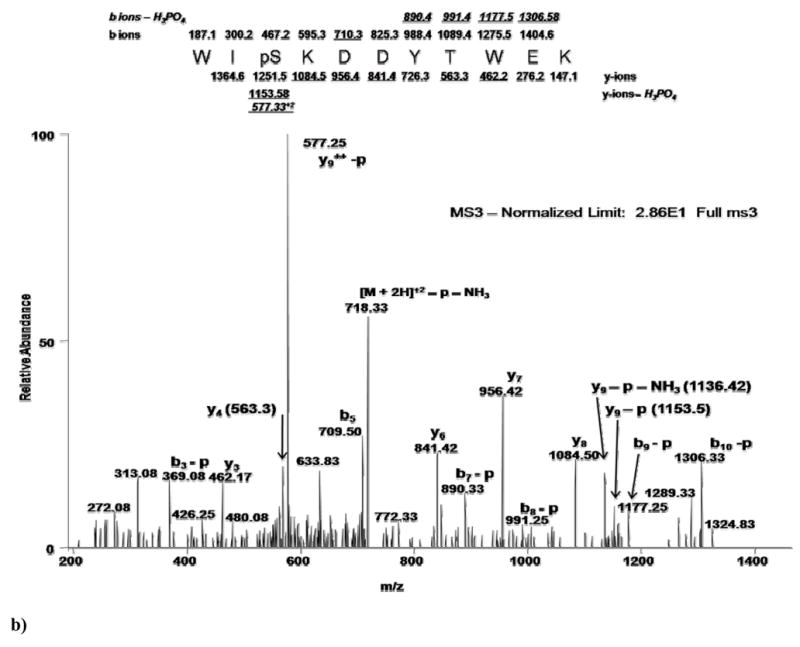
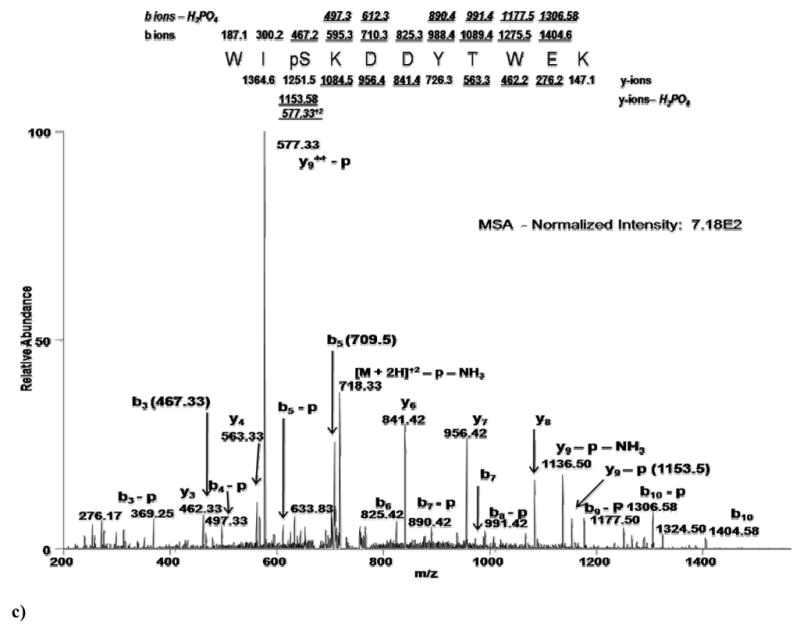
a)Full-scan MS2 spectrum indicating predominant neutral loss precursor ion. Lower abundant sequence ions are identified as annotated. b) Full-scan MS3 spectrum obtained in a neutral loss triple stage methodology showing a two order of magnitude loss of intensity. Annotated are sequence ions that may or may not have been obtained in the MS2 spectra. c) Full-scan MSA spectrum showing only a 35% loss of intensity compared with the MS2 spectra, but showing an increased number of sequence ions vs. both MS2 and MS3 spectra. Fragment ions observed in MS3 and MSA spectra are labeled with respect to the precursor ion selected for MS2 fragmentation.
Comparison of the number of identifications
Neutral loss-triggered data generation reduces the number of MS2 scan events in an experimental run. We sought to determine whether this reduction results in a corresponding loss in the number of unique peptide identifications. Figure 3 shows the total number of unique peptide identifications for each of the nine instrument runs on the yeast samples. Unique matches here are defined by primary peptide sequence; i.e. peptides are considered unique only if their sequences differ, and two peptides with the same sequence but differing in their modification state are not considered unique in Figure 3. Peptides were selected at a 5% FDR as determined by the decoy database method (39) based on PeptideProphet probability scores5. Overall, the MSA methodologies produced more unique identifications than the other two methodologies, 6% more than the MS2 methodology and 12% more than the MS2+3. The overall pattern for the drosophila replicates was similar but with a reduced number of identifications by the MS2+3 method: MSA in the drosophila data set generated 7% more unique identifications than MS2 and 23% more than MS2+3 (Supplemental Figure 1). These results confirm that MS2 spectra contain a significant amount of the fragmentation information useful for peptide sequence identification via a standard search tool. Most interesting, the MSA approach, generating the fewest overall spectra of all three methods, produced the most unique identifications.
Figure 3. Number of unique peptide identified in each yeast dataset.

The instrument method is indicated in the dataset name: MS2-only (MS2), MSA, or the MS2/MS3 (MS2+3) methodology. Peptide identifications are filtered to achieve a 0.05 FDR.
The identifications listed in Figure 3 for the three MS2+3 replicates were calculated based on ‘unadjusted’ PeptideProphet probabilities. As described in Experimental Procedures, however, several computational methods exist for further refining the identifications from MS2+3 spectra to make efficient use of the information obtainable by coupling consecutive MS2 and MS3 spectral pairs. Utilizing these computational methods results in an increase in the number of unique identifications obtainable from the MS2+3 data sets. Results for the processing of these data are reported for two different techniques, one after database searching while the other prior to database searching. For the first, the probability scores for consecutive matching pairs were adjusted and then combined into a single score using the heuristic 1-(1-PMS2)(1-PMS3), where PMS2 and PMS3 are the adjusted probabilities of the MS2 and MS3 spectra, respectively (notated “MS2+3comb”) (25). For the second technique, a summed MS2/MS3 spectrum was created for consecutive matching pairs (“MS2+3sum”). Figure 4 compares the number of unique peptide identifications obtained in the three yeast MS2+3 runs using these two approaches with the unadjusted MS2+3 scores. The three replicate runs MS2+3_1, MS2+3_2, and MS2+3_3 are shown in the figure shaded by method. The two alternate processing methods produce a modest performance increase over the standard, individually reported MS2 and MS3 equivalents, resulting in more identifications at the 5% FDR threshold. The MS2+3comb method yielded 81 more identifications (2.3%) than the unadjusted MS2+3 results, whereas summing consecutive MS2 and MS3 spectra pairs in the yeast dataset resulted in 17 more unique identifications. For the drosophila data, the MS2+3comb method produced a gain of 143 high probability peptide assignments (6.9%), while the MS2+3sum method resulted in a slight decrease in the number of identifications: 27 (1.3%). Although the MS2+3comb method requires additional computation and bookkeeping, it is generally more successful than the sum method. We note, however, that the method of summation used here is somewhat simplistic, and methods that more intelligently produce summed spectra may give better results (41).
Figure 4. Comparison of MS2/MS3 data processing methodologies.

Data are shown for the two replicate runs for which MS3 spectra were generated (run IDs 10192 and 10193). Results from two alternative refinements, the combined 1-(1-PMS2)(1-PMS3) probability score (“MS2+3comb”), and summation spectra (labeled “MS2+3sum”), are compared with the results obtained by straightforward combination of MS2 and MS3-database search results.
A more precise comparison between methods may be obtained by taking into account the modification state of a peptide. An expanded summary of counts of peptides identified by all of the methods is shown in Table 2 for the yeast samples, including counts for the number of phosphorylated peptides identified. The total number of spectra generated by each method is shown as well as the number of total and unique peptide identifications identified at a 5% FDR. A difference between this summary and the prior figures, Figs. 3 and 4, is that peptides identified as having sufficient evidence for localization were counted as unique. To determine this, a localization score for every identified phosphopeptide was calculated retaining the highest localization score for a peptide identified by multiple spectra. The score of 19 is used as the threshold above which a phosphopeptide can be considered localized with high confidence, a value suggested in the original Ascore publication; we note, however, that this number is somewhat arbitrary and may vary from dataset to dataset. Phosphopeptides that have the same primary amino acid sequence, yet have different site(s) of phosphorylation that are above the localization score threshold, are considered unique peptides (Table 2). Otherwise, only the primary amino acid sequence for the peptide is considered. However, the modified sequences of phosphopeptides meeting these criteria are considered unique for the purposes of counting, thus allowing the possibility of several forms of a modified peptide given strong evidence.
Table 2. Summary of yeast peptide identification counts for all methods.
The total number of spectra generated for each experiment are shown, as well as total and unique peptides identified at 0.02 FDR. The Utility measure provides the ratio of unique peptide identifications to total spectra. The Phospho Peptides column lists the number of unique peptides above threshold that are phosphopeptides. Localized Phosphos list the number of the phosphopeptides identified as having a localization score ≥ 19.0.
| Run_ID | Total Spectra | Total Peptides | Unique Peptides | Utility | Phospho Peptides | 1 P-mod | 2+ P-mods | Localized Phosphos |
|---|---|---|---|---|---|---|---|---|
| MS2_1 | 6800 | 2642 | 1439 | 0.212 | 1331 | 1010 | 321 | 563 |
| MS2_2 | 6956 | 2671 | 1385 | 0.199 | 1286 | 982 | 304 | 568 |
| MS2_2 | 7003 | 2699 | 1364 | 0.195 | 1264 | 969 | 295 | 572 |
|
| ||||||||
| MSA_1 | 5654 | 2487 | 1492 | 0.264 | 1394 | 1003 | 391 | 589 |
| MSA_2 | 5800 | 2512 | 1504 | 0.259 | 1407 | 1008 | 399 | 599 |
| MSA_3 | 5737 | 2470 | 1491 | 0.260 | 1399 | 1009 | 390 | 593 |
|
| ||||||||
| MS2+3_1 | 8199 | 7035 | 1310 | 0.160 | 1229 | 901 | 328 | 524 |
| MS2+3_2 | 8348 | 7109 | 1426 | 0.171 | 1345 | 987 | 358 | 571 |
| MS2+3_3 | 8213 | 6987 | 1295 | 0.158 | 1214 | 877 | 337 | 526 |
|
| ||||||||
| MS2+3sum_1 | 4779 | 2155 | 1281 | 0.268 | 1199 | 889 | 310 | 500 |
| MS2+3sum_2 | 4908 | 2274 | 1392 | 0.284 | 1310 | 969 | 341 | 550 |
| MS2+3sum_3 | 4813 | 2175 | 1315 | 0.273 | 1231 | 893 | 338 | 534 |
|
| ||||||||
| MS2+3comb_1 | 8199 | 7035 | 1341 | 0.164 | 1257 | 912 | 345 | 501 |
| MS2+3comb_2 | 8348 | 7109 | 1430 | 0.171 | 1345 | 985 | 360 | 547 |
| MS2+3comb_3 | 8213 | 6987 | 1268 | 0.154 | 1190 | 864 | 326 | 500 |
The number of phosphopeptide identifications in these data indicates a high degree of enrichment, confirming the results for the method described in (33). Again, the MSA results produced the greatest number of unique peptide identifications, 7% more than MS2 and 11% more than the MS2+3 method. Restricting the results to phosphorylated peptide forms, MSA produced 8% more than MS2 and 11% more than the unadjusted MS2+3 method. The MSA performance may be partially attributed to the fact that MSA appears to offer an improvement in the ability to localize a site of phosphorylation, producing a 5% increase in the number of confidently localized identifications than the MS2 method and a 10–15% increase over the MS2+3 methods. The result confirms the expectation that an MSA spectrum can theoretically contain fragment ions from multiple neutral loss ions whereas the MS2+3 methods contain fragmentation data from at most a pair of MS2 and MS3 events. This may be significant for multiply-phosphorylated peptides that exhibit losses of more than one moiety. Consider, for instance, the case of a doubly-charged phosphopeptide with two phosphorylation sites. In such a case, peaks corresponding to a loss of −49 Da (the first phosphate) and −98 Da (both phosphates) will both be fragmented since the neutral loss mass list of −98, −49, −32.7, and −24.5 was specified in the instrument method. Table 2 also indicates the number of unique phosphorylated peptides that are singly- vs. multiply-phosphorylated. On average, the MSA and MS2+3 neutral loss methods identify more multiply-phosphorylated peptides. The average ratio of multiply-phosphorylated spectra out of the total phosphorylated peptides identified by all three replicates for each method are 24%, 27%, and 28% for MS2, MS2+3, and MSA, respectively. Furthermore, although MSA identified only about 6% percent more peptides in total than MS2, the increase of multiply-phosphorylated peptides was 28%. The fact that the MSA and MS2+3 methods identify more multiply-phosphorylated forms is again likely a reflection of the fact that additional peptide fragmentation information is available in neutral loss-derived data. Overall, MSA should provide an advantage over both other methods in that these spectra can theoretically contain information available on more than one neutral loss event in the same spectra, as commonly occurs in multiply-phosphorylated peptides.
Lastly, a new statistic is also displayed in Table 2, the ratio of Unique peptides identified to Total spectra generated: a U/T or “Utility” ratio. This ratio can be considered a simple measure of spectra quality. The MS2+3sum and MSA spectra produce the highest scores for this statistic, a reflection of the increase in information resulting from a combination of activation events.
Unique protein and peptide identifications for combined datasets
The performance of the methods was then compared at the protein level. One of the difficulties associated with enriched phosphopeptide samples is that due to the simplified nature of the mixture, often only one peptide is identified per protein (so-called “one hit wonders”). As a result, selection criteria for allowing peptide and protein identifications in the data set often require modification. To obtain a higher degree of coverage and to reduce instrument sampling rate effects, all three replicates for each method were merged utilizing the ProteinProphet tool (36). ProteinProphet clusters protein identifications into protein groups based on the underlying peptide identifications, generating a probability for each protein group. Each group ideally represents a unique protein identification, reflecting the fact that there is often insufficient information to distinguish between various isoforms of a protein or protein family (42). All identified groups for a given methodology were ranked by probability score, and the list was filtered to achieve a stringent 0.02 FDR as estimated using the decoy method. Based on the information obtained in this clustering, ProteinProphet then produces adjusted probability scores for peptides associated with these protein groups, called the NSP-adjusted probability (36). The NSP-adjusted probability reflects the increase in confidence in peptides that have other “siblings” contributing to a protein identification (‘NSP’ = ‘number of sibling pairs’). It has been demonstrated that peptide scores which have been adjusted based on protein-level information can be more discriminative (36), a fact that is now utilized in the scoring frameworks of other tools, e.g. ProteinPilot (43).
As shown in Figure 5, peptide identification differences between replicates are significant. As such, a number of replicates can often be run in standard proteomics LC and MS methodologies before ‘saturating’ the potential number of identifications in a sample (44). The figure shows Venn diagrams comparing identifications at the peptide and protein levels for the MSA replicates; MS2 and MS2+3 plots are similar (data not shown). All peptides with NSP-adjusted probabilities >= 0.50 corresponding to the selected proteins (protein-level FDR of 0.02) were included. Peptides were considered as unique based on primary sequence. Again, modified forms of phosphopeptides were considered as unique if their localization scores passed the 19.0 significance threshold. The figures indicate that many peptides (65–68%) are identified in all replicates, but with a significant number of identifications unique to a single replicate (12–15%). These ratios are reflected in the protein identifications as well, with 8–12% of the identifications unique to each replicate and a roughly identical fraction of proteins identified in all replicates.
Figure 5. Comparison of replicate experiments using the MSA method.

Area-proportional Venn diagrams of the three replicates of the yeast sample are shown for both the peptide (a) and protein (b) levels. Proteins represent protein group with probability scores calculated by ProteinProphet and passing a 0.02 FDR threshold. Peptide identifications are included for all selected proteins if the peptide NSP-adjusted probability scores are equal or greater than 0.5.
Figure 6 compares the combined results of all three replicates for each of the MS2, MSA, and MS2+3 methodologies at both the peptide and protein levels. For MS2+3 data, the combined probability adjustment results (MS2+3comb) are shown. The number of total unique identifications produced by each of the methods is compared in the diagrams for both yeast (Panels a and b), and drosophila (Panels c and d) samples. For yeast, when replicates are combined, the total number of unique identifications can be seen to be roughly equivalent between MS2 and MSA while MS2+3 produced 10% fewer identifications than the other two methods. The overall result is perhaps surprising in that, taken individually, all three MSA replicates produced significantly more unique identifications at the peptide level than both the MS2 and MS2+3 methods (see Figure 3 and Table 2). This suggests that the effect of combining replicates, and the use of protein-level information (NSP) to adjust peptide scores, results in normalization of the data. Further, the figures show a large degree of overlap in identifications between the three methods. There is a 71% concordance of the MS2 and MSA peptides, and 79% concordance of the MS2+3 peptides. The peptide identifications translate into a roughly equivalent number of protein identifications for MS2 and MSA - 734 and 737, respectively - with MS2+3 producing 7% fewer (683) protein identifications (Figure 6b).
Figure 6. Comparison of protein and peptide identifications for combined datasets.

Venn diagrams of the three primary run methodologies are compared for combined yeast (Panels a and b, top) and drosophila (Panels c and d, bottom) samples. The figures compare unique peptide assignments (left panel) and protein identifications (right panel). Total counts for all areas corresponding to each dataset are shown in parentheses. Proteins are selected based on an estimated FDR of 0.05. Peptides are included for all significant proteins if their NSP adjusted probability scores are equal or greater than 0.5. Venn diagrams are not area-proportional.
The result is slightly different for the drosophila samples. As indicated in 6c, MSA produced 10% and 12% more peptide identifications than MS2 and MS2+3, respectively. 13% of unique peptide identifications were identified by the MSA method only, as compared to 10% and 9% for MS2 and MS2+3comb. There was a total of 46% of the peptide identifications identified by all three methods. This is lower than the 55% for yeast. At the protein level, this translates to a 12% and 11% increase in identifications of MSA over MS2 and MS2+3comb, respectively. MS2+3comb actually performs similarly to MS2 at the protein level in the fly data, yielding seven more protein identifications.
Overall, it is thought that differences between these methods can be largely attributed to the sampling rate of the instrument. However, some of the difference in the number of identifications produced by each of the methods reflects a method advantage. When replicates are combined, the runs for which MSA was utilized perform either equivalently or better than the other methods in terms of the number of unique identifications. The MS2+3 method does not appear to afford any significant advantage. The overall result, however, may be a function of sample complexity in that identification ‘saturation’ can be expected to be achieved with fewer replicates for a simpler sample, especially at the protein level. As such, improvements from using MSA or MS2+3 may be less obvious in these data for yeast than drosophila.
Effect of methodology on phosphorylation site localization
In addition to the total number of identifications, the methodologies were compared to see if there is a difference in their ability to localize a site of modification. Such a difference might be reflected in a shift in the localization score between the methods. To investigate this, binned localization score values were plotted for the combined results of each individual method. The results are plotted in Figure 7 for the yeast data.
Figure 7. Localization score histograms for individual run methods.

Data shown are for yeast. Each bin value represents the total percent of all peptide identifications in that bin range for the corresponding method. The distributions are calculated using only unique phosphopeptides identified by all three methodologies.
To generate the figure, counts between methods were normalized to 1 to display relative bin size. The MS2+3sum method produced the largest fraction of peptides in the 19+ bin amongst the MS2+3 methods, and was thus chosen for comparison to MS2, MSA, and the unadjusted MS2+3. The overall results are very similar in all methods. MSA produces a roughly equivalent fraction of significant (19+) localization scores as MS2. The MS2+3 methods show a small skew towards lower localization score values, which is improved in the sum spectra.
Table 3 shows statistics for the various ion types assigned to all high-scoring (>=0.95 probability) peptides for each method. Although an optimal peak depth is used in the calculation of the localization score as described in (31), the peak depth was fixed at four to generate the results given in the table (peak depth indicates the number of top peaks selected per 100 Da window for the purposes of scoring). Ions were assigned to peaks in a ranked order based on their likelihood, such that a peak identified by a more likely ion type would not be replaced by a less likely one. Note that even though all these ion types were annotated, not all were utilized in the calculation of the localization score; the localization score was calculated solely using singly- and doubly-charged y and b ions and p (98 Da) and p′ (80 Da) losses. The table indicates that all methods are roughly similar in the types of ions generated, except there was an increase in the percentage of ions attributed to phosphate loss (98 Da) in the neutral-loss triggered MS3 spectra for both yeast and fly. Any difference in localizing a site of modification does not appear to be dramatically dependent on selection of a particular set of ions. The ion percentages in the table were calculated for peptides identified by all methods; the identical percentages calculated using all ions for a given method shows very little variation (data not shown). Also note that Table 3 labels fragment ions observed in MS3 spectra with respect to the precursor ion selected for MS2 fragmentation (i.e., in the MS3 spectrum example shown in Figure 1, observed peaks would contribute 2 counts to y ion category and 3 counts to y-p ion category).
Table 3. Ion statistics for confident peptide identifications by sample and methodology.
Rows indicate ion types. The numbers indicate the percentage of total assigned peaks for each method that were labeled as the given type. MS2, MSA, and MS3 spectra were taken from the MS2_1, MSA_1, and MS2+3_1 runs for yeast, and MS2_3, MSA_3, and MS2+3_3 runs for drosophila. Ion types are sorted alphabetically. A 2 or a 3 after an ion type indicates the charge of the ion; −p indicates a 98 Da neutral loss and −p′ a loss of 80 Da. M-p is a label given to the precursor neutral loss peak. Percentages for the MS3 spectra were generated from the unadjusted probability results. Peptides with probability ≥ 0.95 were used to generate statistics.
| Yeast | Fly | |||||
|---|---|---|---|---|---|---|
| Ion | MS2 | MSA | MS3 | MS2 | MSA | MS3 |
| M-p | 1.89 | 0.13 | 0.27 | 1.77 | 0.12 | 0.24 |
| a | 0.91 | 0.9 | 1.02 | 0.81 | 0.89 | 1.39 |
| a-h2o | 1.09 | 1.14 | 1.46 | 1.07 | 1.01 | 1.17 |
| a-nh3 | 0.89 | 1.08 | 1.12 | 1.01 | 1.07 | 1.26 |
| b | 17.49 | 16.99 | 10.85 | 17.63 | 17.36 | 8.78 |
| b-h2o | 4.53 | 4.43 | 2.29 | 4.55 | 4.22 | 1.39 |
| b-h2o-h2o | 0 | 0 | 0 | 0.05 | 0.03 | 0 |
| b-h2o-nh3 | 0.01 | 0.01 | 0 | 0.02 | 0.04 | 0 |
| b-nh3 | 3.83 | 3.66 | 1.93 | 3.46 | 3.3 | 1.51 |
| b-p | 7.91 | 8.71 | 12.38 | 8.98 | 9.98 | 14.31 |
| b-p′ | 1.1 | 1.27 | 2.09 | 1.14 | 1.18 | 2.38 |
| b2 | 5.76 | 5.84 | 3.62 | 5.28 | 5.21 | 2.67 |
| b2-h2o | 0.01 | 0 | 0 | 0 | 0.02 | 0 |
| b2-nh3 | 0.04 | 0.05 | 0 | 0.06 | 0.11 | 0 |
| b2-nh3-h2o | 0.02 | 0.01 | 0 | 0.02 | 0.03 | 0 |
| b2-p | 2.03 | 2.2 | 3.77 | 1.68 | 1.69 | 2.67 |
| b2-p′ | 1.24 | 1.2 | 1.79 | 1.13 | 1.21 | 1.88 |
| b3 | 1.29 | 1.29 | 1.88 | 1.28 | 1.23 | 1.66 |
| y | 24.31 | 24.15 | 18.84 | 25.13 | 24.85 | 23.51 |
| y-h2o | 3.68 | 3.88 | 3.38 | 3.8 | 3.97 | 4.24 |
| y-nh3 | 1.64 | 1.9 | 1.94 | 1.67 | 1.64 | 2.09 |
| y-p | 3.82 | 4.95 | 11.44 | 3.1 | 3.87 | 8.67 |
| y-p′ | 0.62 | 0.72 | 0.92 | 0.54 | 0.59 | 0.46 |
| y2 | 8.03 | 7.33 | 6.25 | 8.25 | 8.11 | 6.06 |
| y2-h2o | 0.01 | 0.01 | 0 | 0.01 | 0.03 | 0 |
| y2-nh3 | 0.04 | 0.04 | 0 | 0.05 | 0.08 | 0 |
| y2-nh3-h2o | 0.05 | 0.07 | 0 | 0.05 | 0.08 | 0 |
| y2-p | 4.78 | 4.92 | 8.52 | 4.6 | 5.2 | 10.63 |
| y2-p′ | 1.44 | 1.45 | 1.83 | 1.17 | 1.2 | 1.37 |
| y3 | 1.41 | 1.59 | 2.34 | 1.68 | 1.61 | 1.65 |
Effect of method on fragment ion mass accuracy
As a last comparative measure, peptide assignments were queried to detect any difference in fragment ion mass accuracy that may occur between the different methods. To perform this comparison, 100 high-scoring peptides identified by all three of MS2, MSA, and MS2+3 methodologies in yeast were examined. The root mean square (RMS) error as reported by Mascot for each peptide assignment was manually recorded (this number is available in the Peptide View page of an individual result) and plotted, shown in Figure 8. This number represents the overall RMS error for all theoretical assignments to peaks in the experimental tandem mass spectrum. Detection of these ions occurs in the linear trap (LTQ) of the instrument, not in the FT detector. As noted earlier, database searches were performed both with and without internal ions; the inclusion of internal ions resulted in a significant increase in the average RMS error rate, not unexpected given the high rate of false peak assignments for these ions. Results reported in this figure do not include internal ion masses in the mass error calculation. For the sake of visual clarity, only MS2 and MSA results are shown.
Figure 8. Mass accuracy of fragment ion assignments from MS2 and MSA methodologies.

Results for individual peptides are sorted on the horizontal axis by increasing peptide length. The vertical axis shows the RMS mass error in ppm of theoretical fragment ion matches to the experimental spectra produced by MS2 (blue) and MSA (red) spectra. Linear regression curves are fit to the data for each method, shown as dashed lines.
The RMS error results are matched vertically by instrument method for each of the individual unique peptide sequences and sorted by increasing peptide length along the x-axis. For instance, for Peptide ID #1, the blue circle (identification from an MS2 spectrum) and red square (MSA) for the seven-mer sequenced peptide DVpSISDR is shown clustered together around 650 ppm RMS. This peptide had a calculated RMS mass error of 538, 624 and 785 ppm for MS2, MSA, and MS3 spectra, respectively. The last data points along the x-axis represent a peptide of length forty amino acids, which produced a calculated RMS mass error of 266, 272, and 281 ppm for each of the methods, respectively.
These two examples show MS2 methodology as having better fragment ion mass accuracy than both MSA and MS2+3 methodologies. This overall trend is apparent in the linear regression curves and indicates that MS2 spectra have an overall better mass accuracy while the MSA spectra have an overall worse mass accuracy than the other two methods. However, the difference is not significant. As can be seen from the figure, MSA identifications are roughly 10 ppm worse than MS2 spectra over much of the range of these different peptide lengths, a small fraction compared to the average RMS of several hundred ppm. As the overall length of the peptide increases, the overall mass accuracy for each of the methods improves while the divergence between the MSA method in comparison with MS2 and MS2+3 increases. We believe this to be suggestive of a normalization effect that occurs as the length of the peptide sequence, and thus the number of identified ions, increases. This overall trend of MSA having a slightly worse mass accuracy than the other methods is interesting: one might expect this effect specifically due to space charge effects within the ion trap. During MSA analysis, relative to MS2 and MS2+3, the ion trap is left open longer without interludes of evacuation. Therefore, the greater number of ions collected in the MSA method compared with MS2 and MS2+3 would increase space charge effects and thus decrease mass accuracy.
CONCLUSIONS
In this work, complex phosphopeptide-enriched samples from two organisms, yeast and drosophila, were analyzed in replicate using several different data acquisition strategies available on the current generation mass spectrometers such as the LTQ-FT. Out of the three methodologies discussed, the MSA method performed as well as, or better than, the MS2 method. When counting phosphopeptides only, MSA produced on average 12% more than MS2 and 6% more than unadjusted MS2+3 in the yeast data. The MS2+3 method also produced more unique phosphopeptide identifications than MS2, although the total number of unique peptide identifications was smaller. In terms of phosphorylation site localization MS2, MSA, and MS2+3 methods performed similarly, and the three computational strategies for processing of MS2+3 data (simple combination, probability-based combination, and spectral summation prior to database search) performed roughly equivalently. For these data, site localization does not appear to be a distinguishing characteristic of the methods. The MSA spectra were found to have a slightly increased overall fragment mass error likely due to space charge effects in the ion trap. However, this increase is insignificant given the range of fragment ion mass tolerances typically used in database searching. In general, MSA produced the fewest number of spectra but generated the largest fraction of successfully identified spectra. The average MSA spectrum contains a higher number of identifiable peaks, and higher information content, than the average MS2 or MS3 spectra.
Although the MS2+3 strategies performed sub-optimally as compared to the other two methods on these data in terms of the overall number of peptide identifications (more so in yeast than in drosophila), it would be misleading to conclude that the generation of MS3 data is unwarranted. An MS3 spectrum can provide a confirming identification for a peptide for a borderline MS2 phosphopeptide spectrum, and in situations that permit manual curation they can provide additional useful structural information. Also, MSA may not be available on all instrumentation. MS2+3 methodologies can function as a reasonable alternative to this approach, generating more unique phosphopeptide identifications than an MS2-only method. From the practical point of view, MSA spectra are simpler to utilize in that they do not require non-standard database searching or additional MS2/MS3 combination approaches and bookkeeping. Thus, MSA was found to be an optimal methodology, at least for the automated processing pipeline described in this work. Future work might extend the analysis presented here to mass spectrometry data generated on a wider range of biological samples, using different phosphopeptide enrichment protocols, instrument control settings, and computational data processing strategies.
DATA AVAILABILITY
Original data generated by the LTQ-FT for each of the samples (in MzXML format) have been uploaded to the Tranche system6 under the following hash key: yClOaDgebQWNyFmhEGXzPYjq24+ERA49457S8OyAhA6vJubMzxdh3QqBrxqOySZTuaY37wKYT QNOda0xbhEm314dME0AAAAAAAAReg==
Acknowledgments
This work was supported in part by NIH/NCI Grant CA-126239 to AIN, NIH/NCRR - National Resource for Proteomics and Pathways Grant #P41-18627 to PCA, and with funds from NIH/NHLBI under contract No. N01-HV-28179 to RA. Bernd Bodenmiller was the recipient of a fellowship by the Boehringer Ingelheim Fonds. We thank the UCSD Computati onal Research Group for the free availability of the InsPecT python library, and Karl Clauser (Broad Institute) and Feng Yang (PNNL) for their insightful comments.
Abbreviations
- CID
Collision-Induced Dissociation
- LC
Liquid Chromatography
- MS/MS
Tandem Mass Spectrometry
- MSA
Multistage Activation
- PTM
Post-Translational Modification
- FDR
False Discovery Rate
Footnotes
Note that some other commonly used tools, e.g. X! Tandem and SEQUEST (versions prior to BioWorks 3.2), do not consider fragment ions with phosphate neutral loss. When using these tools, MS2 and MS3 spectra need to be searched separately, and searching MSA and sum MS2/MS3 spectra would produce suboptimal results.
FDR at the peptide and protein level can also be estimated from probabilities computed by PeptideProphet and ProteinProphet (40). However, since the accuracy of the computed probabilities in the case of combined multistage data has not been extensively tested, direct decoy based FDR estimates are used.
References
- 1.Hunter T. Signaling--2000 and beyond. Cell. 2000;100:113–27. doi: 10.1016/s0092-8674(00)81688-8. [DOI] [PubMed] [Google Scholar]
- 2.Cohen P. The regulation of protein function by multisite phosphorylation– a 25 year update. Trends Biochem Sci. 2000;25:596–601. doi: 10.1016/s0968-0004(00)01712-6. [DOI] [PubMed] [Google Scholar]
- 3.Manning G, Whyte DB, Martinez R, Hunter T, Sudarsanam S. The protein kinase complement of the human genome. Science. 2002;298:1912–34. doi: 10.1126/science.1075762. [DOI] [PubMed] [Google Scholar]
- 4.Caenepeel S, Charydczak G, Sudarsanam S, Hunter T, Manning G. The mouse kinome: discovery and comparative genomics of all mouse protein kinases. Proc Natl Acad Sci U S A. 2004;101:11707–12. doi: 10.1073/pnas.0306880101. [DOI] [PMC free article] [PubMed] [Google Scholar]
- 5.Kersten B, Agrawal GK, Iwahashi H, Rakwal R. Plant phosphoproteomics: a long road ahead. Proteomics. 2006;6:5517–28. doi: 10.1002/pmic.200600232. [DOI] [PubMed] [Google Scholar]
- 6.Mackay HJ, Twelves CJ. Targeting the protein kinase C family: are we there yet? Nat Rev Cancer. 2007;7:554–62. doi: 10.1038/nrc2168. [DOI] [PubMed] [Google Scholar]
- 7.Rikova K, et al. Global survey of phosphotyrosine signaling identifies oncogenic kinases in lung cancer. Cell. 2007;131:1190–203. doi: 10.1016/j.cell.2007.11.025. [DOI] [PubMed] [Google Scholar]
- 8.Guo A, et al. Signaling networks assembled by oncogenic EGFR and c-Met. Proc Natl Acad Sci U S A. 2008;105:692–7. doi: 10.1073/pnas.0707270105. [DOI] [PMC free article] [PubMed] [Google Scholar]
- 9.Mazanetz MP, Fischer PM. Untangling tau hyperphosphorylation in drug design for neurodegenerative diseases. Nat Rev Drug Discov. 2007;6:464–79. doi: 10.1038/nrd2111. [DOI] [PubMed] [Google Scholar]
- 10.Hoffert JD, Knepper MA. Taking aim at shotgun phosphoproteomics. Anal Biochem. 2008;375:1–10. doi: 10.1016/j.ab.2007.11.023. [DOI] [PMC free article] [PubMed] [Google Scholar]
- 11.Witze ES, Old WM, Resing KA, Ahn NG. Mapping protein post-translational modifications with mass spectrometry. Nat Methods. 2007;4:798–806. doi: 10.1038/nmeth1100. [DOI] [PubMed] [Google Scholar]
- 12.Ptacek J, Snyder M. Charging it up: global analysis of protein phosphorylation. Trends Genet. 2006;22:545–54. doi: 10.1016/j.tig.2006.08.005. [DOI] [PubMed] [Google Scholar]
- 13.Pflieger D, Jünger M, Müller M, Rinner O, Lee H, Gehrig P, Gstaiger M, Aebersold R. Quantitative proteomic analysis of protein complexes: Concurrent identification of interactors and their state of phosphorylation. Mol Cell Proteomics. 2007;7:326–346. doi: 10.1074/mcp.M700282-MCP200. [DOI] [PubMed] [Google Scholar]
- 14.Bodenmiller B, Mueller LN, Pedrioli PGA, Pflieger D, Jünger MA, Eng J, Aebersold R, Tao WA. An integrated chemical, mass spectrometric and computational strategy for (quantitative) phosphoproteomics: Application to Drosophila melanogaster Kc167 Cells. Molecular BioSystems. 2007;3:275–286. doi: 10.1039/b617545g. [DOI] [PubMed] [Google Scholar]
- 15.Villén J, Beausoleil SA, Gerber SA, Gygi SP. Large-scale phosphorylation analysis of mouse liver. Proc Natl Acad Sci U S A. 2007;104:1488–93. doi: 10.1073/pnas.0609836104. [DOI] [PMC free article] [PubMed] [Google Scholar]
- 16.Gruhler A, Olsen JV, Mohammed S, Mortensen P, Faergeman NJ, Mann M, Jensen ON. Quantitative phosphoproteomics applied to the yeast pheromone signaling pathway. Mol Cell Proteomics. 2005;4:310–327. doi: 10.1074/mcp.M400219-MCP200. [DOI] [PubMed] [Google Scholar]
- 17.Ballif BA, Villén J, Beausoleil SA, Schwartz D, Gygi SP. Phosphoproteomic analysis of the developing mouse brain. Mol Cell Proteomics. 2004;3:1093–1101. doi: 10.1074/mcp.M400085-MCP200. [DOI] [PubMed] [Google Scholar]
- 18.Ficarro SB, McCleland ML, Stukenberg PT, Burke DJ, Ross MM, Shabanowitz J, Hunt DF, White FM. Phosphoproteome analysis by mass spectrometry and its application to Saccharomyces cerevisae. Nat Biotech. 2002;20:301–305. doi: 10.1038/nbt0302-301. [DOI] [PubMed] [Google Scholar]
- 19.Tholey A, Reed J, Lehmann WD. Electrospray tandem mass spectrometric studies of phosphopeptides and phosphopeptide analogues. J Mass Spectrom. 1999;34:117–23. doi: 10.1002/(SICI)1096-9888(199902)34:2<117::AID-JMS769>3.0.CO;2-V. [DOI] [PubMed] [Google Scholar]
- 20.Olsen JV, Mann M. Improved peptide identification in proteomics by two consecutive stages of mass spectrometric fragmentation. Proc Natl Acad Sci U S A. 2004;101:13417–13422. doi: 10.1073/pnas.0405549101. [DOI] [PMC free article] [PubMed] [Google Scholar]
- 21.Beausoleil SA, Jedrychowski M, Schwartz D, Elias JE, Villen J, Li J, Cohn MA, Cantley LC, Gygi SP. Large-scale characterization of HeLa cell nuclear phosphoproteins. Proc Natl Acad Sci U S A. 2004;101:12130–12135. doi: 10.1073/pnas.0404720101. [DOI] [PMC free article] [PubMed] [Google Scholar]
- 22.Olsen JV, Blagoev B, Gnad F, Macek B, Kumar C, Mortensen P, Mann M. Global, in vivo, and site-specific phosphorylation dynamics in signaling networks. Cell. 2006;127:635–48. doi: 10.1016/j.cell.2006.09.026. [DOI] [PubMed] [Google Scholar]
- 23.Macek B, Mijakovic I, Olsen JV, Gnad F, Kumar C, Jensen PR, Mann M. The serine/threonine/tyrosine phosphoproteome of the model bacterium Bacillus subtilis. Mol Cell Proteomics. 2007;6:697–707. doi: 10.1074/mcp.M600464-MCP200. [DOI] [PubMed] [Google Scholar]
- 24.Hoffert JD, Wang G, Pisitkun T, Shen RF, Knepper MA. An automated platform for analysis of phosphoproteomic datasets: application to kidney collecting duct phosphoproteins. J Proteome Res. 2007;6:3501–8. doi: 10.1021/PR0701153. [DOI] [PMC free article] [PubMed] [Google Scholar]
- 25.Ulintz PJ, Bodenmiller B, Andrews PC, Aebersold R, Nesvizhskii AI. Investigating MS2-MS3 matching statistics: A model for coupling consecutive stage mass spectrometry data for increased peptide identification confidence. Mol Cell Proteomics. 2008;7:71–87. doi: 10.1074/mcp.M700128-MCP200. [DOI] [PubMed] [Google Scholar]
- 26.Wu J, Shakey Q, Liu W, Schuller A, Follettie MT. Global profiling of phosphopeptides by titania affinity enrichment. J Proteome Res. 2007;6:4684–9. doi: 10.1021/pr070481m. [DOI] [PubMed] [Google Scholar]
- 27.Palumbo AM, Tepe JJ, Reid GE. Mechanistic Insights into the Multistage Gas-Phase Fragmentation Behavior of Phosphoserine- and Phosphothreonine-Containing Peptides. J Proteome Res. 2008;7:771–9. doi: 10.1021/pr0705136. [DOI] [PubMed] [Google Scholar]
- 28.Li X, Gerber SA, Rudner AD, Beausoleil SA, Haas W, Villén J, Elias JE, Gygi SP. Large-scale phosphorylation analysis of alpha-factor-arrested Saccharomyces cerevisiae. J Proteome Res. 2007;6:1190–7. doi: 10.1021/pr060559j. [DOI] [PubMed] [Google Scholar]
- 29.Schroeder MJ, Shabanowitz J, Schwartz JC, Hunt DF, Coon JJ. A neutral loss activation method for improved phosphopeptide sequence analysis by quadrupole ion trap mass spectrometry. Anal Chem. 2004;76:3590–8. doi: 10.1021/ac0497104. [DOI] [PubMed] [Google Scholar]
- 30.Perkins DN, Pappin DJ, Creasy DM, Cottrell JS. Probability-based protein identification by searching sequence databases using mass spectrometry data. Electrophoresis. 1999;20:3551–67. doi: 10.1002/(SICI)1522-2683(19991201)20:18<3551::AID-ELPS3551>3.0.CO;2-2. [DOI] [PubMed] [Google Scholar]
- 31.Beausoleil SA, Villén J, Gerber SA, Rush J, Gygi SP. A probability-based approach for high-throughput protein phosphorylation analysis and site localization. Nat Biotechnol. 2006;24:1285–92. doi: 10.1038/nbt1240. [DOI] [PubMed] [Google Scholar]; 32 Bodenmiller B, Mueller LN, Mueller M, Domon B, Aebersold R. Reproducible isolation of distinct, overlapping segments of the phosphoproteome. Nature Methods. 2007;4:231–237. doi: 10.1038/nmeth1005. [DOI] [PubMed] [Google Scholar]
- 32.Ruttenberg BE, Pisitkun T, Knepper MA, Hoffert JD. PhosphoScore: An Open-Source Phosphorylation Site Assignment Tool for MSn Data. J Proteome Res. 2008;7:3054–9. doi: 10.1021/pr800169k. [DOI] [PMC free article] [PubMed] [Google Scholar]
- 33.Bodenmiller B, Mueller LN, Mueller M, Domon B, Aebersold R. Reproducible isolation of distinct, overlapping segments of the phosphoproteome. Nature Methods. 2007;4:231–7. doi: 10.1038/nmeth1005. [DOI] [PubMed] [Google Scholar]
- 34.Keller A, Eng J, Zhang N, Li XJ, Aebersold R. A uniform proteomics MS/MS analysis platform utilizing open XML file formats. Mol Syst Biol. 2005;1:2005.0017. doi: 10.1038/msb4100024. [DOI] [PMC free article] [PubMed] [Google Scholar]
- 35.Keller A, Nesvizhskii AI, Kolker E, Aebersold R. Empirical statistical model to estimate the accuracy of peptide identifications made by MS/MS and database search. Anal Chem. 2002;74:5383–5392. doi: 10.1021/ac025747h. [DOI] [PubMed] [Google Scholar]
- 36.Nesvizhskii AI, Keller A, Kolker E, Aebersold R. A statistical model for identifying proteins by tandem mass spectrometry. Anal Chem. 2003;75:4646–4658. doi: 10.1021/ac0341261. [DOI] [PubMed] [Google Scholar]
- 37.Bairoch A, et al. The Universal Protein Resource (UniProt) Nucleic Acids Res. 2005;33:D154–159. doi: 10.1093/nar/gki070. [DOI] [PMC free article] [PubMed] [Google Scholar]
- 38.Tanner S, Shu H, Frank A, Wang L, Zandi E, Mumby M, Pevzner PA, Bafna V. InsPecT: Fast and accurate identification of post-translationally modified peptides from tandem mass spectra. Anal Chem. 2005;77:4626–39. doi: 10.1021/ac050102d. [DOI] [PubMed] [Google Scholar]
- 39.Elias JE, Gygi SP. Target-decoy search strategy for increased confidence in large-scale protein identifications by mass spectrometry. Nat Methods. 2007;4:207–14. doi: 10.1038/nmeth1019. [DOI] [PubMed] [Google Scholar]
- 40.Choi H, Nesvizhskii AI. False discovery rates and related statistical concepts in mass spectrometry-based proteomics. J Proteome Res. 2008;7:47–50. doi: 10.1021/pr700747q. [DOI] [PubMed] [Google Scholar]
- 41.Monigatti F, Sreen H. SALAMI (Spectrum ALignment using high Accuracy Mass and hIgh sensitivity data): how to make the best out of hybrid MS/MS data. J Proteome Res. 2008;7:1984–1993. doi: 10.1021/pr7006895. [DOI] [PubMed] [Google Scholar]
- 42.Nesvizhskii AI, Aebersold R. Interpretation of shotgun proteomic data - The protein inference problem. Mol Cell Proteomics. 2005;4:1419–1440. doi: 10.1074/mcp.R500012-MCP200. [DOI] [PubMed] [Google Scholar]
- 43.Shilov IV, Seymour SL, Patel AA, Loboda A, Tang WH, Keating SP, Hunter CL, Nuwaysir LM, Schaeffer DA. The Paragon Algorithm, a next generation search engine that uses sequence temperature values and feature probabilities to identify peptides from tandem mass spectra. Mol Cell Proteomics. 2008;6:1638–55. doi: 10.1074/mcp.T600050-MCP200. [DOI] [PubMed] [Google Scholar]
- 44.King NL, et al. Analysis of the Saccharomyces cerevisiae proteome with PeptideAtlas. Genome Biol. 2006;7:R106. doi: 10.1186/gb-2006-7-11-r106. [DOI] [PMC free article] [PubMed] [Google Scholar]
Associated Data
This section collects any data citations, data availability statements, or supplementary materials included in this article.
Data Availability Statement
Original data generated by the LTQ-FT for each of the samples (in MzXML format) have been uploaded to the Tranche system6 under the following hash key: yClOaDgebQWNyFmhEGXzPYjq24+ERA49457S8OyAhA6vJubMzxdh3QqBrxqOySZTuaY37wKYT QNOda0xbhEm314dME0AAAAAAAAReg==