Abstract
Signal inhomogeneities in MRI often appear as multiplicative weightings due to various factors such as field-inhomogeneity dependencies for steady-state free precession (SSFP) imaging or receiver sensitivities for coil arrays. These signal inhomogeneities can be reduced by combining multiple data sets with different weights. A sum-of-squares combination is typically employed due to its simplicity and near-optimal signal-to-noise ratio (SNR). However, this combination may lead to residual signal inhomogeneity. Alternatively, an optimal linear combination of the data can be performed if the weightings for individual data sets are estimated accurately. We propose a non-linear combination to improve image-based estimates of the individual weightings. The signal homogeneity can be significantly increased without compromising SNR. The improved performance of the method is demonstrated for SSFP banding artifact reduction and multi-coil (phased-array and parallel) image reconstructions.
Keywords: data combination, sensitivity estimation, SSFP, phased array, parallel imaging
Introduction
Magnetic resonance imaging (MRI) data sets can sometimes be corrupted by multiplicative weighting factors (sensitivities) in the image domain. If these weightings are known, then the resultant non-uniformities can be removed with optimal signal-to-noise ratio (SNR) (1). However, this information is usually not available, and separate sensitivity measurements can be time consuming and error-prone. A common strategy in reducing these non-uniformities has been to combine multiple data sets with different sensitivities. In certain cases, these data sets are obtained through a single acquisition, e.g., phased-arrays (1), whereas in others separate acquisitions with different parameters are needed to generate the data e.g., phase-cycled steady-state free precession (SSFP) (2, 3).
Balanced SSFP imaging (2) is of interest for a wide range of applications including coronary artery imaging (4), cardiac imaging (5), angiography (6) and musculoskeletal imaging (7) due to its contrast properties and high SNR-efficiency. SSFP induces a complex image weighting – which depends on T1, T2, off-resonant frequency and phase cycling – with respect to a reference image with center-of-pass-band SSFP contrast. Characteristic signal nulls/voids, also known as banding artifacts, are formed in regions of large field inhomogeneity.
Several data combination methods have been proposed to reduce these artifacts (8–11). The maximum-intensity (MI) (8) combination performs well only for a limited range of T1/T2 values and tip angles. On the other hand, the sum-of-squares (SOS) (9) technique achieves near-optimal SNR; however, it has sub-optimal banding removal performance. Compared to MI and SOS, weighted-combination (WC) SSFP (11) has significantly improved performance for a broad range of parameters. However, this improvement is achieved at the expense of lower SNR.
Multi-coil imaging is another application where the images are corrupted by multiplicative weighting. Receiver coil arrays can improve SNR (1,12) and accelerate the acquisitions (13–15). Sensitivity encoding (SENSE) (14) can increase imaging speed, if the coil sensitivities can be accurately measured or estimated. The aliasing in the acquired images can be unfolded by solving a least-squares problem. However, inaccuracies in the obtained sensitivities will alter tissue contrast and yield residual artifacts.
Various techniques for correcting the amplitude non-uniformity have been proposed for phased-array image reconstruction (16–19). Some of these techniques rely on a priori knowledge about the coil geometry and are thus impractical for use with flexible arrays (16, 17). On the other hand, proposed post-processing approaches are usually computationally expensive (18, 19).
For both SSFP and multi-coil imaging, the overall sensitivity of the final image depends on the individual sensitivities and the image combination method. Multiple data sets have been usually combined with the SOS method. Alternatively, the sensitivities can be estimated, and an optimal linear combination can reconstruct an image with homogeneous signal. The SOS combination can be used as a normalization factor in the estimation (20). In either case, the SOS combination can lead to amplitude modulations across the field-of-view (FOV) due to the inhomogeneity of the overall sensitivity.
In this work, we propose a new combination method that significantly increases the signal homogeneity. A pth-norm combination reduces signal non-uniformities compared with the SOS method. Although this combination suffers from a lower SNR, we can perform an optimal linear combination to compensate for the deficit. Improved sensitivity estimates are obtained from the data itself and later used to determine the combination weights. We demonstrate the method for SSFP banding artifact reduction, phased-array and self-calibrating parallel image reconstructions. In SSFP imaging, near-optimal-SNR images with reduced banding artifacts are reconstructed with center-of-pass-band SSFP contrast. In multi-coil image reconstructions, the resulting increase in signal homogeneity yields a more truthful representation of the tissue-based image contrast.
Theory
Multiple-profile Image Reconstruction
For a multiple-profile MR experiment where the data is acquired with N separate sensitivities, the signal for the ith profile is:
| (1) |
where M is the tissue-based MR signal, Si is the multiplicative sensitivity, and noise is omitted for simplicity. The SOS image,
| (2) |
has amplitude modulations apart from tissue contrast since usually varies spatially.
Another approach is to optimally combine the data after image-based estimation of the sensitivities (20). The optimal linear combination image, Popt, is:
| (3) |
where the weights (wi) are given by,
| (4) |
The sensitivities are usually estimated as:
| (5) |
where <> denotes a low-frequency image reconstructed from central k-space data. Because the coil sensitivities vary slowly in space, an initial Fourier domain truncation avoids noise amplification while only minimally degrading the spatial accuracy. Here, the denominator is assumed to represent only tissue-based contrast. In fact, the denominator contains spatial variations because it employs an SOS combination, and these variations are mistaken to be part of tissue contrast by the reconstruction.
The pth-norm combination
We propose a pth-norm combination:
| (6) |
to increase the signal homogeneity. The final power operation ensures that the original image contrast is minimally degraded. In the absence of noise, there is a value of p for which has the flattest overall profile for a given set of sensitivities.
The signal inhomogeneity yields high and low signal points for each |Si|p profile. When there is at least one profile for each pixel with a high signal contribution, the inhomogeneity can be reduced by tailoring the resulting combination to be dominated by that signal. This reduction can be achieved by using larger values of p to weight the high signal points much more heavily than the low signal points.
In other cases, transition regions, where all profiles have lower signal, may exist in between the high signal points. The signal difference between the transition regions and the high signal points have to be reduced in order to decrease the overall inhomogeneity of the combination. Therefore, smaller values of p should be used to weight the low signal points more heavily.
Improved Sensitivity Estimation
When the individual sensitivities vary slowly in space (e.g., multi-coil imaging), a pth-norm combination can simply replace the SOS expression in the denominator of Eq. 5. However, in the general case, the inverse problem is ill-conditioned due to low amplitude image points and noise. Therefore, a least-squares formulation is coupled with Tikhonov regularization of finite-differences to denoise the estimates. Given the measurements mi and a reference image Mref (assumed to represent only tissue-based contrast), the sensitivity for each acquisition (Si) is obtained by solving:
| (7) |
where Mref is the pth-norm combination, and R(Si) denotes the regularization term. which weights the error in sensitivity estimation such that background noise regions are not considered. The SOS combination (p = 2) approximately achieves the optimal SNR, if the SNR is above a certain level (1). Therefore, Pnorm – if used for image combination by itself – increases the signal homogeneity at the expense of SNR for values of p other than 2 (11). Since the sensitivity maps are denoised with the help of a regularization term, the lower SNR of the reference image minimally affects the estimates.
The obtained sensitivities can be used to determine the weights (Eq. 4) of the optimal linear combination (Eq. 3). Because the estimates are denoised, the image SNR of Popt is only minimally degraded when the pth-norm combination is used for sensitivity estimation as in Eq. 7.
Methods
SSFP Banding Artifact Reduction
In multiple-acquisition SSFP, there is at least one profile with a pass-band signal (high signal point) at each frequency. Therefore, the banding artifacts can be reduced by allowing that pass-band signal to dominate the combination. The WC-SSFP (weighted-combination) method achieves this by weighting data by a power (p) of its magnitude:
| (8) |
As p is increased banding artifact reduction improves, though at the expense of reduced SNR efficiency (11). The Pnorm combination exhibits a nearly identical response to WC-SSFP for large values of p.
To find the optimal p, Pnorm images are computed for a wide range of practical p values, (0 50]. These magnitude images are normalized such that the mean pixel intensity is unity. Finally, the least-squares variation of each image around its mean is computed. This variation descends initially as we start increasing p because the banding artifacts are further reduced. However, the artifacts cannot be completely removed, and some of the variation is due to the inherent image contrast. Therefore, the variation reaches a steady value after a certain p value. The point at which the incremental improvement falls down below 1 percent is used as the optimal p in this study.
The corresponding Pnorm combination generates a reference image with center-of-pass-band SSFP contrast. Full-resolution SSFP data can then be used to estimate the individual sensitivities. It is important to note that separate tissues have different sensitivities (due to different SSFP profiles), and this will lead to an image structure based on relaxation parameters and off-resonance in the estimates.
Simulations were performed along with phantom and in vivo studies to demonstrate the proposed method. The banding artifact reduction level of different methods were quantified by measuring the average signal ripple over a uniform area of tissue (9). A 1.5 T GE Signa Excite scanner with CV/i gradients was used in all experiments.
Simulated SSFP images of a three-layer phantom were generated with two different phase-cycling schemes (0 – 0 and 0 – 180). Off-resonant frequency was linearly varied along the layers to simulate the SSFP profile. The corresponding relaxation parameters for the three tissues were: T1/T2 = 270/85 ms for fat, 870/47 ms for muscle and 1000/200 ms for arterial blood. α = 30°, and TR/TE = 10/5 ms were assumed. Bivariate Gaussian noise was added to the data to achieve an individual SSFP image SNR of 15 for fat. Mref , SOS and Popt images were computed.
3D balanced SSFP images of three doped MnCl2 phantoms were acquired with the following parameters: α = 30°, 16 cm FOV, 0.5 × 0.5 × 2 mm3 resolution, TR/TE = 20/10 ms, 30 kHz bandwidth and four different phase-cycling schemes. The phantoms had the following relaxation parameters: T1/T2 = 1300/900, 800/375, 250/50 ms. The SSFP data were combined with the SOS method and the proposed reconstruction.
In vivo brain images were acquired with a 3D balanced SSFP sequence with the following parameters: α = 30°, 0.7 × 1.3 × 4 mm3 resolution, 384 × 192 × 16 encoding, TR/TE = 15/7.2 ms, 31.25 kHz bandwidth and two different phase-cycling schemes, and a total acquisition time of 1:32 min. SOS and Popt reconstructions were again performed on the acquired data.
Multi-coil Image Reconstruction
In multi-coil imaging, spatial locations aligned with the coil sensitivity peaks have high signal. However, there are also transition regions in between these peaks, where all coils have lower sensitivities. Therefore, using a small value of p in the Pnorm combination decreases the signal difference between the sensitivity peaks and the transition regions. In contrast with multiple-acquisition SSFP imaging, the homogeneity of the individual profiles have to be increased to improve the overall spatial homogeneity.
The aforementioned methodology used for computing the variance of SSFP images is employed. The range of p values is changed to (0 2] due to the reasons explained in the previous paragraph. In this case, however, there exists an optimal p which minimizes the variance. That value of p achieves the optimal compromise between the variance due to signal inhomogeneity and the variance due to noise amplification. Afterward, the multi-coil data are used to estimate the coil sensitivities, and an optimal linear combination is performed.
All experiments were performed on a 1.5 T GE Signa Excite scanner with CV/i gradients. To demonstrate the method in vivo, T1-weighted spin-echo brain images were acquired with an 8-channel head coil. The acquisition parameters were: α = 90°, 24 cm FOV, 0.7 × 0.7 × 4 mm3 resolution, TR = 300 ms, 31.25 kHz bandwidth, and a total of 10 slices collected in 1:43 min. The images were reconstructed as Psos, Pnorm (p = 0.5), and Popt (for p = 2 and 0.5).
If the central portion of k-space is sampled densely enough, improved coil sensitivity estimates can be obtained with the proposed method (as in Eq. 7) without the need for separate calibration scans. Afterward, these estimates can be used to perform a SENSE reconstruction. For in vivo demonstration of the method, the acquisition parameters were kept the same as the previous experiment. The only exception was the in-plane resolution, which was reduced to 1 mm. The central 1/16th portion of k-space was fully-sampled for self-calibration purposes, while the remainder was undersampled by a factor of two.
SNR Measurements
The combined multiple-profile data can have spatially nonuniform signal intensity and noise. If all acquisitions have low sensitivities within an ROI, the inherent SNR will be lower. The pth-norm combination substantially reduces the signal inhomogeneity; however, the noise component is amplified along with the signal, yielding location-dependent noise statistics. Therefore, both the signal and the background noise were measured within the same ROI.
Results
SSFP Banding Artifact Reduction
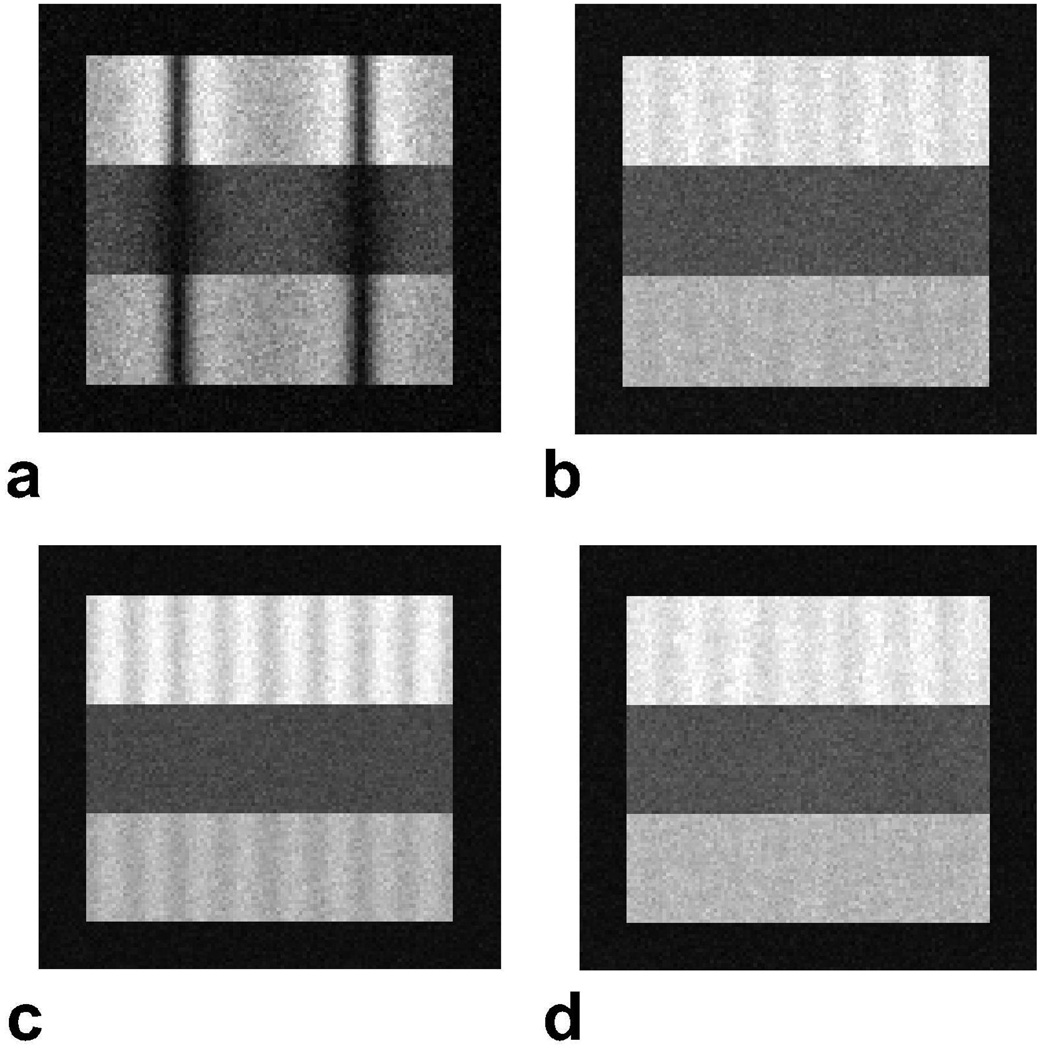
Simulated SSFP phantom images combined as Mref (p = 16.7), SOS and Popt are shown in Fig. 1 along with the single acquisition SSFP data set. The initial reference image based on Pnorm reduces banding artifacts, but has lower SNR compared to the SOS combination. The Popt combination preserves the banding reduction performance of the initial reference image and the high SNR of the SOS method (± 8 percent variation). Table 1.a lists the average ripple across the simulated phantoms. Popt significantly improves artifact reduction for fat and blood compared to the SOS combination, and the two methods perform similarly for muscle, for which the ripple is already low.
Figure 1.
a: Simulated SSFP phantom with three horizontal layers of tissues: fat, muscle and arterial blood (from top to bottom). The off-resonant frequency was varied in the horizontal direction. There are visible banding artifacts in this single acquisition SSFP image. b: The initial reference computed with Pnorm depicts reduced banding artifacts, but low SNR. Images were then reconstructed with the SOS combination (c), and the proposed method (d). The SOS image has visible ripples in the horizontal direction due to the suboptimal artifact reduction of the method. On the other hand, the proposed reconstruction successfully reduces banding artifacts in addition to achieving near-optimal SNR.
Table 1.
a: The percent signal ripple across three tissues in the field homogeneity simulated phantom images for the SOS, Mref , and Popt combinations. b: The percent signal ripple in the phantom experiment for the SOS, Mref , and Popt combinations. The phantoms A, B and C have the following T1/T2 ratios: 1300/900 (upper-right in Fig. 2), 800/375 (upper-left), 250/50 (bottom) ms.
| SOS | Mref | Popt | ||
|---|---|---|---|---|
| Fat | 17.6 | 9.0 | 9.3 | |
| Muscle | 8.0 | 9.9 | 8.1 | |
| Blood | 11.7 | 6.0 | 4.6 | |
| a | ||||
| SOS | Mref | Popt | ||
|---|---|---|---|---|
| Phant A | 13.2 | 8.8 | 9.1 | |
| Phant B | 23.6 | 18.0 | 17.7 | |
| Phant C | 12.1 | 12.9 | 11.8 | |
| b | ||||
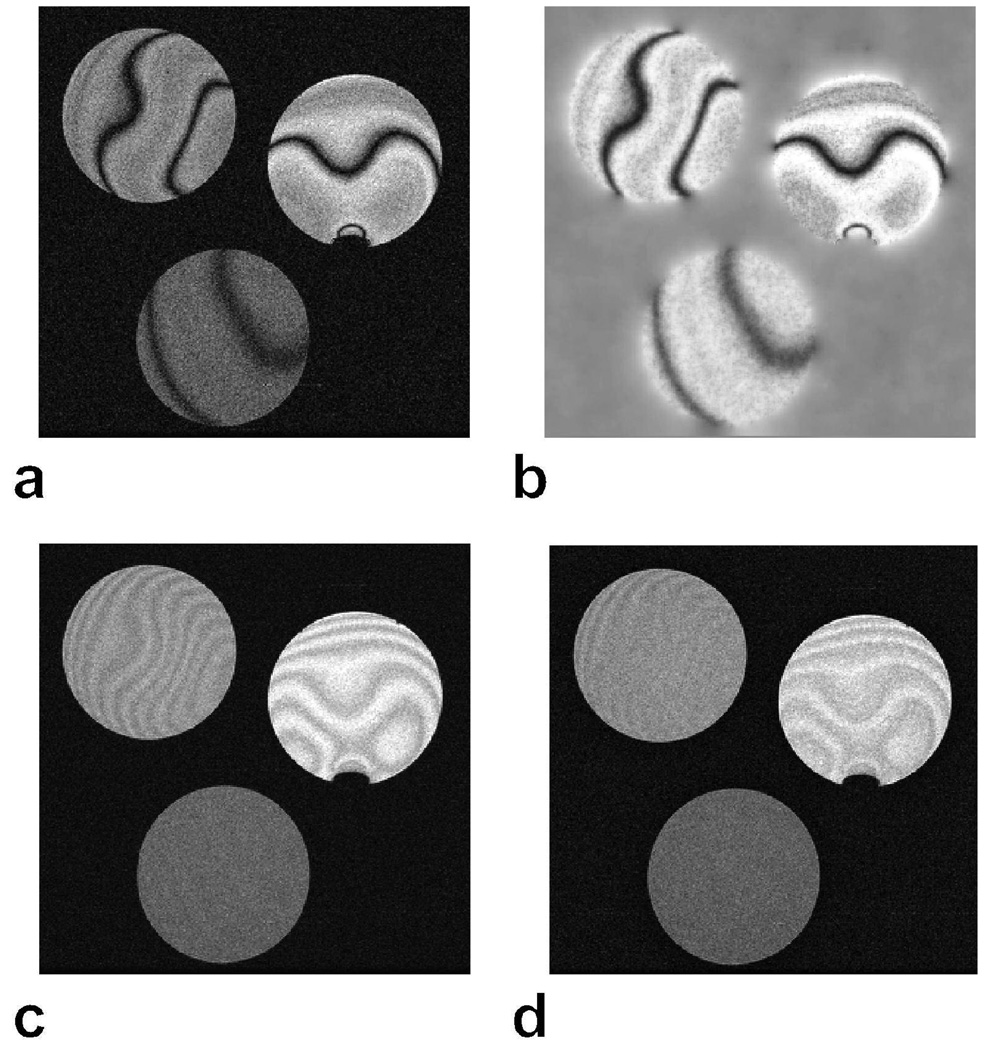
Figure 2 displays a single data set from a multiple-acquisition SSFP experiment, the corresponding sensitivity estimate, and SOS and Popt (p = 20.9) reconstructions. The ripples across the phantoms are less noticeable with the proposed reconstruction, and the resulting SNR is comparable to that of the SOS method (± 13 percent variation). Table 1.b lists the average ripple for the three phantoms with the SOS, Mref , and Popt methods. Phantom B (T1/T2 = 800/375 ms), which has the lowest T1/T2 ratio (worse banding artifacts), benefits the most from the Popt reconstruction over SOS.
Figure 2.
3D SSFP images of three phantoms with T1/T2 = 1300/900 (upper-right), 800/375 (upper-left), 250/50 (bottom) ms, were acquired with the following parameters: α = 30°, 16 cm FOV, 0.5 × 0.5 × 2 mm3 resolution, TR/TE = 20/10 ms, 30 kHz bandwidth, and four different phase-cycling schemes. A single phase-cycled SSFP acquisition (a) and the corresponding sensitivity estimate (b) are shown. The acquisitions were combined with SOS (c) and the proposed method (d). The ripples on the phantoms in the SOS image are less noticeable with the proposed reconstruction in d.
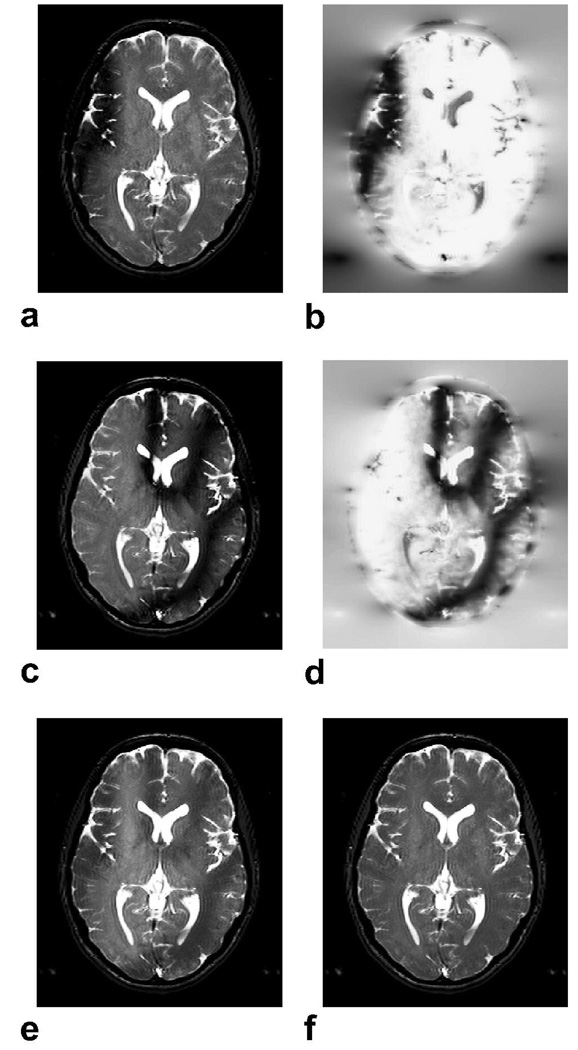
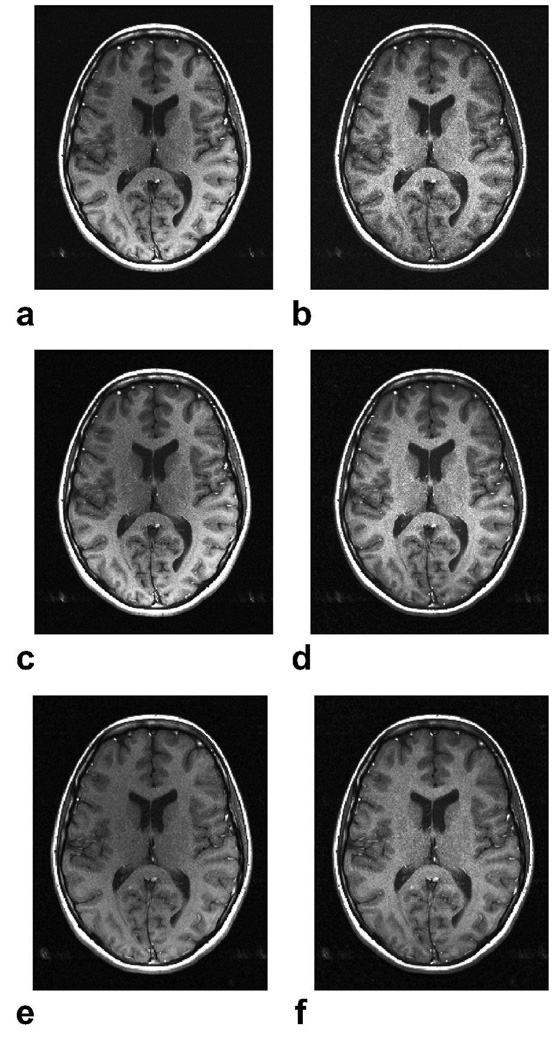
Figure 3 shows the in vivo results from 3D SSFP head scans (p = 10.5 for Popt). It is important to note that there is some inherent image structure in the sensitivity estimates because the SSFP profiles are different for separate tissues. The dark bands that are visible in the SOS reconstruction are suppressed due to the superior artifact reduction of the proposed method with minimal change in SNR (± 9 percent variation for gray matter). The average ripple in gray matter across the brain drops from 30.0 percent for SOS to 17.2 percent with the proposed reconstruction.
Figure 3.
In vivo 3D SSFP brain images were acquired with α = 30°, 0.7 × 1.3 × 4 mm3 resolution, 384 × 192 × 16 encoding, TR/TE = 15/7.2 ms, 31.25 kHz bandwidth, and two different phase-cycling schemes (0–0 and 0–180) within 1:32 min. Axial slices from the SSFP acquisitions (a,c) and the corresponding sensitivity estimates (b,d) are displayed. The acquisitions were combined with SOS (e) and the proposed method (f). Again, the proposed reconstruction achieves robust banding artifact reduction and more uniform gray/white matter signal across the brain.
Multi-coil Image Reconstruction
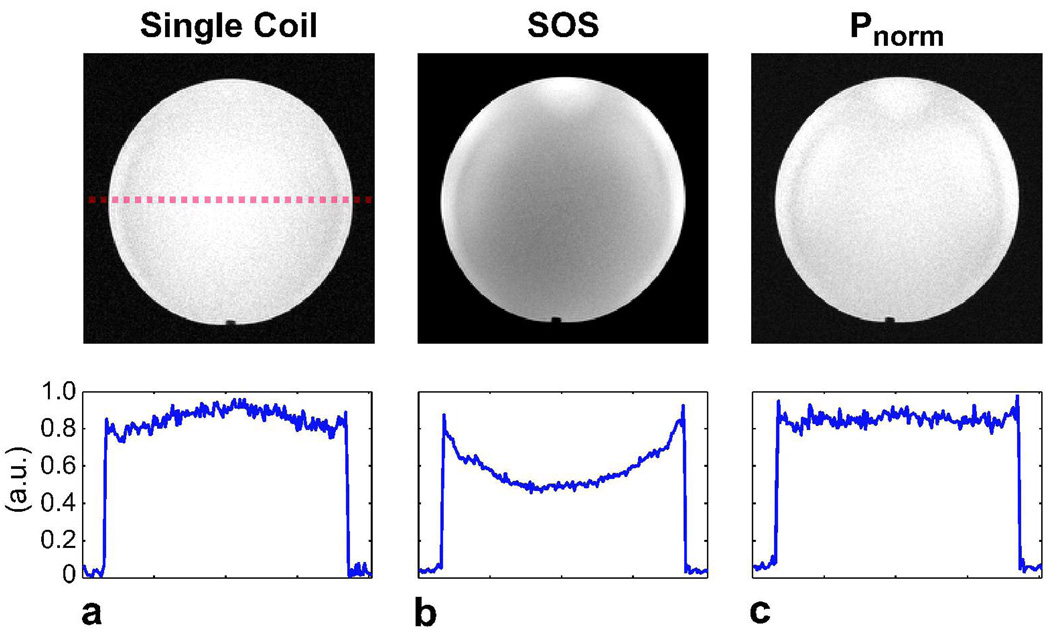
Gradient-echo images of a uniform spherical phantom were acquired with a quadrature coil and an eight-channel head coil as shown in Fig. 4. The Psos image reconstructed from the multi-coil data displays signal non-uniformity, whereas the Pnorm method achieves the uniformity of the quadrature coil image for p = 0.4. The average signal variation across the phantom is 20.8 percent for the single-coil image, 70.1 percent for Psos, and only 21.6 percent for Pnorm.
Figure 4.
a: A phantom image was acquired with a quadrature coil. For comparison, the same phantom was imaged with an 8-channel array, and b: Psos and c: Pnorm combinations were performed. While the Psos image has amplitude variations, the Pnorm combination closely matches the uniformity of the quadrature coil image. The cross-sections of the phantom images across the dashed red line are shown to demonstrate the improvement in homogeneity with Pnorm.
In vivo spin-echo brain images reconstructed as Psos and Popt (p = 2) have high SNR; however, the central part of the image is dimmer due to the array profile as shown in Fig. 5.a,c. The Pnorm image (Fig. 5.b) achieves a flatter profile and the gray/white matter signal is more uniform across the brain, but the image has reduced SNR. The Popt combination for p = 0.5 (Fig. 5.d) achieves a flat overall profile in addition to near-optimal SNR. The average signal variation across gray matter in the brain corresponding to the Psos, Popt (p = 2), Pnorm, and Popt (p = 0.5) methods are: 37.5, 38.3, 18.0, 19.6 percent. Popt (p = 0.5) also improves average gray matter SNR by 29 percent over Pnorm, 13 percent over Psos and 5.6 percent over Popt (p = 2).
Figure 5.
In vivo brain images were acquired with a spin-echo sequence and an 8-channel head coil with the following parameters: α = 90°, TR = 300 ms, 24 cm FOV, 0.7 × 0.7 × 4 mm3, 31.25 kHz bandwidth, and a total of 10 slices collected within 1:43 min. a: Psos, b: Pnorm, c: Popt (p = 2), d: Popt (p = 0.5). The Psos and Popt (p = 2) images achieve high SNR, but have coil sensitivity related amplitude modulations that affect the image contrast. On the other hand, the Pnorm method significantly increases the signal homogeneity at the expense of reduced SNR. The Popt (p = 0.5) combination both improves homogeneity and achieves near-optimal SNR as seen in d. Two-fold undersampled brain images were acquired with the same parameters, except for 1 mm in-plane resolution. The central 1/16th portion of k-space was fully sampled for calibration purposes. The SENSE reconstructions for p = 2 (e) and p = 0.5 (f) are shown. The signal homogeneity is enhanced with p = 0.5.
The SENSE reconstructions for a two-fold accelerated acquisition were computed using the sensitivities estimated according to Eq. 7 with p = 2 and p = 0.5. Figures 5.e,f demonstrate the improved flatness of the profile with p = 0.5, and the enhanced depiction of accurate image contrast. The average signal variation across gray matter is reduced from 37.8 percent (p = 2) to 20.0 percent (p = 0.5), while SNR is minimally affected (6 percent increase) with p = 0.5.
Discussion
Multiple data sets with different sensitivities can be combined with a pth-norm operation to yield an image with reduced corruption due to these sensitivities albeit with reduced SNR. However, this image can instead serve as a reference point for individual sensitivity estimation. Once accurately estimated, the sensitivities are used to determine the weights of an optimal linear combination. Thereby, a corruption-free image with near-optimal-SNR is produced by a simple reconstruction involving image-based sensitivity estimation. We have applied this technique to two important applications: banding artifact reduction in SSFP imaging and multi-coil image reconstruction.
The use of low-resolution data for estimating the SSFP sensitivities was recently proposed (21). However, the sub-optimal banding reduction of the initial MI combination and regions of fast susceptibility change hinder the performance of that method. Instead, the method presented in this paper uses full-resolution data to yield an initial banding-reduced reference image.
A potential improvement specific to SSFP sensitivity estimation is related to the regularization term in the inverse problem. Partial volume effects might lead to erroneous estimates at tissue interfaces with relatively low resolutions. In such cases, regularization based on a total variation constraint will more accurately model the data and yield improved estimates. However, significant partial volume effects were not observed for the phantom and in vivo acquisitions considered in this work.
The optimal p is determined by computing the least-squares variation of the Pnorm image around its mean. Although the accuracy of this method might be compromised in the presence of significantly high tissue-based contrast variations and noise, we did not observe such problems for the experiments considered in this work. We further determined that the least-squares variation and the overall signal homogeneity are not strong functions of p, giving a wide margin of error for the optimal p-value.
Conclusion
Multiple images acquired with different sensitivities can be combined with significantly reduced signal inhomogeneity in two straightforward steps of low computational complexity. First, the sensitivities are estimated from an initial combination with improved homogeneity. Afterward, the original data sets are linearly combined to yield near-optimal SNR, where the weights are determined from the sensitivities. The method can potentially improve the reliability of SNR and contrast-to-noise-ratio (CNR) measurements in the presence of inhomogeneous signal reception. We have demonstrated successful reduction of SSFP banding artifacts with near-optimal SNR. SSFP imaging will benefit from the use of the proposed method due to the increased immunity to field inhomogeneity. We have further applied the method to phased-array and self-calibrated parallel imaging reconstructions, yielding improved spatial homogeneity and contrast accuracy.
Acknowledgments
This work was supported by National Institutes of Health (NIH) under Grant R01 HL039297, Grant R01 HL075803 and by GE Healthcare. The work of Tolga Çukur was supported by a Rambus Corporation Stanford Graduate Fellowship.
References
- 1.Roemer PB, Edelstein WA, Hayes CE, Souza SP, Mueller OM. The NMR phased array. Magn Reson Med. 1990;16:192–225. doi: 10.1002/mrm.1910160203. [DOI] [PubMed] [Google Scholar]
- 2.Carr HY. Steady-state free precession in nuclear magnetic resonance. Phys Rev. 1958;112:1693–1701. [Google Scholar]
- 3.Zur Y, Wood ML, Neuringer LJ. Motion-insensitive, steady-state free precession imaging. Magn Reson Med. 1990;16:444–459. doi: 10.1002/mrm.1910160311. [DOI] [PubMed] [Google Scholar]
- 4.Deshpande VS, Shea SM, Laub G, Simonetti OP, Finn JP, Li D. 3D magnetization-prepared True-FISP: A new technique for imaging coronary arteries. Magn Reson Med. 2001;46:494–502. doi: 10.1002/mrm.1219. [DOI] [PubMed] [Google Scholar]
- 5.Peters DC, Ennis DB, McVeigh ER. High-resolution MRI of cardiac function with projection reconstruction and steady-state free precession. Magn Reson Med. 2002;48:82–88. doi: 10.1002/mrm.10193. [DOI] [PMC free article] [PubMed] [Google Scholar]
- 6.Brittain JH, Olcott EW, Szuba A, Gold GE, Wright GA, Irarrazaval P, Nishimura DG. Three-dimensional flow-independent peripheral angiography. Magn Reson Med. 1997;38:343–354. doi: 10.1002/mrm.1910380302. [DOI] [PubMed] [Google Scholar]
- 7.Vasanawala SS, Hargreaves BA, Pauly JM, Nishimura DG, Beaulieu CF, Gold GE. Rapid musculoskeletal MRI with phase-sensitive steady-state free precession: Comparison with routine knee MRI. AJR Am J Roentgenol. 2004;184:1450–1455. doi: 10.2214/ajr.184.5.01841450. [DOI] [PubMed] [Google Scholar]
- 8.Haacke EM, Wielopolski PA, Tkach JA, Modic MT. Steady-state free precession imaging in the presence of motion: Application for improved visualization of the cerebrospinal fluid. Radiology. 1990;175:545–552. doi: 10.1148/radiology.175.2.2326480. [DOI] [PubMed] [Google Scholar]
- 9.Bangerter NK, Hargreaves BA, Vasanawala SS, Pauly JM, Gold GE, Nishimura DG. Analysis of multiple-acquisition SSFP. Magn Reson Med. 2004;51:1038–1047. doi: 10.1002/mrm.20052. [DOI] [PubMed] [Google Scholar]
- 10.Elliott AM, Bernstein MA, Ward HA, Lane J, Witte RJ. Nonlinear averaging reconstruction method for phase-cycle SSFP. Magn Reson Imaging. 2007;25:359–364. doi: 10.1016/j.mri.2006.09.013. [DOI] [PubMed] [Google Scholar]
- 11.Çukur T, Bangerter NK, Nishimura DG. Enhanced spectral shaping in steady-state free precession imaging. Magn Reson Med. 2007;58:1216–1223. doi: 10.1002/mrm.21413. [DOI] [PubMed] [Google Scholar]
- 12.Hayes CE, Hattes N, Roemer PB. Volume imaging with MR phased arrays. Magn Reson Med. 1991;18:309–319. doi: 10.1002/mrm.1910180206. [DOI] [PubMed] [Google Scholar]
- 13.Sodickson DK, Manning WJ. Simultaneous acquisition of spatial harmonics (SMASH): Fast imaging with radiofrequency coil arrays. Magn Reson Med. 1997;38:591–603. doi: 10.1002/mrm.1910380414. [DOI] [PubMed] [Google Scholar]
- 14.Pruessmann KP, Weiger M, Scheidegger MB, Boesiger P. SENSE: Sensitivity encoding for fast MRI. Magn Reson Med. 1999;42:952–962. [PubMed] [Google Scholar]
- 15.Griswold MA, Jakob PM, Heidemann RM, Nittka M, Jellus V, Jianmin W, Kiefer B, Haase A. Generalized autocalibrating partially parallel acquisition. Magn Reson Med. 2002;47:1202–1210. doi: 10.1002/mrm.10171. [DOI] [PubMed] [Google Scholar]
- 16.Axel L, Constantini J, Listerud J. Intensity correction in surface-coil MR imaging. AJR Am J Roentgenol. 1987;148:418–420. doi: 10.2214/ajr.148.2.418. [DOI] [PubMed] [Google Scholar]
- 17.Murakami JW, Hayes CE, Weinberger ED. Intensity correction of phased-array surface coil images. Magn Reson Med. 1996;35:585–590. doi: 10.1002/mrm.1910350419. [DOI] [PubMed] [Google Scholar]
- 18.Vokurka EA, Thacker NA, Jackson A. A fast model independent method for automatic correction of intensity nonuniformity in MRI data. J Magn Reson Imaging. 1999;10:550–562. doi: 10.1002/(sici)1522-2586(199910)10:4<550::aid-jmri8>3.0.co;2-q. [DOI] [PubMed] [Google Scholar]
- 19.Belaroussi B, Milles J, Carme S, Zhu YM, BenoitCattin H. Intensity nonuniformity correction in MRI: existing methods and their validation. Med Image Anal. 2006;10:234–246. doi: 10.1016/j.media.2005.09.004. [DOI] [PubMed] [Google Scholar]
- 20.Bydder M, Larkman DJ, Hajnal JV. Combination of signals from array coils using image-based estimation of coil sensitivity profiles. Magn Reson Med. 2002;47:539–548. doi: 10.1002/mrm.10092. [DOI] [PubMed] [Google Scholar]
- 21.Lustig M, Santos JM, Pauly JM. A super-FOV method for rapid SSFP banding artifact reduction. Proceedings of the 13th Annual Meeting of ISMRM, Miami Beach; 2005. p. 504. [Google Scholar]


