

Abstract
We present a camera-based method for automatically quantifying the individual and social behaviors of fruit flies, Drosophila melanogaster, interacting within a planar arena. Our system includes machine vision algorithms that accurately track many individuals without swapping identities and classification algorithms that detect behaviors. The data may be represented as an ethogram that plots the time course of behaviors exhibited by each fly, or as a vector that concisely captures the statistical properties of all behaviors displayed within a given period. We found that behavioral differences between individuals are consistent over time and are sufficient to accurately predict gender and genotype. In addition, we show that the relative positions of flies during social interactions vary according to gender, genotype, and social environment. We expect that our software, which permits high-throughput screening, will complement existing molecular methods available in Drosophila, facilitating new investigations into the genetic and cellular basis of behavior.
The fruit fly, Drosophila melanogaster, has emerged as an important genetic model organism for the study of neurobiology and behavior. Research on fruit flies has led to insight into many behaviors of medical interest including drug abuse1,2, aggression3,4, sleep deprivation5, aging6, and memory loss7. The large array of genetic manipulations possible in Drosophila makes it an ideal model system to study general principles of behavioral neuroscience. For example, toolkits have recently been developed for altering the physiology of specific populations of neurons in intact animals8,9,10,11. However, analysis of the behavioral effects of these manipulations is hampered by the absence of thorough and quantitative methods for measuring behavior12.
Machine vision has shown promise for automating tracking and behavior analysis of Drosophila and other animals. Several algorithms have been developed that can successfully track the trajectories of single, isolated flies13,14,15,16. While useful, tracking only a single fly limits the types of behaviors that can be analyzed as well as the throughput of the system. A number of tracking systems can follow multiple, unmarked, interacting animals, but fail when the animals are in close proximity to one another, and thus cannot keep individual identities distinct17,18,19,20,21,22. The commercially available Ethovision system (Noldus) can track the identities of multiple interacting animals, but requires tagging the animals with colored markers. The problem of tracking individuals within groups has been researched for studies of eusocial insects (ants and bees)23,24, but robust implementations are not publicly available. Recently, systems were developed to automatically detect components of aggression and courtship behavior in flies4,25, in addition to tracking their positions. However, these systems cannot be used with large populations or unmarked flies, and detectors for new behaviors cannot be created without additional programming.
We propose a general-purpose, automated, quantitative, and high-throughput system for measuring the behavior of interacting fruit flies. Our system uses machine vision techniques to automatically track large groups of unmarked flies while maintaining their distinct identities. We thus obtain trajectories (the position and orientation of each fly in each frame of a recorded video) that provide a condensed, detailed description of each animal’s behavior. Our system also includes an array of automatic behavior detectors based on machine learning, which further condense these trajectories into ethograms: meaningful, quantitative statistics of social and individual behavior. Because our system can quickly measure many detailed statistics of fly behavior, it can be used to discover and quantify subtle behavioral differences between different populations of flies and between individuals within a population. We have designed our tracker to be adaptable to other laboratory setups, and our machine learning software can be used to specify new, automatic behavior detectors without programming. We therefore envision it will foster a more effective exploitation of genetic tools in behavioral neuroscience.
Results
The behavioral arena used initially to test and develop our system consisted of a 24.5 cm diameter platform with an overhead FireWire camera and infrared lighting (Fig. 1). The software component consists of a tracker for computing fly trajectories from captured digital video (Fig. 2), and a behavior detector, which may be trained from examples (Fig. 3). The system is accurate: the x-y position of a fly is estimated with a median error of 0.03 mm (2% of body length), orientation with a median error of 4° (Fig 2e, Supplementary Figs. 1 and 2). Identity errors are absent with minimal user supervision, and occur every 1.5 h·fly-1 in fully automatic mode (see the Methods section, Supplementary Table 1).
Figure 1.

Walking arena with sample trajectories. (a) Schematic diagram of the walking arena. A 24.5 cm tall printed paper cylinder is backlit by an array of 8 halogen lights (only one shown). At the top is a 1280×1024-pixel camera with 8 mm lens and infrared pass filter, and 2 arrays of 850 nm LEDs. The circular, 24.5 cm-diameter, 6 mm-thick aluminum base is thermally controlled by four Peltier devices and heat-exchangers mounted on the underside (only one shown) and is surrounded by a heat barrier composed of an insulating strip and a galvanized steel ring heated by thermal tape. Flies are loaded into the chamber through a hole in the floor with replaceable stopper. (b) The x,y position of a single fly or of 20 flies for 5 and 30 minutes of a trial. Supplementary Videos 1-3 each show 2 minutes of trajectories for 50 flies.
Figure 2.
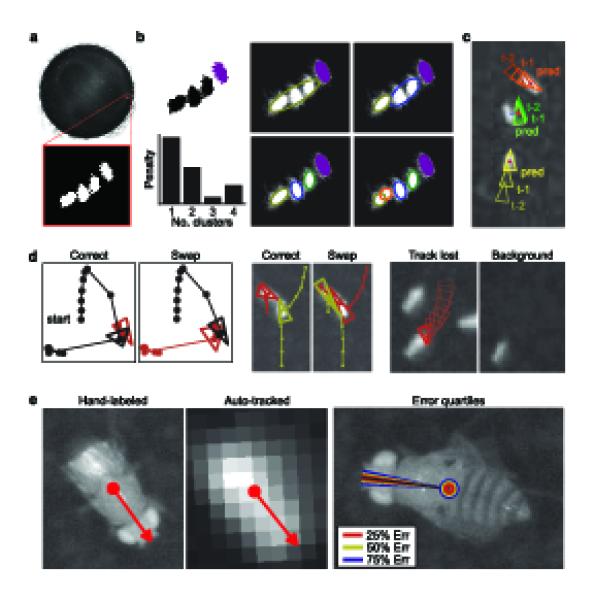
Tracking algorithm and evaluation. (a) Example frame with the foreground/background classification for pixels within a subwindow. (b) Detection of individual flies We show the connected components of foreground pixels. The purple component corresponds to one fly; the large black component corresponds to three. The tracker splits this large component into 1–4 clusters. The penalty based on cluster size is shown for each choice. [CE: units of penalty are arbitrary. AU says: The units of ‘penalty’ relate to the heuristic described in Methods and Supplementary Note are somewhat arbitrary. Technically, the units are ‘pixels squared’.] (c) Identity matching. Red dots indicate the detected fly positions in frame t; triangles indicate the tracked positions at frames t - 2 and t – 1 and the predicted position (pred) at frame t. Blue lines indicate the lowest-cost match between predicted and detected positions. (d) Example identity errors. (left) One fly (black) jumps near a stationary fly (red), and identities are swapped. We plot the correct and automatically computed trajectories. Triangles indicate the positions of the flies at the frame of the swap; circles indicate their trajectories. (middle) A large connected component is split incorrectly. (right) The lower left fly sits still during the majority of the trial, becoming part of the background model. We show the frame in which the fly’s trajectory is lost as well as the background model at that instant. (e) Accuracy of position and orientation. (left) We compare the center and orientation of a fly manually labeled on a high-resolution image (60 px·mm-1) to those automatically computed from a low-resolution image (4 px·mm-1). (right) Quartiles of the sampled center position and orientation errors plotted on an example high-resolution image. The median error was 0.0292 mm (0.117 px) for the center and 3.14° for the orientation.
Figure 3.
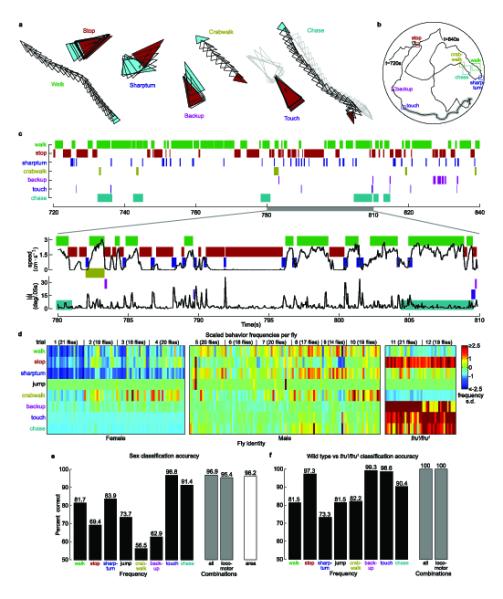
Ethograms of eight automatically-detected behaviors. (a) Examples of behaviors detected (from trajectory in (b)). Triangles indicate the fly’s positions in every frame. A cyan/red triangle is plotted at the start/end of the behavior. For touching and chasing, we plot in gray the position of the other fly. In all panels, each behavior is coded by a different color. (b) Sample 2 minute trajectory for a male fly in a mixed-sex arena. The colored boxes indicate trajectory segments in (a). (c) (top) Behavior classifications for the 2 minute trajectory. A mark at t = 780 for the ‘chase’ row indicates that the fly was chasing at time t = 780. (bottom) Plots of translational and angular speed for a 30 second span of the trajectory (t = 780–810 s), superimposed over the behavior classifications. (d) Example behavioral vectors for female (left), male (center), and male fru1/fru1 (right) flies in single-sex trials. Each column corresponds to a fly, each row to a behavior (n = 78 (female), 108 (male), 40 ( fru1)). Color indicates the z-scored frequency (onsets per minute) for each behavior. (e) Accuracy of sex prediction from automatically-detected behaviors. The black bars indicate the cross-validation error of single-threshold classifiers based on frequency. The gray bars correspond to logistic regression classifiers from all eight (left) and the six locomotor (right) behaviors. The white bar shows the accuracy of classifying sex based on the image area of the fly (see Methods). (f) Accuracy of genotype prediction (wild type vs. fru1/fru1), as in (e).
To illustrate the potential of using multiple fly trajectories for automated behavior analysis, we carried out three proofs-of-concept. First, we defined automatic detectors for several individual and social behaviors exhibited by flies walking in a circular arena. These detectors were then used to produce ethograms for flies in different gender groupings. To demonstrate that these ethograms are useful descriptions of the flies’ behavior, we used them to accurately classify flies according to gender (male vs. female) and genotype (wild type vs. fruitless). The Fruitless protein is a transcription factor that plays a role in the sex determination pathway in flies. Male fruitless mutants exhibit several behavioral abnormalities, including inter-male courtship chains. Second, we quantified differences in the behavior of individuals within a population, and show that those differences are stable throughout each trial. Third, we examined the spatial distributions of the relative positions of flies during social interactions. We compared the distributions for pairs of flies of the same and different sex, as well as for male fruitless mutants. All analyses described below were derived from 17 30 minute trials, each containing 20 flies, for a total of 170 fly-hours. Four trials used only females, six only male, five were half-male and half-female, and two used fru1/fru1 male flies. Examples of each of the four trial types are provided in Supplementary Videos 1-4.
Automatic Ethograms
We created automatic detectors for eight behaviors with a wide range of sequence durations, velocities, and accelerations (Fig 3a, Supplementary Video 5, Supplementary Table 2). These behaviors represented the majority of the flies’ actions in our circular arena. Most detectors were trained from a few labeled examples as described in the Methods section. The software is user-friendly, and detectors for new behaviors can be created without additional programming. Six of the behaviors involve basic locomotor actions, and two of the behaviors relate to social interactions between flies. Most of the time the flies either walked at a relatively constant velocity (walk) or stopped in place (stop). The next-most common behavior was the sharp turn, in which a fly made a large, rapid change in orientation. Other locomotor classifications included crabwalks, in which the fly walked with a substantial sideways component, and backups, in which the flies’ translational velocity was negative. Jumps consisted of rapid translations within the arena. A touch occurred when the head of one fly came in contact with another fly. Chases were cases in which one fly (always a male) followed another across the arena. An automatic detector for a given behavior (e.g. the walk detector) inputs the trajectory for an individual fly (Fig. 3b) (or pair of flies, for social behaviors), derives per-frame statistics such as the translational speed, angular speed, or distance to the second fly (for social behaviors), then segments the trajectory into bouts in which the fly is and is not performing the given behavior (Fig. 3c).
By collecting the statistics of these eight behaviors into a vector, we created ethograms: rich, quantitative descriptions of each individual fly’s behavior. For each fly, we computed one such description, consisting of the frequency with which each individual fly performed each behavior (we explore other descriptions, the fraction of time a fly performs a behavior and mean behavior duration in Supplementary Fig. 3). To visualize differences among female, male, and male fru1/fru1 flies, we grouped the flies by type, and displayed frequency in pseudocolor (Fig. 3d). Inspection of this ‘behavioral microarray’ suggests that the behavioral vectors of female, male, and fru1/fru1 male flies differ in a consistent way. We quantified these differences by computing the mean and standard error behavior vectors for each type of fly (Supplementary Fig. 4).
To demonstrate that these ethograms are powerful descriptors of behavior, we tested whether we could predict the sex of a fly (male vs. female) and its genotype (wild type males vs. fru1/fru1 male), based solely on components of the automatically-generated behavioral vector (Fig. 3e). We found that predictors based on the statistics of each of the eight behaviors independently distinguished sex with accuracies all better than chance, with touch frequency performing best (96.8% accuracy), and sharp turn frequency performing best of the locomotor behaviors (83.9% accuracy). A predictor based on the combination of all behaviors had an accuracy of 96.9%. Even a predictor based solely on locomotor behaviors (excluding touches and chases) predicted sex with an accuracy of 95.5%. We emphasize that we are not advocating using behavioral statistics for sexing flies. Our mixed-sex trials (Figs. 4 and 5) used a fly’s median image area for determining sex, a technique that achieves 96.2% accuracy. Instead, these behavior prediction accuracies are evidence that the ethograms are strongly correlated with gender.
Figure 4.
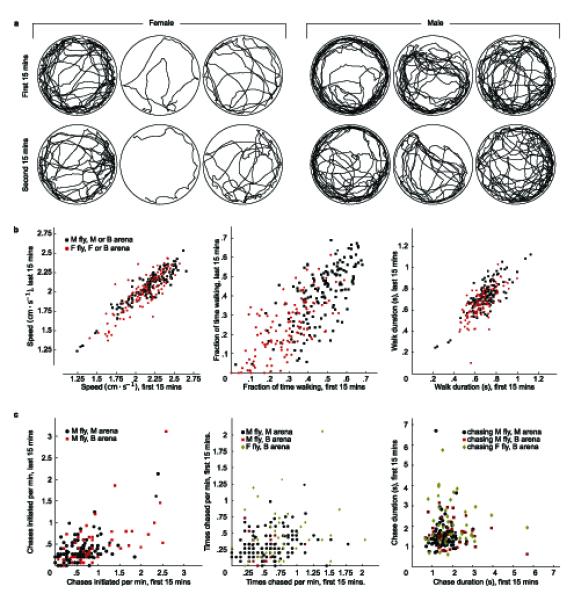
Differences within and among individual flies. (a) The first and second halves of trajectories for three male and three female flies from the same trial. (b) Scatter plots of walking statistics from each individual fly in the first 15 minutes of its trajectory against the same statistics from the last 15 minutes of its trajectory for flies in all trial types (female n = 132, male n = 159). M = male, F = female, B = both male and female. Walking statistics examined were: (left) Mean speed in frames in which fly was classified as walking: r = 0.889, P < 2.2 × 10⁻¹⁶ (r, Pearson’s correlation coefficient; P, the probability that the null hypothesis of r non-positive is correct), (center) Fraction of frames fly is classified as walking: r = 0.689, P < 2.2× 10⁻¹⁶ (right) Mean duration of sequences of consecutive walking frames: r = 0.765, P < 2.2× 10⁻¹⁶. (c) Chasing behavior differences. We repeated the above procedure for chasing behavioral statistics: (left) Frequency with which the fly begins chasing another fly: r = 0.592, P = 3.89× 10⁻¹⁶, (center) frequency with which a fly is chased by another fly: r = 0.213, P = 1.54× 10-03, and (right) mean duration of chases: r = 0.054, P = 0.261.
Figure 5.
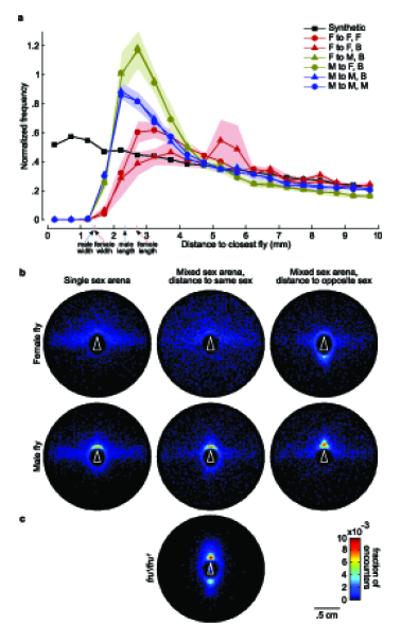
Spatial analysis of social interactions. (a) Normalized histogram of inter-fly distances. We show a histogram of the distance to the nearest fly for each fly in each frame. Each line corresponds to a different condition, as indicated. For example, the line through red triangles indicates distance from a female (F) to the closest female (F) in a male-female (B) arena. The frequency was normalized both by the total number of counts and by the area of the bin. Each encounter was counted only once by ignoring all but the first frame in which both flies were stopped. The ‘synthetic’ condition shows a control where we decorrelated fly positions by staggering the trajectories in time, and collapsed data from all conditions. The lightly shaded regions indicate one standard deviation in normalized frequency, approximated by randomly splitting the flies into five groups. For comparison, the pink and blue tick marks indicate the mean fly widths and heights for female and male flies, respectively. (b) Histogram of the x,y relative position of one fly in the coordinate system of another at the closest point of an encounter. Each plot corresponds to a different social condition, as indicated. The white triangle in each plot shows the fixed position of the given fly. The pixel color indicates the frequency with which the closest fly is in the corresponding location bin. (c) Histogram of the x,y mutual position between fru1/fru1 males.
Predictors of genotype (wild type vs. fru1/fru1 males) were even more robust (Fig. 3f). Frequency of backups achieved the best performance (99.3% accuracy). Using all behaviors or all locomotor behaviors, fruitless males could be classified with 100% accuracy. This technique of behavioral profiling could easily be extended to include more behaviors or more features of each behavior (see Supplementary Note).
Behavioral variation between and within individuals
We observed that the trajectories of individual flies look qualitatively different (Fig. 4a). For example, some flies traveled more than others, and some spent a larger fraction of time near the arena wall. Because our algorithm keeps track of each fly’s trajectory, we can easily gather data on a large number of flies and explore statistical differences in behavior across individuals. To this end, we computed behavioral statistics separately for the first 15 minutes and the second 15 minutes of each 30 minute trial and calculated the correlation between the two halves. We considered three statistics of locomotor behavior: the mean speed during walking episodes, the fraction of frames the fly was classified as walking, and the mean duration of walking episodes (Fig. 4b). The correlation between the first- and second-half statistics was significant and positive for all three walking metrics, indicating that individuals maintained behavioral tendencies throughout the 30 minutes trials. Thus, although within the tested strain of wild type flies we found large and significant differences in walking behavior, each individual walks consistently over time.
We also investigated whether there were consistent differences in chasing behavior across individual flies during a 30 minutes trial. For the first- and second-half of each trial, we computed the frequency with which a fly begins chasing another fly, the frequency with which other flies begin chasing a given fly, and the mean time duration of chase sequences initiated by a given fly (Fig. 4c). As with the walking experiments, we computed the correlation between behavioral statistics gathered during the first and second half of each trial. We found small, but significant, positive correlations for frequency of chasing and frequency of being chased, but no significant correlation for duration of chase sequences.
Gender differences and fly-fly interactions
Because our data consisted of the location and orientation of all individuals at all times, we could examine the spatial distributions of the relative positions of flies during social interactions. We compared the distributions of inter-fly distances for different gender pairings in single- and mixed-sex trials (e.g. male-to-male distance in mixed-sex trial) (Fig. 5a). For a control, we created a semi-synthetic data set by artificially staggering in time all 20 trajectories relative to one-another (the first fly’s trajectory was left unchanged, but the second fly’s trajectory was shifted in time so that it started at t = 1.5 minutes, with the last 1.5 minutes of its original trajectory wrapped around to fill the time from t = 0 to t = 1.5 minutes. The third flies’ trajectory was then shifted by 3 minutes, the fourth by 4.5 minutes, etc.). These data approximate trajectories in which the flies do not interact.
The peaks in the male-to-male and male-to-female distributions compared to the synthetic data indicate that males actively approach other flies to a distance of 2.5 - 3.5 mm. In addition, the relatively low frequency of close interactions (< 4 mm) between females suggest that they maintain a larger buffer between themselves. These findings are robust across trial type (e.g. males approach other males as closely in mixed-sex arenas as in single-sex arenas). We also observed that the flies’ centroids never move within 1.5 mm of each other, which is expected given this distance roughly corresponds to a fly’s body width.
To further explore spatial differences during social interactions, we created a new behavioral classification termed ‘encounter’ describing those trajectory intervals in which the distance between a pair of flies was less than 10 mm. For each encounter, we computed the relative location of one fly in the coordinate system of the other at the time when the distance between them was minimal. We computed histograms of these relative locations over all encounters of each gender pairing and trial type (Fig. 5b). These histograms are consistent with our qualitative knowledge of courtship behavior. For interactions involving males, the majority of the encounters occur very near the other fly, when the flies are almost in direct contact. In contrast, the relative locations of the female-female encounters are more diffuse. It is apparent from the forward hot spots in Figure 5b that males often take a position so that another fly is right in front of them, an orientation that is consistent with their chasing behavior. Conversely, a hot spot is visible directly behind females in mixed-sex trials, indicating that they are being chased by males. Interestingly, two hotspots are apparent in the encounter histograms of fru1/fru1 males (Fig. 5c), indicating a social phenotype that is intermediate between that of males and females. The data in this figure represent a quantitative and reproducible measure of the chaining phenotype that is characteristic of many male fruitless mutants26.
Discussion
We developed software that allowed us to automatically track and analyze up to 50 individual flies (a density 0.1 fly·cm-2 in our arena) simultaneously for long periods of time. We estimate that the behavioral analyses shown in Figure 3 would have taken a human operator between 3,000 and 5,000 hours to produce manually. The observations on individual behavior would have taken much longer. The software, available at http://www.dickinson.caltech.edu/ctrax, is open-source and was developed to function in a wide array of experimental contexts. Furthermore, it is easy for a biologist to train the system to detect new behaviors by providing a few examples using a GUI designed for this purpose. [AU: Please also mention that software will be available from the Nature Methods website]
The open arena used for most of our analysis requires clipping the flies’ wings, a manipulation which may affect aspects of their behavior, for example the production of courtship song. In addition, although the open arena apparatus allowed us to perform the rigorous groundtruthing presented, it is custom-built and would not be instantly available to the research community. However, we have analyzed data that were collected in a much simpler and easy-to-replicate chamber, consisting of a backlit plastic chamber with a glass top (unpub. data). This successful analysis (Supplementary Videos 6 and 7) demonstrates that our software works on data collected from intact flies in an inexpensive and easily-reproduced device.
Our method benefits from insight gained from previous approaches to the study of behavior in Drosophila. The first, inspired by Benzer’s classic ‘countercurrent’ apparatus27, involves crafting a simple mechanical contraption that isolates behavioral outliers in a large population. This method is easy to perform and thus amenable to high-throughput screens, but does not provide detailed measurements on individual flies. In addition, complex behaviors (e.g. courtship, aggression) are not easily screened by these techniques. The second, exemplified by Götz’ tethered flight arenas28 and ‘Buridan’s paradigm’29 involves developing a sophisticated apparatus that provides detailed, time-resolved measurements on individual flies. This approach offers a rich view of behavior but does not allow for high-throughput screens. In addition, behavioral analyses that depend on elaborate, custom-made instruments do not easily proliferate throughout the scientific community. The third approach, exemplified by the use of ‘courtship wheels’30, provides detailed information on the complex behaviors of individual flies, but relies on manual scoring by human observers and is labor-intensive and subjective.
Our system combines the key features of prior behavior analysis methods, and is thus a complementary tool to genetic manipulation for the study of the neural bases of behavior. Because each fly is tracked and measured individually, it is possible to quantify the behavior of individual flies as well as fly-fly interactions. The system’s flexibility allows many different individual and social behaviors to be defined and automatically detected. The definitions for these behaviors are interpretable and quantitative, allowing researchers to easily reproduce experiments. Finally, the system supports high-throughput screening, facilitating its use with genetic manipulations.
Methods
Flies
Wild type flies, Drosophila melanogaster, used in these experiments were derived from a laboratory population originating from a collection of 200 wild-caught females. fru1/fru1 flies, were derived from a fru1/TM3 stock. In the open arena experiments, flies were cold-anesthetized 24 hours before experiments in order to clip their wings to 1/2 their original length so that they could not fly out of the arena. They recovered overnight on food and were wet starved 6 hours prior to experiments. For more information see the Supplementary Note.
Apparatus
The walking arena used in most of our experiments consisted of a temperature-controlled 24.5 cm diameter platform surrounded by a static backlit visual pattern (Fig. 1). Flies were maintained in the arena by a thermal barrier around the outside edge of the walking platform and by clipping the wings as described above. The thermal barrier consisted of a rope heater wrapped around a galvanized steel band insulated from the platform by a layer of neoprene. Although some flies would occasionally hop over the arena’s edge, most would avoid walking off the platform due to the heat barrier. Above the arena were mounted infrared-LEDs and a 1280×1024 pixel camera sensitive in the near-infrared. Images were recorded at 20 fps by a computer using the Motmot Python camera interface package31. For more details see the Supplementary Note. Although our software was developed in conjunction with this set up, it is adaptable to other arrangements with similar characteristics (Supplementary Videos 6–7).
Tracking Algorithm
Our purpose in developing both the algorithm and the apparatus was to create a reliable system for obtaining interesting behavioral statistics for use by behavioral geneticists. Our tracking algorithm combines techniques from the computer vision literature to achieve this goal. The tracking algorithm inputs a stored video sequence and computes the trajectory of each fly (center position and orientation in each frame). Tracking is achieved by alternating two steps: fly detection and identity assignment. At each new frame, flies are first detected and their positions and orientations are computed. Next, each detected fly in frame t is associated with a fly tracked in the previous frame t - 1. Example tracked trajectories are shown in Figure 1b. Our tracking algorithm is described below; more details are given in the Supplementary Note.
Detection
Detection is based on background subtraction32. In our laboratory setting, we can ensure that the camera is still and the infrared lighting is constant, thus the only objects moving in the video are flies. The appearance and variability of the arena without flies (the background) is estimated before tracking as the pixelwise median of a set of frames sampled from the entire video sequence. The variability is estimated as the pixelwise median absolute deviation from the background image. Using the median makes our algorithm tolerant to flies that do not move for long periods of time. Note that it is good practice to estimate the background model from video taken after the flies have been introduced because the arena may be inadvertently jostled in the process of introducing flies. Movement of the arena or camera of just one pixel can cause large errors in background subtraction.
In our setup, the flies appear bright and the background dark (the tracker will also work with dark flies on a light background, as shown in Supplementary Videos 6 and 7). Foreground pixels — pixels belonging to flies — are detected when the difference between the pixel and background intensity exceeds a multiple of the background variability (Fig. 2a). This step relies on the flies (and only the flies) looking significantly different from the background; poor camera quality and excessive video compression can compromise this step. Next, foreground pixels are grouped together into single fly detections. Ideally, each connected component33 of foreground pixels would correspond to exactly one fly. We thus initially fit an ellipse to each connected component by fitting a Gaussian to the locations of the corresponding foreground pixels. Due to flies sometimes coming into contact and inevitable errors in pixel labeling, some connected components may correspond to many, part of one, or no flies. These errors are corrected automatically by detecting connected components that are too large/small and considering multiple splitting/merging hypotheses (Fig. 2b).
Identity assignment
Each fly detected in frame t is associated with a trajectory from frame t - 1. In the first frame, a unique trajectory label is assigned arbitrarily to each detection. In subsequent frames, assuming that each trajectory has been computed up to frame t - 1, it is extended to frame t by assigning each fly detection in t to the trajectory that best predicted its position and orientation (Fig. 2c), where predictions are computed by a constant-velocity model. This is a multiple-assignment problem because trajectories and flies have to be in one-to-one correspondence: two flies cannot be associated to the same trajectory and vice-versa. Thus, the optimal solution must be computed simultaneously for all flies. Occasionally, a fly may escape or enter the arena, or the detection stage may make an error. For this reason, our software algorithm allows a trajectory or a detection to be unmatched when the distance is too large, and pay a constant penalty. The best overall assignment is computed using the Hungarian method for minimum-weight perfect bipartite matching34,35. The assignment step requires that the frame rate be sufficiently high relative to the speed of the flies so that the optimal matching between observations and trajectories is easy for a human observer.
Hindsight
The detection step is performed using information from only the current frame, and the matching step assumes that these detections are correct. Errors in the detection step will often result in births or deaths of tracks. After identity assignment, the tracker determines whether each birth and death can be prevented by temporarily splitting, connecting, merging, or deleting tracks. This step works on the assumption that flies rarely enter or leave the arena.
Orientation Ambiguity
The detection phase cannot tell the head from the tail of a fly. To resolve this ambiguity, at each frame our tracker determines whether to add 180° to the orientation of each fly. Using a variation of the Viterbi algorithm36, the sequence of orientation offsets is computed that minimizes the change in orientation between consecutive frames and the difference between orientation and velocity direction when the fly is moving.
System Evaluation
We measured the quality of our tracker by comparing its measurements with groundtruth on a set of benchmark videos. We distinguish identity, position, and sex assignment errors. Identity errors include swapping flies’ identities, losing flies’ tracks, and spurious detections that do not correspond to flies (Fig. 2d). Position errors are inaccuracies in the estimated position and orientation of a fly (Fig. 2e). Sex assignment errors are mistakes in determining whether a fly is male or female.
Identity Errors
We evaluated the frequency of identity errors made by our system on 18 manually-annotated video sequences, each containing 10, 20, or 50 wild type flies, which were either all female, all male, or half male, half female. Two 5-minute videos were used as benchmarks for each condition. We show example identity errors in Figure 2d. To find identity errors, a trained operator examined those video frames in which tracking is hardest: when flies were near each other, there were large differences between predicted and measured positions, or at the births and deaths of trajectories. These frames were inspected in slow motion, zoomed in on the difficult flies. The operator marked an annotated frame as incorrect if there was an identity error, and also classified the type of error. The scoring took approximately 0.5 hours for each 10-fly video, 2 hours for each 20-fly video, and 8 hours for each 50-fly video. We observed an identity error on average once every 5 fly-hours in the 10 fly videos, once every 1.5 fly-hours in the 20 fly videos, and once every 40 fly-minutes in the 50 fly videos. Supplementary Table 1 shows the counts per error type per video.
Fixing Identity Errors Manually
Using simple heuristics, a small number of suspicious frames and flies are automatically flagged. An operator can then inspect these frames and manually fix any errors using our GUI. All manually determined identity errors in the benchmark sequences were also flagged automatically, thus error detection is 100% accurate with this limited supervision.
Position Errors
We simultaneously recorded high-resolution (HR) video (15x standard resolution, corresponding to fly lengths of 120 pixels) of a portion of the arena with our standard lower-resolution (LR) video of the entire arena (Fig 2e). We labeled the positions manually in the HR video and compared them to those computed by the tracker from the LR video. The HR labels were transformed into the LR coordinate system for this comparison (Supplementary Fig. 1, Supplementary Note). A random sample of 100 flies from 9 5-minute video sequences was used. As above, each video contained 10, 20, or 50 flies, and each contained either all male, all female, or half male and half female flies. We chose frames in the HR video in which flies were fully visible and far from other flies. The hand-annotation consisted of a carefully drawn bounding box of the fly, and was used to estimate the center position and orientation of the fly. We repeated the above experiment on 50 samples in which the chosen fly was close to another fly. The median error was 0.0292 mm (0.117 px) for the center and 3.14° for the orientation (Fig 2e, Supplementary Fig. 2). For touching flies, the median errors were slightly larger: 0.0461 mm for the center position and 10.6° for the orientation (Supplementary Table 3).
Gender assignment
As female flies are slightly larger than male flies, a fly’s sex can be automatically predicted from its image area. For each trajectory, the median area is computed and sex is assigned by comparing this area to a threshold estimated from single-sex experiments (correcting for biases from lighting variations in different parts of the arena). The hold-one-out error rate was 4/77 = 0.0519 for females and 3/106 = 0.0283 for males.
Behavior definitions
All our behavior definitions have the following structure. The fly is performing the defined behavior from frames t1 to t2 if all of the following apply: (1) In each frame t1,…,t2, properties of the fly (e.g. speed, distance to another fly) are within given ranges. (2) In each frame t1,…,t2 properties of the fly are temporally near (within a given number of frames) frames in which the properties are within tighter ranges. (3) The summed properties (e.g. total distance traveled) of the fly’s trajectory in t1…t2 are within given ranges. (4) The mean value of properties of the fly are within given ranges.
Social behaviors operate on properties of pairs of flies rather than individuals. Parameters of each behavior, including the properties and ranges for each of the above rules, are given in Supplementary Table 2.
For each behavior, each trajectory is segmented into intervals in which the fly is and is not performing the behavior by maximizing the sum-squared lengths of the positive sequences using a globally optimal, dynamic programming algorithm. Note that this one-vs.-all set of behavior detectors will result in some frames of the trajectory not being labeled at all (our behavior vocabulary is incomplete), and that a fly may be engaged in multiple behaviors at the same time (e.g. chasing and walking).
Our software allows us to define behavior detectors in two ways. The quickest way is direct hand-selection of the ranges of property values defining a behavior. We found this approach intuitive and easy for a couple of behaviors (‘back up’ and ‘touch’). In all other cases we used example-based training to learn the ranges. Using the latter approach, a user manually segments sample trajectories to create training data. The parameter ranges are then computed automatically so that the detected segmentations agree with the manual segmentations (see Supplementary Note). In either the manual or example-based detector training, no new computer code is required. In both cases, other scientists may inspect the parameter ranges defining specific behaviors and thus reproduce exactly a given experiment.
Supplementary Material
Acknowledgments
We thank A. Straw for developing and maintaining the camera interface program, J. Simon for assistance in collecting the data presented in Supplementary Videos 6 and 7, W. Korff for help with high resolution data acquisition, and M. Arbietman, Univerisity of Southern California, for the gift of the fruitless fly lines. Funding for this research was provided by National Institutes of Health grant R01 DA022777 (to M.H.D. and P.P).
Footnotes
Editorial Summaries
AOP: An automated system for tracking large numbers of fruit flies over time and for detecting their behaviors is presented, and should allow high-throughput quantitative studies of fly behavior.
Issue: An automated system for tracking large numbers of fruit flies over time and for detecting their behaviors is presented, and should allow high-throughput quantitative studies of fly behavior.
References
- 1.Wolf FW, Heberlein U. Invertebrate models of drug abuse. Journal of Neurobiology. 2003;54:161–178. doi: 10.1002/neu.10166. [DOI] [PubMed] [Google Scholar]
- 2.Guarnieri D, Heberlein U. Drosophila melanogaster, a genetic model system for alcohol research. International Review of Neurobiology. 2003;54:199–228. doi: 10.1016/s0074-7742(03)54006-5. [DOI] [PubMed] [Google Scholar]
- 3.Chan YB, Kravitz EA. Specific subgroups of FruM neurons control sexually dimorphic patterns of aggression in Drosophila melanogaster. Proceedings of the National Academy of Sciences. 2007;104:19577. doi: 10.1073/pnas.0709803104. [DOI] [PMC free article] [PubMed] [Google Scholar]
- 4.Hoyer SC, et al. Octopamine in Male Aggression of Drosophila. Current Biology. 2008 doi: 10.1016/j.cub.2007.12.052. [DOI] [PubMed] [Google Scholar]
- 5.Ho K, Sehgal A. Drosophila melanogaster: An insect model for fundamental studies of sleep. Methods Enzymol. 2005;393:772–793. doi: 10.1016/S0076-6879(05)93041-3. [DOI] [PubMed] [Google Scholar]
- 6.Shaw P, Ocorr K, Bodmer R, Oldham S. Drosophila aging 2006/2007. Experimental Gerontology. 2008;43:5–10. doi: 10.1016/j.exger.2007.10.008. [DOI] [PMC free article] [PubMed] [Google Scholar]
- 7.Konsolaki M, Song HJ, Dobbs W, Garza D. P2-109 Drosophila models of Alzheimer’s-related pathways. Neurobiology of Aging. 2004;25:255. [Google Scholar]
- 8.Zhang F, et al. Circuit-breakers: Optical technologies for probing neural signals and systems. Nature Reviews Neuroscience. 2007;8:577–581. doi: 10.1038/nrn2192. [DOI] [PubMed] [Google Scholar]
- 9.Callaway EM. A molecular and genetic arsenal for systems neuroscience. Trends in Neurosciences. 2005;28:196–201. doi: 10.1016/j.tins.2005.01.007. [DOI] [PubMed] [Google Scholar]
- 10.Luo L, Callaway EM, Svoboda K. Genetic Dissection of Neural Circuits. Neuron. 2008;57:634–660. doi: 10.1016/j.neuron.2008.01.002. [DOI] [PMC free article] [PubMed] [Google Scholar]
- 11.Zhou C, Rao Y, Rao Y. A subset of octopaminergic neurons are important for Drosophila aggression. Nature Neuroscience. 2008 doi: 10.1038/nn.2164. [DOI] [PubMed] [Google Scholar]
- 12.Editorial. Geneticist seeks engineer: Must like flies and worms. Nature Methods. 2007;4:463. doi: 10.1038/nmeth0607-463. [DOI] [PubMed] [Google Scholar]
- 13.Martin JR. A portrait of locomotor behaviour in Drosophila determined by a video-tracking paradigm. Behavioural Processes. 2004;67:207–219. doi: 10.1016/j.beproc.2004.04.003. [DOI] [PubMed] [Google Scholar]
- 14.Ramazani RB, Krishnan HR, Bergeson SE, Atkinson NS. Computer automated movement detection for the analysis of behavior. Journal of Neuroscience Methods. 2007;162:171–179. doi: 10.1016/j.jneumeth.2007.01.005. [DOI] [PMC free article] [PubMed] [Google Scholar]
- 15.Grover D, Tower J, Tavaré S. O fly, where art thou? Journal of The Royal Society Interface. 2008 doi: 10.1098/rsif.2007.1333. [DOI] [PMC free article] [PubMed] [Google Scholar]
- 16.Valente D, Golani I, Mitra PP. Analysis of the Trajectory of Drosophila melanogaster in a Circular Open Field Arena. PLoS ONE. 2007;2 doi: 10.1371/journal.pone.0001083. [DOI] [PMC free article] [PubMed] [Google Scholar]
- 17.Crocker JC, Grier DG. Methods of Digital Video Microscopy for Colloidal Studies. Journal of Colloid And Interface Science. 1996;179:298–310. [Google Scholar]
- 18.Ramot D, Johnson BE, Berry TL, Jr, Carnell L, Goodman MB. The Parallel Worm Tracker: A Platform for Measuring Average Speed and Drug-Induced Paralysis in Nematodes. PLoS ONE. 2008;3 doi: 10.1371/journal.pone.0002208. [DOI] [PMC free article] [PubMed] [Google Scholar]
- 19.Ryu WS, Samuel ADT. Thermotaxis in Caenorhabditis elegans Analyzed by Measuring Responses to Defined Thermal Stimuli. Journal of Neuroscience. 2002;22:5727. doi: 10.1523/JNEUROSCI.22-13-05727.2002. [DOI] [PMC free article] [PubMed] [Google Scholar]
- 20.Tsunozaki M, Chalasani SH, Bargmann CI. A Behavioral Switch: cGMP and PKC Signaling in Olfactory Neurons Reverses Odor Preference in C. elegans. Neuron. 2008;59:959–971. doi: 10.1016/j.neuron.2008.07.038. [DOI] [PMC free article] [PubMed] [Google Scholar]
- 21.Wolf FW, Rodan AR, Tsai LTY, Heberlein U. High-Resolution Analysis of Ethanol-Induced Locomotor Stimulation in Drosophila. Journal of Neuroscience. 2002;22:11035. doi: 10.1523/JNEUROSCI.22-24-11035.2002. [DOI] [PMC free article] [PubMed] [Google Scholar]
- 22.Soll DR, Voss E. Two-and three-dimensional computer systems for analyzing how animal cells crawl. Motion analysis of living cells. 1997 [Google Scholar]
- 23.Khan Z, Balch T, Dellaert F. MCMC-Based Particle Filtering for Tracking a Variable Number of Interacting Targets. IEEE Transactions on Pattern Analysis and Machine Intelligence. 2005:1805–1918. doi: 10.1109/TPAMI.2005.223. [DOI] [PubMed] [Google Scholar]
- 24.Veeraraghavan A, Chellappa R, Srinivasan M. Shape-and-Behavior-Encoded Tracking of Bee Dances. IEEE Transactions on Pattern Analysis and Machine Intelligence. 2008:463–476. doi: 10.1109/TPAMI.2007.70707. [DOI] [PubMed] [Google Scholar]
- 25.Dankert H, Wang L, Hoopfer ED, Anderson DJ, Perona P. Automated Monitoring and Analysis of Social Behavior in Drosophila. Nature Methods. 2009;6 doi: 10.1038/nmeth.1310. [DOI] [PMC free article] [PubMed] [Google Scholar]
- 26.Hall JC. Courtship among males due to a male-sterile mutation in Drosophila melanogaster. Behavior Genetics. 1978;8:125–141. doi: 10.1007/BF01066870. [DOI] [PubMed] [Google Scholar]
- 27.Benzer S. Behavioral mutants isolated by countercurrent distribution. Proceedings of the National Academy of Sciences. 1967;58:1112–1119. doi: 10.1073/pnas.58.3.1112. [DOI] [PMC free article] [PubMed] [Google Scholar]
- 28.Götz K. Flight control in Drosophila by visual perception of motion. Biological Cybernetics. 1968;4:199–208. doi: 10.1007/BF00272517. [DOI] [PubMed] [Google Scholar]
- 29.Bülthoff H, Götz KG, Herre M. Recurrent inversion of visual orientation in the walking fly, Drosophila melanogaster. Journal of Comparative Physiology A: Sensory, Neural, and Behavioral Physiology. 1982;148:471–481. [Google Scholar]
- 30.Siegel RW, Hall JC. Conditioned Responses in Courtship Behavior of Normal and Mutant Drosophila. Proceedings of the National Academy of Sciences. 1979;76:3430–3434. doi: 10.1073/pnas.76.7.3430. [DOI] [PMC free article] [PubMed] [Google Scholar]
- 31.Straw A, Dickinson M. Motmot, an open-source toolkit for realtime video acquisition and analysis. Source Code for Biology and Medicine (under review) 2009 doi: 10.1186/1751-0473-4-5. [DOI] [PMC free article] [PubMed] [Google Scholar]
- 32.Piccardi M. Background subtraction techniques: A review. Proceedings of the IEEE International Conference on Systems, Man, and Cybernetics. 2004;4:3099–3104. [Google Scholar]
- 33.Gonzalez RC, Woods RE. Digital Image Processing. Prentice Hall; 2007. [Google Scholar]
- 34.Papadimitriou CH, Steiglitz K. Combinatorial Optimization: Algorithms and Complexity. Dover Publications; 1998. [Google Scholar]
- 35.Perera A, Srinivas C, Hoogs A, Brooksby G. Multi-Object Tracking Through Simultaneous Long Occlusions and Split-Merge Conditions. Proceedings of the IEEE Conference on Computer Vision and Pattern Recognition. 2006;1 [Google Scholar]
- 36.Cormen TH. Introduction to Algorithms. MIT Press; 2001. [Google Scholar]
Associated Data
This section collects any data citations, data availability statements, or supplementary materials included in this article.