Abstract
Here, we investigated the effect of chronic mild stress (CMS) on the development of atherosclerosis as well as the expression of Toll-like receptors (TLRs) signaling pathway in adolescent apolipoprotein E knockout (apoE-/-) mice. Mice were subjected to daily CMS for 0, 4, and 12 weeks, respectively. To identify the expression of Toll-like receptor 4 signaling pathway in adolescent apolipoprotein E knockout mice subjected to CMS, we compared gene expression in aortas of stressed and unstressed mice using TLRs signaling pathway real-time PCR microarrays consisting of 87 genes. We found that atherosclerosis lesions both in aortic tress and sinuses of CMS mice were significantly increased linearly in response to duration of CMS exposure. Among 87 genes analyzed, 15 genes were upregulated in stressed mice, especially TLR4, myeloid differentiation factor 88 (MyD88), and IL-1β, and 28 genes were downregulated compared with nonstressed mice. CMS mice demonstrated markedly increased aortic atherosclerosis that were associated with significant increases in levels of expression of TLR4, MyD88, nuclear factor κB (NF-κB), MCP-1, IL-1β, TNF-α, and sICAM-1. Taken together, our results suggest an important role for TLR4 signaling pathway in atherosclerosis in a CMS mouse model.
1. Introduction
Conventional cardiovascular risk factors such as high blood pressure and high cholesterol do not account fully for variation in coronary heart disease, suggesting additional risk factors warrant investigation. A considerable amount of evidence has shown that psychosocial factors play an important role in the etiology and progression of certain cardiovascular diseases such as atherosclerosis [1, 2]. Since the challenge of quantifying and defining the impact of stress on human CVD poses difficulties, attempts have been made to develop animal models to overcome these difficulties. In landmark studies, Kaplan et al. showed that stress in the form of instable social hierarchies accelerated atherosclerosis in male cynomolgus monkeys [3].
However, despite accumulating evidence and increased awareness of the importance of stress in the pathogenesis of atherosclerosis, the underlying mechanisms are still largely unknown [4]. It is believed that the prolonged, multifaceted neurohormonal activation seen during chronic exposure to stress may be harmful for the cardiovascular system [5]. Though inflammatory response is contained within the stress response, the exact mechanisms responsible for stress-modulated inflammatory responses remain to be elucidated. Accumulating evidence also indicates that atherosclerosis is the result of a prolonged and excessive inflammatory process in the vascular wall [6]. It is, therefore, important to inquire whether stressful psychosocial factors can initiate or participate in the inflammatory events that culminate in atherosclerosis. In the present study, we examined the effect of CMS on the development of atherosclerosis in apoE-/- mice, since this strain is very sensitive to the unpredictable CMS protocol and develops atheroma similar in type and distribution to that found in human even when fed on normal diet [7]. To investigate whether TLRs might be involved in the effect of CMS, we compare gene expression in aortas of stressed and unstressed mice using TLRs signaling pathway real-time PCR microarrays consisting of 87 genes.
Evidence is accumulating that TLR4 plays an important role in the pathogenesis of atherosclerosis and other diseases [2, 8–10]. In the first line of defence, TLR4 recognizes pathogen-associated molecular patterns (PAMPs) and activates the inflammatory cell via the NF-κB pathway [11]. The expression of TLR4 has been detected in various types of cells including T cells, monocytes, macrophages, and dendritic cells. MyD88 was first characterized as an essential component for the activation of innate immunity by all the TLRs [12]. Ligand binding to TLR4 results in the recruitment of the adaptor molecule MyD88 to the Toll/IL-1 receptor domain of the receptor. Intracellular propagation of the signal leads to NF-κB activation and subsequent induction of proinflammatory cytokines that have also been demonstrated in inflammation after subacute stress [13, 14]. In addition, mediators that have been isolated after stress have been identified as ligands for TLR4 [15]. Thus, there is a plausible linkage of TLR4 to the production of proinflammatory cytokines, which, in turn, contribute to atherosclerosis. However, prior research has not conclusively demonstrated a role for TLR4 in the onset of atherosclerosis induced by CMS. Limited evidence for a role of TLR4 pathway in cardiovascular disease in response to psychosocial stress comes from animal studies describing stress-induced TLR4 signaling pathway activation and subsequent NF-κB-dependent gene expression and neuroinflammation in the brain cortex of mice exposed to immobilization stress [16]. Therefore, TLR4-MyD88-NF-κB is a good candidate signaling pathway to convert psychosocial stress into cardiovascular diseases.
The aim of the present study was to examine the effect of CMS on the development of atherosclerosis in adolescent apoE-/- mice and investigate whether the TLR4 signaling pathway participates in the development of atherosclerosis in CMS mice. If this is true, it may provide an explanation for the approximately 40% of patients with atherosclerosis who have no other known risk factors [17].
2. Methods and Materials
2.1. Animals
One hundred twenty male apoE-/- mice (from Peking University, China), 4 weeks old, weighing approximately 16 g upon arrival at the animal facilities, served as subjects in the present study. They were kept in the experimental room a week before the onset of the experiment in order to familiarize them with the testing environment. All mice were housed five per small polycarbonate cage (8 × 13.5 × 8.1 cm) and maintained under equivalent conditions of temperature (23 ± 1°C), a 12-hour light-dark cycle (lights on at 7:00 AM and off at 7:00 PM), and relative humidity (55% to 60%). Food and water were available ad libitum, except before assessment of sucrose consumption. Mice were cared in accordance with the principles and guidelines of the Guide for the Care and Use of Laboratory Animals, China Council on Animal Care. All animal procedures were approved by the Animal Welfare Committee of University of south China.
2.2. Experimental Procedures
2.2.1. Sucrose Consumption
At the start of the experiment, mice were first trained to consume a 1% sucrose solution [18]. Sucrose consumption and body weight were monitored throughout the experiment. After a one-week period of adaptation, sucrose solution intake baseline tests were performed (two tests per 6 days) over a period of 12 days for all subjects. This was done in order to familiarize mice with the sucrose preference procedure. These tests involved an 8-hour period of food and water deprivation, followed by the offering of a sucrose solution for 1 hour. Intake was determined by weighing the bottles containing sucrose solution at the beginning and at the end of each test. After this phase (12 days), one group was housed under normal conditions (control mice, n = 60) and the other group (stressed mice, n = 60), was subjected to chronic mild stress.
2.2.2. Chronic Mild Stress Protocol
The stress scheme was slightly modified from that previously used for mice by Yalcin et al. [19] and consisted of the following: two periods of continuous overnight illumination, two periods (7 and 17 hours) of 45 degrees cage tile, one 17-hour period in a soiled cage (100 mL water in sawdust bedding), two periods (9 and 15 hours) of intermittent sound (a tone of 80 dB), three periods (7, 9, and 17 hours) of low-intensity stroboscopic illumination (150 flashes/min), and two periods of exposure to rat odour (removal of the cage containing the experimental mice into the procedure room and placing the experimental mice into cages in which rats had been held). The stressed mice received this stress protocol for 0 (n = 20), 4 (n = 20), and 12 weeks (n = 20). The control mice were housed under identical conditions in a separate room and had no contact with the stressed animals.
2.2.3. Body Weight
Before and during the unpredictable chronic mild stress, mice were weighted weekly from Week 0 (initial week) to Week 12 of the procedure every Monday.
2.2.4. Assessment of the Serum Corticosterone Concentration
The corticosterone concentrations of mice were measured at different stages of the procedure. 24 hours after the last test of sucrose intake, between 9:00 and 10:00 AM, approximately 0.20 mL of blood was drawn from the retro-orbital sinus. Animals received an intraperitoneal (i.p) injection of sterile isotonic saline (0.5 mL) after each collection and then were returned to their cages. Samples were centrifuged at 4°C for 30 minutes at 2500 rpm. Serum corticosterone concentration was determined by solid-phase 125I radioimmunoassay using a commercially available reagent, kit (Diagnostic Products, Los Angeles, CA). The assay sensitivity was 16 ng/mL, and the intra- and interassay coefficients of variation were 12.2% and 14.9%, respectively.
2.2.5. Analysis Lipid Profile
TC, LDLc, and TG concentrations were measured enzymatically using commercially available kits (abcam, ab65390). The assays were performed in accordance with the manufacturer's instructions.
2.2.6. Assessment of Atherosclerosis in Aortic Tree
Mice were fed a high-fat, high-cholesterol (atherogenic) diet containing 5% (wt/wt) fat and 1.0% cholesterol from 5 weeks of age through the duration of the experiment. After anesthesia with pentobarbital sodium, the mice were perfusion-fixed with 4% paraformaldehyde, and their aortic trees were removed including the brachiocephalic region, the carotid, and femoral branches. Whole aortas were cleaned of adventitia and opened longitudinally from the aortic arch to the iliac bifurcation, mounted en face, and stained for lipids with Soudan IV. Lesion areas were quantified with IMAGEPRO PLUS (Media Cybernetics, Silver Spring, MD). Image analysis was performed by a trained observer blinded to the experiment. The percent of the aortic surface covered by lesions was determined using an en face preparation.
2.2.7. Assessment of Atherosclerosis in Aortic Sinus
To determine cross-sectional lesion area, hearts were embedded in OCT compound (Tissue Tek, Sakura, Torrance, CA), frozen on dry ice, and then stored at −70°C until sectioning. Serial sections 6 μm thick were collected on slides for immunohistochemistry and staining with Oil red O as described earlier [20]. Cross sections of the aortic sinus and aortic valve were stained with Oil red O and counterstained with Gill III hematoxylin (Sigma). Lesion areas were quantified with IMAGEPRO PLUS (Media Cybnetics, Silver Spring, MD), Results are expressed as the average lesion size per section or as the percent of the total cross sectional vessel wall area (normal plus diseased area/section, excluding the lumen) stained with Oil red O. For each animal, the average of 12 sections was determined, and data are expressed as lesion size or mean percent lesion area ± SEM.
2.2.8. Immunohistochemistry
Frozen sections of apoE-/- mice aortic root were fixed with acetone for 5 minutes at room temperature and then immunostained with Rabbit antimouse TLR4 antibody (abcam, ab47093, 1 : 100) according to the instructions on DAB immunostaining kit. Rabbit IgG was used as a negative control.
2.2.9. Analysis of Gene Expression in Aorta Using Real-Time PCR Arrays
TLRs signaling pathway real-time PCR microarrays were purchased from SuperArray Bioscience Corporation (Frederick, MD, USA, catalog number: APMM-018) and were used according to the manufacturer's instructions. Briefly, Total RNA (n = 5 mice per group) was extracted from frozen aorta with TRIzol reagent (Invitrogen Canada Inc, Burlington, Canada) according to the manufacturer's protocol. Clean up of the RNA was carried out with a Qiagen RNeasy Mini Kit (Qiagen, Valencia, CA). First-strand cDNA was synthesized from 1.5 μg of total RNA in a final volume 20 μL using a Reaction Ready first strand cDNA synthesis kit (SuperArray Bioscience Corporation). After incubation at 65°C for 5 minutes and cooling down to 37°C for 8 minutes, RT cocktail was added to the annealing mixture and further incubated sequentially at 50°C for 60 minutes, 70°C for 15 minutes, then adding 91 μL of ddH2O to each 20 μL of cDNA synthesis reaction, mixed well, and holding the finished First Strand cDNA Synthesis Reaction on ice until the next step or store overnight at −20°C.
The 96-Well PCR Arrays were loaded with the following cocktails: 1275 μL 2 × SuperArray PCR mastermix, 102 μL diluted first strand cDNA synthesis reaction, 1173 μL of ddH2O. The Real-time PCR reaction (40 cycles) consisted of sequential incubations for 10 minutes at 95°C, 15 seconds at 95°C, and 1 minute at 60°C. Glyceraldehyde-3-phosphate dehydrogenase (GAPDH) and β-actin were amplified from all samples on each array as housekeeping genes to normalize expression levels of targets between different samples and to monitor assay reproducibility. Threshold cycle numbers (CT) were determined with BioRadi Cycler iQ Multicolor Real-Time PCR Detection System (version 1.1 software) and transformed using the ΔCT comparative method. Gene-specific expression values were normalized to expression values of GAPDH or β-actin (endogenous control) within each sample. Relative quantification was performed using the comparative method. The amount of target, normalized to an endogenous reference and relative to a calibrator, was determined by the comparative Ct method (ΔΔCT). If the fold change is greater than 1, then the result may be reported as a fold upregulation. If the fold change is less than 1, then the negative inverse of the result may be reported as a fold downregulation.
2.2.10. Western Blotting
Aortas were excised from killed mice, and then membranous proteins extracted were prepared from pooled arteries. Equal amounts of extracted proteins were separated by SDS-PAGE and transferred to nitrocellulose membranes (BioRad, Hercules, PA, USA). The primary antibodies used in this study were Rabbit antimouseTLR4 antibody (abcam, ab47093, 1 : 1000) and Rabbit antimouse NF-κB p65 (cell signaling technology, 3037, 1 : 1000). Immunodetection was accomplished using appropriate horseradish peroxidase-linked secondary antibodies (KPL, 074-1516) and enhanced chemiluminescence system (KPL). The blots were exposed to films (Fuji RX FUJIFILM, Tokyo, Japan). Protein levels were quantified by scanning densitometry using image-analysis systems.
2.2.11. Detection of MCP-1, sICAM-1, IL-1β, and TNF-α Production
The serum concentrations of MCP-1, sICAM-1, IL-1β, and TNF-α were measured utilizing a high-sensitivity enzyme-linked immunosorbent assay (R&D Systems, Inc) according to the manufacturer's instructions. The minimum detectable concentrations were <0.1 pg/mL for TNF-a, <3 pg/mL for IL-1β, <2.2 pg/mL for MCP-1, and 10 pg/mL for sICAM.
2.3. Statistical Analysis
The results were presented as mean ± SEM. The data were analyzed by two-way analysis of variance (ANOVA) with bonferroni correction and Student's t-test. Statistical significance was accepted when P < .05.
3. Results
3.1. Sucrose Preference Tests
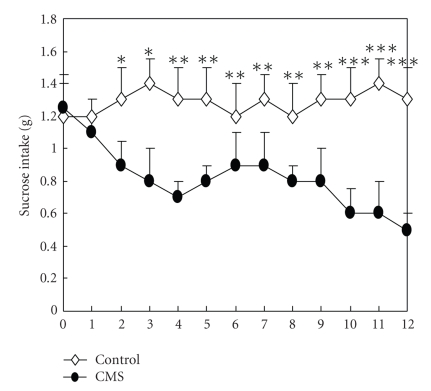
CMS induced a decrease in sucrose intake, relative to control conditions, which is indicative of operationally defined anhedonia. As shown in Figure 1, there was no baseline difference in sucrose intake between the two groups (P > .05). The control group did not show a significant difference in the consumption of the sucrose solution over a 12-week period. However, the CMS group gradually reduced the consumption of the sucrose solution from the second week to the twelfth week. Two-way ANOVA was performed on sucrose intake. As expected, there was a significant stress × week interaction on sucrose intake (F (12, 456) = 141.42, P < .001). A significant decrease in sucrose intake was observed in stress animals in comparison to controls, starting from the second week CMS (t (38) = 12.71, P < .05) and persisted during the third week (t (38) = 18.32, P < .05). There was a more significant decrease from the fourth week (t (38) = 27.68, P < .01) until the twelfth week (t (38) = 36.62, P < .001). An ANOVA performed on sucrose intake yielded a main effect of group (F (1,456) = 236.47, P < .01).
Figure 1.
1% sucrose solution preference in CMS and control groups (n = 20 per group) following different weeks of CMS. Sucrose intake was significantly reduced in the CMS group compared with the corresponding control group. There was a significant stress × week interaction on sucrose intake (n = 20, P < .001 by ANOVA). An ANOVA performed on sucrose intake yielded a main effect of group (P < .001). Values are means ± SEM. *P < .05, **P < .01, ***P < .001 versus respective CMS value.
3.2. Body Weight
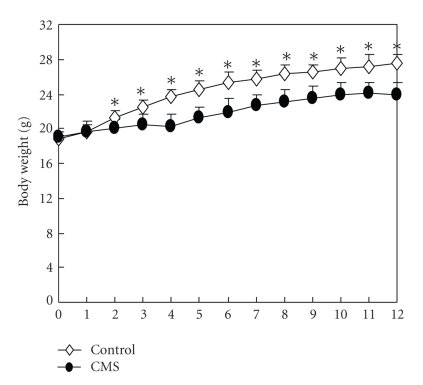
Body weight was statistically compared in both stressed and nonstressed mice with a mixed-design ANOVA. As expected, there was a main effect of Body weights increased over time in both CMS and control mice, but CMS mice weighed markedly less than the controls from week 3 until the end of experiment (P < .05), although the difference between the two groups was reduced after 4 weeks of repeated CMS. However, body weight gains of CMS mice remained similar to those of the control mice from week 5 to week 10, and thereafter the difference began to be reduced. Mean body weights of CMS and control groups are presented in Figure 2.
Figure 2.
Body weight (in grams) in CMS and control groups during the CMS period (n = 20 per group). All mice were weighted weekly from Week 0 (initial week) to Week 12 of the procedure every Monday following 12-hour period of food and water deprivation. Values are means ± SEM. *P < .05 versus the stressed group.
3.3. Serum Corticosterone Concentration
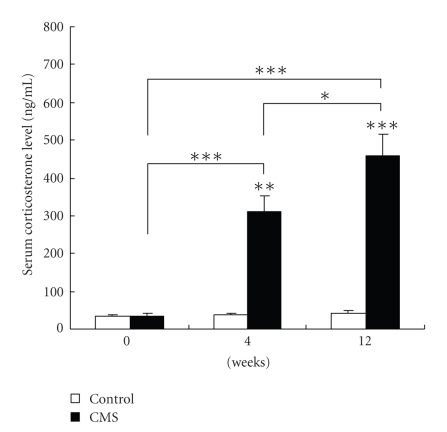
Corticosterone concentration was significantly higher in the CMS group than that in the control group (Figure 3). Serum corticosterone levels in all control animals were less than 100 ng/mL, but there was a great increase in serum corticosterone in stressed mice at different stage. The degree of increase in corticosterone concentration was related to the duration of stress such that there was an 11-fold increase in those mice exposed to 12 weeks of stress compared with controls (457.3 ± 56.5 ng/mL versus 40.2 ± 7.2 ng/mL).
Figure 3.
Serum corticosterone levels in CMS and control groups following at different weeks of CMS (n = 20 per group). Serum corticosterone concentrations were assayed using a radioimmunoassay (RIA). Corticosterone levels were higher in the CMS group versus the control group. Data are mean ± SEM. *P < .05, **P < .05, ***P < .001 versus respective control value.
3.4. Effect of CMS on the Lipid Profile of ApoE-/- Mice
Mean plasma total cholesterol (TC), triglyceride (TG), and low-density cholesterol (LDLc) levels were significantly elevated in apoE-/- mice exposed to CMS for 12 weeks (Table 1, P < .05), compared with control mice. Whereas plasma high-density cholesterol (HDLc) level in CMS was markedly lower than that in control mice (164.3 ± 15.8 mg/dL versus 293.8 ± 31.2 mg/dL).
Table 1.
Effect of CMS on plasma lipid levels of apoE-/- mice (mg/dL). Plasma lipid profiles in stressed and control mice were detected following 12-hour period of food and water deprivation at the week 12 (n = 20 per group). Data are mean ± SEM.
| 0 week | 4 weeks | 12 weeks | ||||
|---|---|---|---|---|---|---|
| Control | CMS | Control | CMS | Control | CMS | |
| TC | 461.33 ± 40.61 | 474.68 ± 42.23 | 1061.83 ± 92.37 | 1471.42 ± 163.23* | 1582.66 ± 181.21 | 2016.33 ± 242.71* |
| TG | 78.52 ± 4.74 | 80.27 ± 3.61 | 125.22 ± 16.74 | 211.56 ± 26.22* | 216.48 ± 22.51 | 386.27 ± 52.72* |
| HDLc | 69.26 ± 2.63 | 71.81 ± 4.26 | 186.38 ± 30.11 | 235.12 ± 22.72* | 293.83 ± 31.26 | 164.36 ± 15.87* |
| LDLc | 313.61 ± 34.22 | 322.62 ± 30.66 | 750.39 ± 81.23 | 1024.84 ± 142.47* | 1072.42 ± 136.94 | 1465.83 ± 164.46* |
*P < .05 versus the control group value.
3.5. CMS Effects on Aortic Atherosclerosis in ApoE-/- Mice
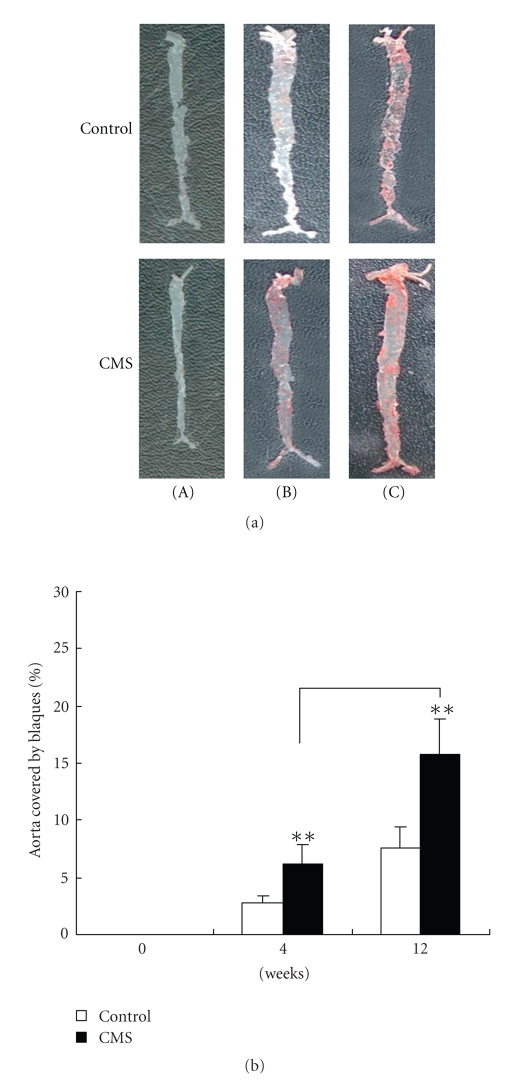
Exposure to CMS resulted in a significant increase in atherosclerotic lesions area in entire aortic trees of apoE-/- mice. The contribution of CMS to atherosclerosis at different stages of lesion development was studied in apoE-/- mice. As shown in Figure 4, Soudan IV staining was absent in the normal vessels obtained from control and CMS apoE-/- mice at 0 week (Figure 4(a).(A)). Whereas 4 weeks (Figure 4(a).(B)) or 12 weeks (Figure 4(a).(C)) later, lesions were observed throughout the aorta in both two groups, and lesions were more extensive in stressed mice compared with control mice. As shown in Figure 4(b), measurement of total aortic atherosclerotic lesion area by en face lipid staining revealed an increase by 121.14 ± 18.2% and 106.58 ± 14.43% aortas of mice exposured to CMS for 4, 12 weeks versus corresponding control mice, respectively, but no difference in en face lesion area was detected before mice exposured to CMS (at 0 week).
Figure 4.
CMS markedly increases the extent of aortic atherosclerosis development in apoE-/- mice. (A)–(C) Representative photographs of aortic sinuses from control apoE-/- (top) and CMS (bottom) apoE-/- mice. (a) Aortas of apoE-/- mice subjected to CMS or normal condition (control) for 0 week (A), 4 weeks (B), and 12 weeks (C) were isolated and stained for lipid deposition Soudan IV. Representative specimens from the two groups are shown. (b) Quantification of plaque areas in whole aortas in CMS and control apoE-/- mice stained for lipid deposition with Soudan IV. Each bar represents mean ± SEM (n = 10 per group). Total plaque area in CMS mice was significantly increased compared with corresponding control mice. **P < .01, ***P < .001 versus the control group.
3.6. CMS Effects on Aortic Sinus Atherosclerotic Lesion in ApoE-/- Mice
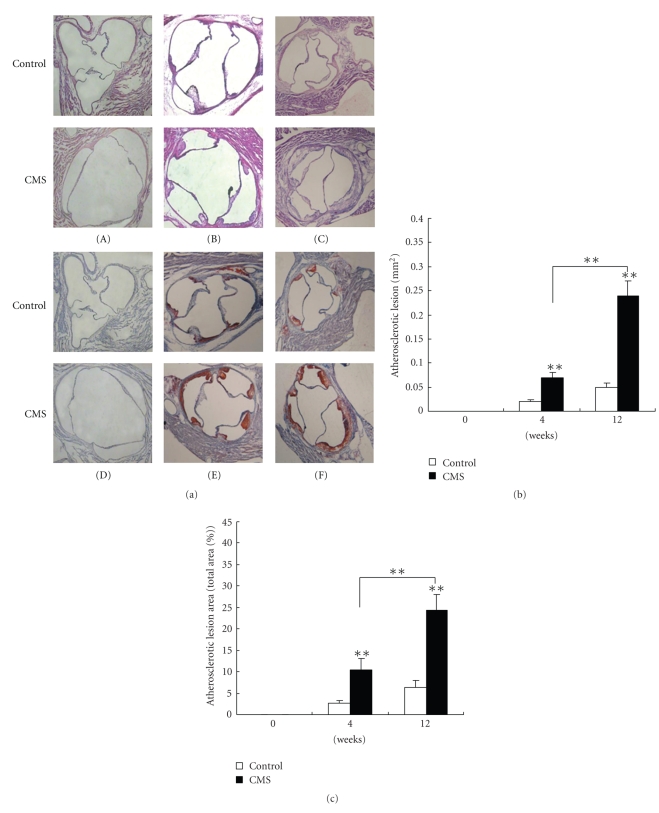
As shown in Figure 5(a)((A)–(F)), characterization of aortic sinus atherosclerotic lesions in CMS apoE-/- mice revealed a markedly increase in intimal thickening in all three subvalvular sectors, caused by increases in cellular and extracellular matrix elements within the intima. After 12 weeks fed on the atherogenic diet, the mean lesion area was 0.24 ± 0.03 mm2 in the stressed group; meanwhile the atherosclerotic lesion was only 0.05 ± 0.01 mm2 (P < .01) in the control group (Figure 5(b)). Furthermore, area of atheroma in aortic sinus increased linearly in response to duration of CMS exposure such that mice exposed to 12 weeks of stress had 3 times more atheroma than control mice (Figure 5(c), 24.16 ± 3.85% versus 6.35 ± 1.62%, P < .01), which indicated progression of atherosclerotic plaque formation in the stressed group.
Figure 5.
CMS markedly increases the extent of atherosclerosis development in aortic sinus of apoE-/- mice. (A)–(F) Representative photographs of aortic sinuses from control apoE-/- (top) and CMS (bottom) apoE-/- mice. 6 μm frozen sections of apoE-/- mice subjected to CMS or normal condition (control) for 0 week (A), (D), 4 weeks (B), (E), 12 weeks (C), (F) were stained with H&E (A)–(C) and oil red O (D)–(F), respectively. (b), (c) Quantification of plaque areas in aortic sinuses in CMS and control apoE-/- mice stained for lipid deposition with oil red O. Each bar represents mean ± SEM (n = 10 per group). Total plaque area in CMS mice was significantly increased compared with corresponding control mice. **P < .01, ***P < .001 versus the control group. (Magnification × 100).
3.7. Real-Time PCR Array Analysis of CMS Induced Gene Expression of TLRs Signaling Pathway
In this study, we first compared the gene expression pattern of TLRs signaling pathway in aorta of mice either exposed or not exposed to CMS. ApoE-/- mice aged 4 weeks were subjected to different durations of CMS, and aorta were harvested for total RNA isolation and subsequent Real-time PCR Array analysis. Genes with more than a twofold increase or decrease in their expression were considered significant in the selection criteria. To ensure that our data were reliable, we used five arrays per animal group. 43 of the 87 genes showed differential expression in the stressed mice when compared to the unstressed animals (Table 2(b)). Additionally, the changes in relative expression of some of these genes were verified by western blotting. We found that 15 genes were upregulated whereas 28 genes were downregulated. Because real-time PCR microarrays measure changes in mRNA levels, which may not always correlate with protein expression, we also assessed the differentially expressed genes for the TLR4 receptor and NF-kB by western blotting, IL-1β, TNF-α, MCP-1, and sICAM-1 by ELISA analysis.
Table 2.
CMS alters TLRs signaling pathway gene expression profile in aortas of apoE-/- mice. ApoE-/- mice 4 weeks old were subjected to a 24-hour CMS daily for 0, 4, 12 weeks. Mice were sacrificed, and aortas were harvested. Total RNA was extracted, and microarray analysis was determined as described under “materials and methods.” TLRs signaling pathway array consisting of 87 were used to analyze gene expression in aorta from mice with or without chronic mild stress. The microarrays were used according to the manufacturer's instructions. The table showed gene expression changes ≥2.0-fold versus control. Calculate the fold change for each gene from control group to stress group as 2-ΔΔCt. Among 87 genes analyzed, 15 genes were upregulated, and 28 genes were downregulated by CMS.
(a) Genes upregulated in aorta of mice exposure to CMS compared with control mice (n = 5).
| Well | Symbol | Description | Fold increase | P-value |
|---|---|---|---|---|
| A03 | Ccl2 | Chemokine (C-C motif) ligand 2 | 5.3 | .02 |
| A04 | Cd14 | CD14 antigen | 2.4 | .013 |
| A09 | Clec4e | C-type lectin domain family 4, member e | 3.88 | .026 |
| A10 | Csf2 | Colony stimulating factor 2 (granulocyte-macrophage) | 2.06 | .018 |
| C03 | Il1b | Interleukin 1 beta | 11.67 | .008 |
| C06 | Il6 | Interleukin 6 | 3.54 | .018 |
| C08 | Irak1 | Interleukin-1 receptor-associated kinase 1 | 2.78 | .016 |
| D12 | Myd88 | Myeloid differentiation primary response gene 88 | 3.62 | .032 |
| E04 | Nfkbib | Nuclear factor of kappa light chain gene enhancer in B-cells inhibitor, beta | 2.61 | .041 |
| E05 | Nfkbil1 | Nuclear factor of kappa light polypeptide gene enhancer in B-cells inhibitor-like 1 | 3.35 | .035 |
| E09 | Pglyrp1 | Peptidoglycan recognition protein 1 | 5.84 | .011 |
| F02 | Rela | V-rel reticuloendotheliosis viral oncogene homolog A (avian) | 2.17 | .031 |
| F11 | Tlr4 | Toll-like receptor 4 | 4.04 | .014 |
| G05 | Tnf | Tumor necrosis factor | 2.15 | .018 |
| H03 | Hsp90ab1 | Heat shock protein 90kDa alpha (cytosolic), class B member 1 | 2.05 | .012 |
(b) Genes downregulated in aorta of mice exposure to CMS compared with control mice (n = 5).
| Well | Symbol | Description | Fold decrease | P-value |
|---|---|---|---|---|
| A01 | Btk | Bruton agammaglobulinemia tyrosine kinase | −3.13 | .011 |
| A02 | Casp8 | Caspase 8 | −2.26 | .024 |
| A11 | Csf3 | Colony stimulating factor 3 (granulocyte) | −8.03 | .032 |
| B01 | Elk1 | ELK1, member of ETS oncogene family | −2.47 | .021 |
| B03 | Fos | FBJ osteosarcoma oncogene | −2.06 | .013 |
| C01 | Il12a | Interleukin 12A | −2.67 | .028 |
| C07 | Il6ra | Interleukin 6 receptor, alpha | −2.9 | .022 |
| C09 | Irak2 | Interleukin-1 receptor-associated kinase 2 | −2.08 | .037 |
| C11 | Irf3 | Interferon regulatory factor 3 | −4.33 | .019 |
| C12 | Jun | Jun oncogene | −2.06 | .042 |
| D01 | Lta | Lymphotoxin A | −13.13 | .011 |
| D02 | Muc13 | Mucin 13, epithelial transmembrane | −2.12 | .016 |
| D10 | Mapk8ip3 | Mitogen-activated protein kinase 8 interacting protein 3 | −6.89 | .027 |
| E02 | Nfkb2 | Nuclear factor of kappa light polypeptide gene enhancer in B-cells | −2.06 | .036 |
| E06 | Nfrkb | Nuclear factor related to kappa B binding protein | −4.94 | .012 |
| E07 | Nr2C2 | Nuclear receptor subfamily 2, group C, member 2 | −3.24 | .028 |
| E08 | Peli1 | Pellino 1 | −2.45 | .023 |
| F01 | Mapk8 | Mitogen-activated protein kinase 8 | −2.34 | .026 |
| F05 | Ticam1 | Toll-like receptor adaptor molecule 1 | −24.17 | .003 |
| F06 | Ticam2 | Toll-like receptor adaptor molecule 2 | −2.4 | .044 |
| F08 | Tlr1 | Toll-like receptor 2 | −2.05 | .032 |
| F12 | Tlr5 | Toll-like receptor 5 | −6.57 | .026 |
| G04 | Tlr9 | Toll-like receptor 9 | −5.37 | .022 |
| G06 | Tnfaip3 | Tumor necrosis factor, alpha-induced protein 3 | −4.81 | .023 |
| G10 | Traf6 | Tnf receptor-associated factor 6 | −2.52 | .034 |
| G11 | Ube2n | Ubiquitin-conjugating enzyme E2N | −2.39 | .028 |
| H04 | Gapdh | Glyceraldehyde-3-phosphate dehydrogenase | −3.26 | .032 |
| H05 | Actb | Actin, beta, cytoplasmic | −2.63 | .025 |
3.8. Effect of CMS on TLR4 and NF-κB Expressions in Aorta of ApoE-/- Mice
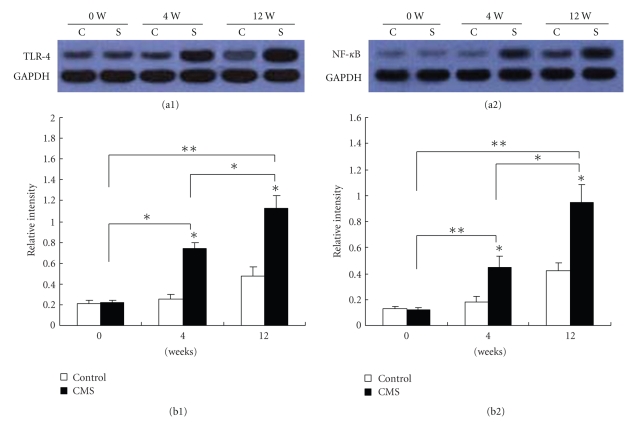
Western blotting with an Ab against TLR4 and NF-κB showed reactive protein bands at the size of TLR4 (73 kDa) and NF-κB p65 (80 kDa) in aortas of chronic mild stress and control groups following different weeks of CMS. As demonstrated in Figure 6, TLR4 and NF-κB protein levels in mice subjected to 4 and 12 weeks chronic mild stress were more abundant compared with that in the corresponding control group mice, consistent with the mRNA pattern (Table 2(a)). Thus, both protein and mRNA of TLR4 and NF-κB p65 were more abundant in CMS mice than that in control mice, respectively (P < .05, P < .01). In Figure 6(b(1)) a mean relative intensity of TLR4 in CMS mice was stronger than that in control mice (P < .05, P < .01).
Figure 6.
Validation of changes in TLR-4 (73 KD) and NF-κB p65 (80 kDa) protein expression by western blotting. Proteins extracted were prepared from arteries (n = 6) of mice subjected to CMS or normal conditions for 0, 4, and 12 weeks, respectively. Each lane shows representative western blots using anti-TLR4 or NF-κB p65 and anti-GAPDH bodies in (a1) and (a2), respectively. Each panel summarizes densitometric readings of band intensities normalized to GAPDH, which was measured by densitometry with Image J image analysis software. (b1), (b2) densitometric measurements TLR4 and NF-κB p65 from Western blots, respectively. Data are mean ± SEM. C: control group; S: chronic mild stress group (n = 6 per group). *P < .05, **P < .01 compared with the control. The data are representative of three experiments.
3.9. The Expression of TLR4 Was Upregulated in Atherosclerotic Lesions of the Stressed ApoE-/- Mice
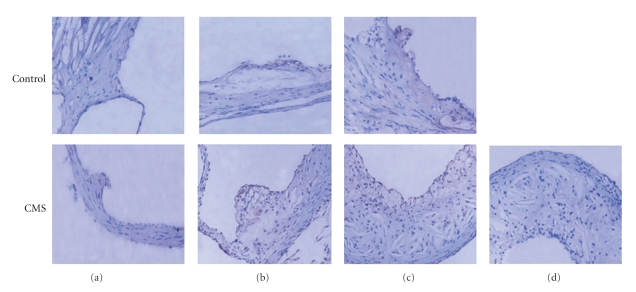
As shown in Figure 7, there is only minimal immunoreactivity to TLR4 in nonatherosclerotic aortic sinus of apoE-/- mouse. TLR4 immunoreactivity was markedly observed in the aortic root atherosclerotic lesions, and TLR4 expression (brown staining) observed around the lipid core and at the shoulder of lipid-rich plaques of mice subjected to CMS for 4 and 12 weeks was much stronger than that of control mice at the same stage. Rabbit IgG staining was negative, indicating the specific nature of the TLR4 immunostaining.
Figure 7.
(a)–(c) Immunohistochemical evidence for TLR-4 expression within atherosclerotic plaque of aortic sinuses from control apoE-/- (top) and CMS (bottom) apoE-/- mice. 5 μm frozen sections of the apoE-deficient mouse aortic root were fixed with acetone for 5 minutes at room temperature and then immunostained with Rabbit antimouseTLR4 antibody (1 : 100). Rabbit IgG was used as a negative control. (a)–(c) represent TLR-4 expression within aortic sinus of apoE-/- mice exposed to normal condition (control) or CMS for 0 week, 4, and 12 weeks, respectively (brown staining); (d) represents rabbit IgG staining for negative control. In (a) there is minimal immunoreactivity to TLR-4 in nonatherosclerotic aortic sinus of apoE-/- mouse (magnification × 400).
3.10. ELISA Analysis of Cytokines
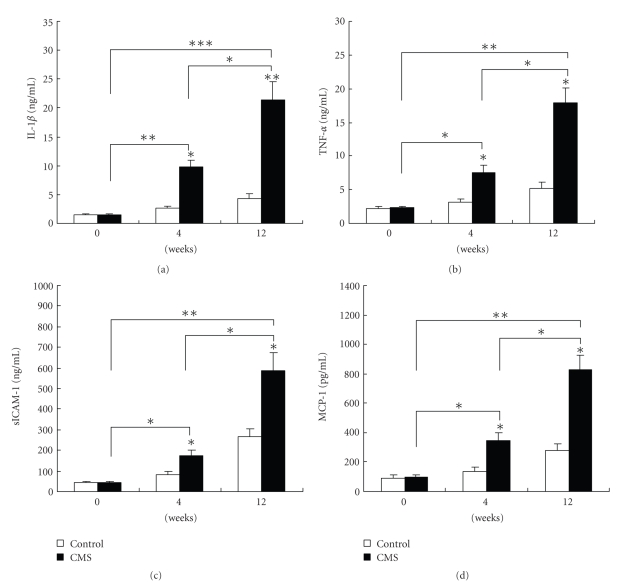
The results showed that the mean secretion of cytokine IL-1β in the stressed group was significantly higher than that in the corresponding control group after fed an atherogenic diet for 4 and 12 weeks, respectively (Figure 8). MCP-1, sICAM-1, and TNF-a levels in the serum of apoE-/- mice were also measured, as shown in Figure 8; similar results could be collected for the secretion of those cytokines compared with controls. The secretion levels for those cytokines between the normal control and the stressed group had significant difference.
Figure 8.
MCP-1, sICAM-1, and TNF-a levels in the serum of apoE-/- mice were analyzed by ELISA. IL-1β (a), TNF-a (b), sICAM-1 (c), and MCP-1 (d) levels markedly increased in the serum of apoE mice following different weeks of CMS compared with the corresponding control group (n = 20 per group). These cytokines were measured by ELISA according to the manufacturer's instructions. Data are mean ± SEM. *P < .05, **P < .01, ***P < .01 versus respective control value.
4. Discussion
The major finding in this study was that exposure to CMS did influence atherosclerosis in apoE-/- mice. Importantly, in the present study, we found that CMS mice showed a significant increase in gene expression of TLR4 pathway compared with age-matched control mice. Our CMS-protocol was proven effective in markedly increasing the serum corticosterone levels and decreasing the consumption of the sucrose solution.
In the present study, concomitant with lesion progression in CMS apoE-/- mice, we demonstrated a markedly increased in the expression of TLR4, MyD88, and NF-kB mRNA in the arterial lesions of these mice. Interestingly, the increased expression of TLR4 mRNA was specific, while the expression of the other 8 TLRs was either downregulated or unchanged in the CMS model. This result indicates that a differential physiological regulation of the several members of the TLRs family occurs. In this study, we were particularly interested in TLR4 signal transduction, because the gene plays an important role in the development of atherosclerosis and involves in restraint stress-mediated immune alterations [8–10, 21]. We also found that mice exposed to CMS showed great increases in atherosclerosis lesions compared with control ones. Our findings are consistent with Kumari's results [22]. To demonstrate that at this local level the TLR4-MyD88-NF-kB signaling pathway is functional, we investigated MCP-1, TNF-α, IL-1β, and sICAM-1 levels in the serum of apoE-/- mice, since these are known to be produced through the TLR4-MyD88-NF-kB-dependent pathway [23]. We found that all four were significantly increased in CMS mice, consistent with the expression of TLR4, MyD88, and NF-kB. Therefore, these data demonstrated that CMS at least partly caused system inflammation and exacerbated atherogenesis by activation of TLR4 signaling pathway.
Recently, the TLR4-MyD88-NF-kB pathway has been suggested as a link between inflammation and atherosclerosis [24]. TLR4 is a key signaling receptor of innate immunity because it senses the presence infectious agents and initiates a proinflammatory signaling cascade. After binding to the ligand, TLR4 engages a downsream cascade of signaling molecules, including the adaptor MyD88, leading to the activation of two distinct signaling pathways and finally to the activation of two distinct signaling pathways. The activation of NF-kB leads to the synthesis of a number of proinflammatory mediators. Particularly, the chemokines IL-1β, TNF-α, IL-6, ICMA-1, and MCP-1 were highly upregulated after exposure to chronic mild stress [14]. These chemokines are chemoattractants of monocytes and T cells, which have been described in association with atherosclerotic disease [25]. In this study, we found a considerable monocytes and lymphocytes under the vascular adventitia of CMS mice. These data suggested that stress-induced high leveles of MCP-1 and ICAM-1 might play important roles in early atherogenesis in CMS mice. Proliferation and migration of smooth muscle cells (SMCs) are considered an important event in the development of atherosclerosis. A number of the cytokines that we observed to be upregulated in adventitial fibroblasts after TLR4 activation (IL-1β, IL-6) influence smooth muscle proliferation and/or migration [26]. Our results demonstrated that CMS induced by the production of these cytokines might not be through p38 and JNK pathway but through the NF-kB pathway, since the result has been demonstrated by evidence that Jun, Fos, and MAPK mRNA expressions were markedly downregulated, while MyD88 and Rela mRNA were greatly upregulated. These data implied involvement of the TLR4-MyD88-NF-kB-dependent pathway in the CMS-induced atherosclerosis in apoE-/- mice.
Michelsen et al. [27] reported that Lack of TLR4 or MyD88 reduced atherosclerosis and alters plaque phenotype in apoE-/- mice. Our previous studies also showed that Epigallocatechin-3-gallate, which is a blocking agent of TLR4 pathway, inhibited the development of atherosclerosis in apoE-/- mice effectively. Caso et al. found that TLR4 was involved in the inflammatory response after subacute stress [14]. Therefore, there is evidence supporting the importance of TLR4 signaling pathway-induced proinflammatory cytokins in atherosclerosis in CMS mice.
Evidence suggests that not only exogenous but also endogenous ligands [28] can activate TLR4. As endogenous ligands can also trigger TLR4, it is possible that this receptor plays a role in atherosclerotic lesion development in the absence of pathogens. These endogenous ligands for TLR4 are mostly produced during stress, such as heat shock proteins (HSPs), oxLDL, and EDA domain of fibronectin. It has been demonstrated recently that oxLDL and HSPs upregulate the expression of proinfammatory cytokines through activation of TLRs, and a wide variety of stressful stimuli can increase the intracellular synthesis of these proteins. Moreover, there is evidence that both glucocorticoids and catecholamines contribute to HSPs response in psychological stress situations [29]. Our data revealed that HSP90 mRNA expression was greatly increased in CMS mice. Furthermore, our previous study demonstrated that basal TLR-4 mRNA expression in human monocyte-derived macrophages was upregulated by ox-LDL and HSP90 in vitro. Together, these data suggested that CMS-induced HSP90 acted as an endogenous ligand for TLR4 to activate TLR4 signaling pathway. These findings perhaps can explain a significant increase in gene expression of TLR4 pathway and higher inflammatory response found in CMS mice.
Plasma corticosterone levels are very sensitive to rapid release of corticosterone due to handling stress. Our serum corticosterone data are consistent with Kumari's results showing that CMS induced a marked (10-fold) increase in corticosterone levels in plasma [21]. Elevation of corticosterone, which induced by stress, would contribute to endothelial damage, recruitment, endothelial adhesion, and perhaps transmigration of inflammatory cells, especially monocytes. Elevated corticosterone can induce an atherogenic lipid profile similar to the dyslipidemia that may be present in patients with atherosclerosis [30]. Recruitment of monocytes which adhere to and permeate the arterial wall is one of the earliest steps in the progression of atherosclerosis. We also found that CMS produced the more aggravated atherogenic lipid profile. We consider now the important changes in lipid metabolism that occur with stress due, in large part, to the stress hormones. Thus, it appears that a marked increase in plasma corticosterone levels can accelerate atherosclerosis.
In summary, the present study raises the possibility that TLR4-MyD88-NF-κB pathway may play a critical role in CMS-induced prolonged and excessive inflammatory process in the vascular wall that culminated in atherosclerosis. Significantly, genes in the TLRs signaling pathway we detected as regulated in CMS-induced atherosclerosis in apoE-/- mice have not been reported by others so far. Our results of this study should motivate future studies using TLR4/apoE double knockout mice to test to what degree CMS is linked with development of atherosclerosis.
Acknowledgment
The authors gratefully acknowledge the financial support from the National Natural Sciences Foundation of China (30470720), Post-Doctor Sciences Foundation of China (2005037157), and Hunan Provincial Natural Sciences Foundation of China (06jj5058).
References
- 1.Rozanski A, Blumenthal JA, Kaplan J. Impact of psychological factors on the pathogenesis of cardiovascular disease and implications for therapy. Circulation. 1999;99(16):2192–2217. doi: 10.1161/01.cir.99.16.2192. [DOI] [PubMed] [Google Scholar]
- 2.Xu XH, Shah PK, Faure E, et al. Toll-like receptor-4 is expressed by macrophages in murine and human lipid-rich atherosclerotic plaques and upregulated by oxLDL. Circulation. 2001;104(25):3103–3108. doi: 10.1161/hc5001.100631. Article ID 10.1161/hc5001.100631. [DOI] [PubMed] [Google Scholar]
- 3.Kaplan JR, Manuck SB, Clarkson TB, et al. Social stress and atherosclerosis in normocholesterolemic monkeys. Science. 1983;220(4598):733–735. doi: 10.1126/science.6836311. [DOI] [PubMed] [Google Scholar]
- 4.Bierhaus A, Wolf J, Andrassy M, et al. A mechanism converting psychosocial stress into mononuclear cell activation. Proceedings of the National Academy of Sciences of the United States of America. 2003;100(4):1920–1925. doi: 10.1073/pnas.0438019100. [DOI] [PMC free article] [PubMed] [Google Scholar]
- 5.Rozanski A, Blumenthal JA, Davidson KW, et al. The epidemiology, pathophysiology, and management of psychosocial risk factors in cardiac practice: the emerging field of behavioral cardiology. Journal of American College of Cardiology. 2005;45(5):637–651. doi: 10.1016/j.jacc.2004.12.005. [DOI] [PubMed] [Google Scholar]
- 6.Kaperonis EA, Liapis CD, Kakisis JD, et al. Inflammation and atherosclerosis. European Journal of Vascular and Endovascular Surgery. 2006;31(4):386–393. doi: 10.1016/j.ejvs.2005.11.001. [DOI] [PubMed] [Google Scholar]
- 7.Carmeliet P, Moons L, Collen D. Mouse models of angiogenesis, arterial stenosis, atherosclerosis and hemostasis. Cardiovascular Research. 1998;39(1):8–33. doi: 10.1016/s0008-6363(98)00108-4. [DOI] [PubMed] [Google Scholar]
- 8.Mullick A, Tobias P, Curtiss L. Toll-like receptors and atherosclerosis. Immunologic Research. 2006;34(3):193–209. doi: 10.1385/IR:34:3:193. [DOI] [PubMed] [Google Scholar]
- 9.Schoneveld AH, Hoefer I, Sluijter JP, Laman JD, de Kleijn DPV, Pasterkamp G. Atherosclerotic lesion development and Toll like receptor 2 and 4 responsiveness. Atherosclerosis. 2008;197(1):95–104. doi: 10.1016/j.atherosclerosis.2007.08.004. [DOI] [PubMed] [Google Scholar]
- 10.Liu Y, Yu H, Zhang Y, et al. TLRs are important inflammatory factors in atherosclerosis and may be a therapeutic target. Medical Hypotheses. 2008;70(2):314–316. doi: 10.1016/j.mehy.2007.05.030. [DOI] [PubMed] [Google Scholar]
- 11.Dirks SH, van Deventer SJH, Peppelenbosch MP. Lipopolysaccharide recognition, internalisation, signaling and other cellular effects. Journal of Endotoxin Research. 2001;7(5):335–348. [PubMed] [Google Scholar]
- 12.Fitzgerald KA, Palsson-McDermott EM, Bowie AG, et al. Mal (MyD88-adapter-like) is required for Toll-like receptor-4 signal transduction. Nature. 2001;413(6851):78–83. doi: 10.1038/35092578. [DOI] [PubMed] [Google Scholar]
- 13.Zhang G, Ghosh S. Toll-like receptor-mediated NF-kappaB activation: a phylogenetically conserved paradigm in innate immunity. The Journal of Clinical Investigation. 2001;107(1):13–19. doi: 10.1172/JCI11837. [DOI] [PMC free article] [PubMed] [Google Scholar]
- 14.Caso JR, Pradillo JM, Hurtado O, Leza JC, Moro MA, Lizasoain I. Toll-like receptor 4 is involved in subacute stress-induced neuroinflammation and in the worsening of experimental stroke. Stroke. 2008;39(4):1314–1320. doi: 10.1161/STROKEAHA.107.498212. [DOI] [PubMed] [Google Scholar]
- 15.Lewthwaite J, Owen N, Coates A, et al. Circulating human heat shock protein 60 in the plasma of British civil servants:relationship to physiological and psychosocial stress. Circulation. 2002;106(2):196–201. doi: 10.1161/01.cir.0000021121.26290.2c. [DOI] [PubMed] [Google Scholar]
- 16.Tanga FY, Nutile-McMenemy N, DeLeo JA. The CNS role of Toll-like receptor 4 in innate neuroimmunity and painful neuropathy. Proceedings of the National Academy Sciences of the United States of America. 2005;102(16):5856–5861. doi: 10.1073/pnas.0501634102. [DOI] [PMC free article] [PubMed] [Google Scholar]
- 17.Matthews KA, Owens JF, Kuller LH, et al. Stress-induced pulse pressure change predicts women's carotid atherosclerosis. Stroke. 1998;29(8):1525–1530. doi: 10.1161/01.str.29.8.1525. [DOI] [PubMed] [Google Scholar]
- 18.Kopp C, Vogel E, Rettori MC, et al. The effects of melatonin on the behavioural disturbances induced by chronic mild stress in C3H/He mice. Behavioural Pharmacology. 1999;10(8):73–83. doi: 10.1097/00008877-199902000-00007. [DOI] [PubMed] [Google Scholar]
- 19.Yalcin I, Aksu F, Belzung C. Effects of desipramine and tramadol in a chronic mild stress mode in mice are altered by yohimbine but not by pindolol. European Journal of Pharmacology. 2005;514(2-3):165–174. doi: 10.1016/j.ejphar.2005.03.029. [DOI] [PubMed] [Google Scholar]
- 20.Bourassa PA, Milost PM, Gaynor BJ, Breslow JL, Aiello RJ. Estrogen reduces atherosclerotic lesion development in apolipoprotein E-deficient mice. Proceedings of the National Academy Sciences of the United States of America. 1996;93(19):10022–10027. doi: 10.1073/pnas.93.19.10022. [DOI] [PMC free article] [PubMed] [Google Scholar]
- 21.Zhang Y, Woodruff M, Miao J, et al. Toll-like receptor 4 mediates chronic restraint stress-induced immune suppression. Journal of Neuroimmunology. 2008;194(1):115–122. doi: 10.1016/j.jneuroim.2007.12.002. [DOI] [PMC free article] [PubMed] [Google Scholar]
- 22.Kumari M, Grahame-Clarke C, Shanks N, Marmot M, Lightman S, Vallance P. Chronic stress accelerates atherosclerosis in the apolipoprotein E deficient mouse. Stress. 2003;6(4):297–299. doi: 10.1080/10253890310001619461. [DOI] [PubMed] [Google Scholar]
- 23.Pasterkamp G, Van Keulen JK, De Kleijn DP. Role of Toll-like receptor 4 in the initiation and progression of atherosclerotic disease. European Journal of Clinical Investigation. 2004;34(5):297–299. doi: 10.1111/j.1365-2362.2004.01338.x. [DOI] [PubMed] [Google Scholar]
- 24.de Winther MP, Kanters E, Kraal G, Hofker MH. Nuclear factor κB signaling in atherogenesis. Atherosclerosis, Thrombosis, and Vascular Biology. 2005;25(5):904–914. doi: 10.1161/01.ATV.0000160340.72641.87. [DOI] [PubMed] [Google Scholar]
- 25.Reape TJ, Groot PH. Chemokines and atherosclerosis. Atherosclerosis. 1999;147(2):213–225. doi: 10.1016/s0021-9150(99)00346-9. [DOI] [PubMed] [Google Scholar]
- 26.Barillari G, Albonici L, Incerpi S, et al. Inflammatory cytokines stimulate vascular smooth muscle cells locomotion and growth by enhancing alpha5beta1 integrin expression and function. Atherosclerosis. 2001;154(2):377–385. doi: 10.1016/s0021-9150(00)00506-2. [DOI] [PubMed] [Google Scholar]
- 27.Michelsen KS, Wong MH, Shah PK, et al. Lack of toll-like receptor 4 or myeloid differentiation factor 88 reduces atherosclerosis and alters plaque phenotype in mice deficient in apolipoprotein E. Proceedings of the National Academy of Sciences of the United States of America. 2004;101(29):10679–10684. doi: 10.1073/pnas.0403249101. [DOI] [PMC free article] [PubMed] [Google Scholar]
- 28.Miller YI, Viriyakosol S, Worrall DS, Boullier A, Butler S, Witztum JL. Toll-like receptor 4-dependent and -independent cytokine secretion induced by minimally oxidized low-density lipoprotein in macrophages. Arteriosclerosis, Thrombosis, and Vascular Biology. 2005;25(6):1213–1219. doi: 10.1161/01.ATV.0000159891.73193.31. [DOI] [PubMed] [Google Scholar]
- 29.Čvoro A, Matić G. Hyperthermic stress stimulates the association of both constitutive and inducible isoforms of 70 kDa heat shock protein with rat liver glucocorticoid receptor. The International Journal of Biochemistry and Cell Biology. 2002;34(3):279–285. doi: 10.1016/s1357-2725(01)00117-0. [DOI] [PubMed] [Google Scholar]
- 30.Black PH, Garbutt LD. Stress, inflammation and cardiovascular disease. Journal of Psychosomatic Research. 2002;52(1):1–23. doi: 10.1016/s0022-3999(01)00302-6. [DOI] [PubMed] [Google Scholar]


