Abstract
It has been known for a long time that, in order to reconstruct a streak-free image in tomography, the sampling of view angles should satisfy the Shannon/Nyquist criterion. When the number of view angles is less than the Shannon/Nyquist limit, view aliasing artifacts appear in the reconstructed images. Most recently, it was demonstrated that it is possible to accurately reconstruct a sparse image using highly undersampled projections provided that the samples are distributed at random. The image reconstruction is carried out via an ℓ1 norm minimization procedure. This new method is generally referred to as compressed sensing (CS) in literature. Specifically, for an N × N image with S significant image pixels, the number of samples for an accurate reconstruction of the image is O(S ln N). In medical imaging, some prior images may be reconstructed from a different scan or from the same acquired time-resolved data set. In this case, a new image reconstruction method, Prior Image Constrained Compressed Sensing (PICCS), has been recently developed to reconstruct images using a vastly undersampled data set. In this paper, we introduce the PICCS algorithm and demonstrate how to use this new algorithm to solve problems in medical imaging.
Introduction
It is no exaggeration to say that the Shannon/Nyquist sampling criterion is the foundation of information science. It also plays a pivotal role in modern medical tomographic imaging modalities such as magnetic resonance imaging (MRI) and computed tomography (CT). When the number of samples in Fourier space is less than the requirement of Shannon/Nyquist limit, streaking artifacts appear in the reconstructed images.
In practice, the Shannon/Nyquist sampling criterion is often intentionally or inevitably violated. For example, in order to shorten the data acquisition time in time-resolved MRI angiography, the undersampled radial acquisition methods were introduced. It has been demonstrated (1,2) that an undersampling factor of 4–6 is acceptable in practice to generate a clinically usable image in two dimensions (2D) imaging. In three dimensions (3D), it has been demonstrated that the undersampling factor can be as high as hundreds (3). When the above radial data acquisition schemes are combined with a new approximate image reconstruction method (4), it has been demonstrated that the higher undersampling factor is also achievable. In this example, the undersampling schemes are intentionally introduced to accelerate the data acquisition while the streaking artifacts are controlled within an acceptable level.
In contrast, undersampling pattern is inevitable in four-dimensional cone-beam CT (4D CBCT) in image-guided radiation therapy (5–13). In this case, cone-beam projection data are acquired over 10–15 respiratory cycles during a 60 seconds gantry rotation time. The data are then retrospectively gated into 8–10 phases using the synchronized respiratory signals recorded during the data acquisition. After the respiratory gating, fewer than 100 cone-beam projections are left for the reconstruction of each respiratory phase. Consequently, streaking artifacts are rampant in the reconstructed images. The undersampling streaking artifacts pose a major challenge in 4D CBCT and limit the use of 4D CBCT in clinical practice.
Note that the data acquisition methods are significantly different in the aforementioned two examples: the Fourier coefficients are measured in MRI while the line integrals are measured in 4D CBCT. However, the challenge in image reconstruction is common in these two cases: image reconstruction using an undersampled data set. Different approximate image reconstruction methods must be introduced in medical imaging community to reconstruct clinically acceptable images from the highly undersampled data sets.
Recently, the mathematical community also started to address the question of under what conditions an image can be accurately reconstructed from an undersampled projection data set. It has been mathematically proven that a sparse image can be exactly reconstructed with probability approaching one from an undersampled data set by solving a certain minimization problem (14,15). If there are S significant pixels in an N × N image, then the order of S ln N Fourier samples are sufficient to accurately reconstruct the image via an ℓ1 norm minimization procedure. In the mathematical proof of the theorem, the Fourier samples are assumed to be uniformly sampled at random. Although this condition is difficult to satisfy in practice, numerical simulations (14) and some experimental studies in MRI demonstrate that the ℓ1 norm minimization procedure also enables very accurate image reconstruction using deterministic (16) or pseudorandom Fourier samples (17,18). Recently, numerical simulations have also been conducted to demonstrate that the ℓ1 norm minimization is a useful method for image reconstruction in x-ray CT (19, 32) and tomosynthesis (21–24). The image reconstruction method via the ℓ1 norm minimization has been referred to as compressed sensing (CS) in literature. Note that the ℓ1 norm minimization procedure has also been proposed to reconstruct sparse image object in medical imaging (20) before the rigorous proof of the mathematical theorem.
In dynamical data acquisitions such as the aforementioned MRI and 4D CBCT, a prior image is either directly available such as a CT image volume acquired in treatment planning stage (different acquisitions) or can be reconstructed using part of or the entire dynamical data set (same acquisition). The prior image has been demonstrated to be useful to reconstruct high SNR images in both 4D CBCT (10,12) using image registration and MRI (4) using an approximate image reconstruction method. It has been demonstrated that the SNR is dominated by the prior image when the prior image is appropriately utilized. This feature overcomes the fundamental SNR limitation when a highly undersampled data set is utilized in image reconstruction.
Most recently, the prior image has been incorporated into the CS image reconstruction framework to enable higher undersampling factors (25). This generalized compressed sensing image reconstruction framework was referred to as Prior Image Constrained Compressed Sensing (PICCS) (25). The PICCS algorithm combines the advantages of the mathematical exactness of the compressed sensing (CS) theory and the potential gain in SNR when the prior images are appropriately incorporated into image reconstruction (4, 10). In this paper, we review the PICCS algorithm and demonstrate how to use PICCS algorithm in x-ray CT. The PICCS algorithm can be readily adapted to other image modality by modifying the forward projection model which is used to impose the data consistency condition.
Methods and Materials
Essentially, an image reconstruction algorithm is a series of numerical steps to estimate the image from the measured samples. The result is denoted by X. The image reconstruction should fulfill the following consistency condition:
| (1) |
The vector P describes the measured samples and M is a system matrix to describe the data acquisition process. For example, the system matrix can be either a reprojection operation in CT or a Fourier transform in MRI. For other image modality such as photoacoustic imaging, the system matrix should be changed to correctly describe the physics of data acquisition method. When an image is faithfully reconstructed, then the forward operation should mimic the true data acquisition procedure to generate a correct estimate of the measured projection data.
Algebraic Image Reconstruction Technique (ART)
When the measured data are well sampled, analytical image reconstruction algorithms have been developed to reconstruct images. However, when the view angles are undersampled, iterative image reconstruction algorithms are often introduced to estimate the images from the measured projection data. Algebraic image Reconstruction Technique (ART) is one of the simplest methods to iteratively reconstruct image from measured projections (26). In ART, an image is estimated iteratively to satisfy the consistency condition Eq. (1) in the least square sense. Namely, an image is estimated by minimizing the following an ℓ2 norm objective function:
| (2) |
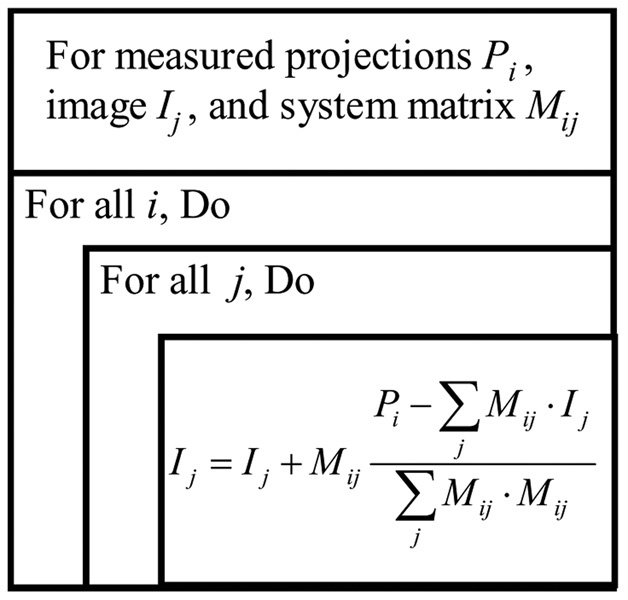
Let Pl denote the measured projection for the l-th ray; let In denote the value of the n-th pixel of the image matrix. Let Mln denote the length of the intersection segment of the l-th ray and the n-th pixel. The image reconstruction procedure is shown in Figure 1.
Figure 1.
Flow chart of ART reconstruction method.
Compresses Sensing
In the newly proposed compressed sensing (CS) image reconstruction theory (14, 15), a sparse image is reconstructed iteratively by minimizing the ℓ1 norm of the sparse image while the data consistency condition Eq. (1) is imposed. There are three enabling factors in the original CS theory: (i) an image itself or the appropriately transformed (/sparsified) image must be sparse; (ii) image must be reconstructed using a nonlinear method; and (iii) the view aliasing artifacts generated by a standard linear reconstruction method must be incoherent when the sparsifying transform in Eq. (3) is applied. In order to satisfy the condition (iii), the view angles were assumed to be uniformly distributed at random (14, 15). However, this condition was relaxed by introducing a coherence measurement (29). Namely, if the perfect incoherence is not achieved, more projections are required to accurately reconstruct the image. When an image is not sufficiently sparse, a sparsifying transform can be applied to the image. Denote Ψa linear operator to transform an image X from the standard pixel representation to a sparse representation, the theory of CS image reconstruction is summarized to iteratively solve the following constrained minimization problem:
| (3) |
The frequently used sparsifying transforms (Ψ) are wavelet transforms, the first order and/or the second finite difference of the image, or some more complicated transforms in mathematics (14, 15). Even if the more complicated sparsifying transforms are utilized, the inclusion of the total variation of the image,TV(X), as a penalty term has been found to be useful. Thus, Eq. (3) is modified as:
| (4) |
Here, the ℓ1 norm is defined as the summation of the absolute value of all function values, i.e., . The total variation term, TV (X), is given by the ℓ1 norm of the discrete gradient of the image:
| (5) |
Here the discrete gradient of the image at the pixel (m,n) , is defined as:
| (6) |
It has been demonstrated that, for a piecewise constant image such as the standard Shepp-Logan phantom, the gradient transform is an effective sparsifying transform. In this case, the objective function in Eq. (4) is reduced into a pure TV term. It has been numerically demonstrated that, the minimization of the TV can give accurate estimation of the piece-wise constant image in Fourier space (14) and in x-ray projection space (19–24). The other sparsifying transforms such as second order difference of the image or the wavelet transform of the image have also been investigated in MRI to reconstruct image from few projections (16–18).
Note that the original CS was formulated in Fourier space where the Fourier transform and the inverse Fourier transform are adjoint to one another. When the CS method was generalized to x-ray CT data acquisitions, the standard filtered backprojection (FBP) image reconstruction operation and the forward projection operation (simple summation of pixel values along a straight line) are not adjoint to each other. In this case, the ART image reconstruction or other iterative reconstruction algorithms developed in medical imaging community can be combined with the ℓ1 – norm minimization procedure to implement the CS algorithm (19).
Prior Information Constrained Compressed Sensing (PICCS)
The CS image reconstruction method concerns how to reconstruct an image from a given undersampled data set. The only prior information used in CS is the sparseness of the target image. Image reconstruction starts with either a zero/empty seed image or an image estimated by the standard FBP reconstruction. The difference of using different seed images is often negligible.
In contrast, PICCS algorithm (25) concerns how to reconstruct an image from a given undersampled data set and a high quality prior image of the same image object. Let us denote the prior image as XP, and denote the image volume to be reconstructed as X. The PICCS image reconstruction is implemented by solving the following minimization problem:
| (7) |
where Ψ1,2 are two sparsifying transforms used in CS. They can be the same or different depending on the specific application. The parameter α (0 ≤ α ≤ 1) is selected based on the artifacts level in the prior image XP. When α is set to be 0, the PICCS algorithm reduces to the conventional CS algorithm. When α is set to be 1, the PICCS algorithm is equivalent to correcting the prior image XP by reconstruction of a difference image using the difference projection data between the measured data and the reprojected data from the prior image and the conventional compressed sensing (Samsonov, private communication).
Numerical Implementation Steps in PICCS
In this paper, we use x-ray CT as an example to demonstrate how to use PICCS algorithm in practice. In this case, the forward projection operator in Eq. (1) is a simple line integral. Several forward projection algorithms have been developed and published in literature (26–28). In this paper, Siddon’s ray-driven forward projection method was used to calculate the reprojections from the prior image (28). The projection value of each ray is computed as a weighted summation of the intensities of voxels on the path of the ray. The weight is the intersection length of the ray with each individual voxels.
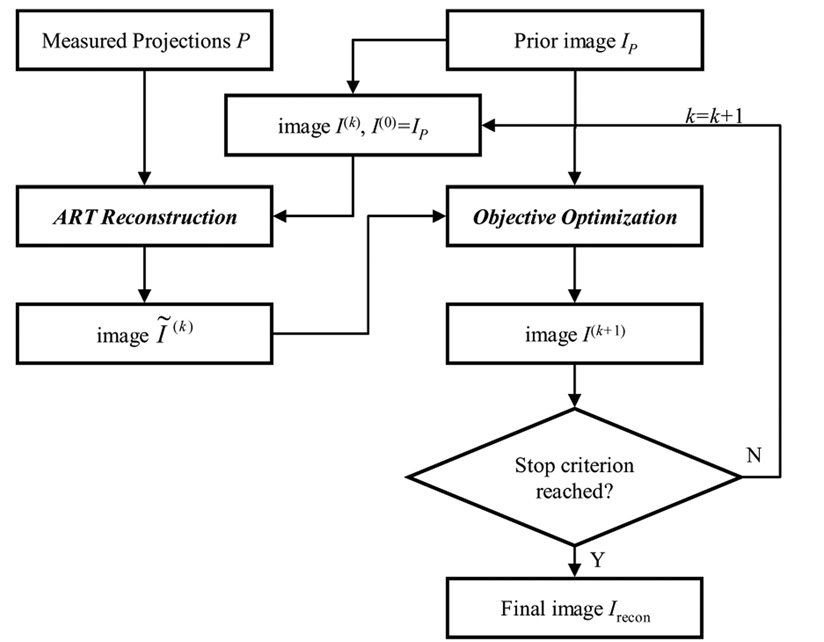
The image is first reconstructed directly to satisfy the consistent condition in Eq. (1). In this step, the standard ART algorithm (26) is used. After the image is reconstructed using ART, the objective function in Eq. (7) is minimized using the standard steepest descendent method with a small constant step size. The flow chart of the implementation is given in Figure 2.
Figure 2.
Flow chart of the implementation of PICCS.
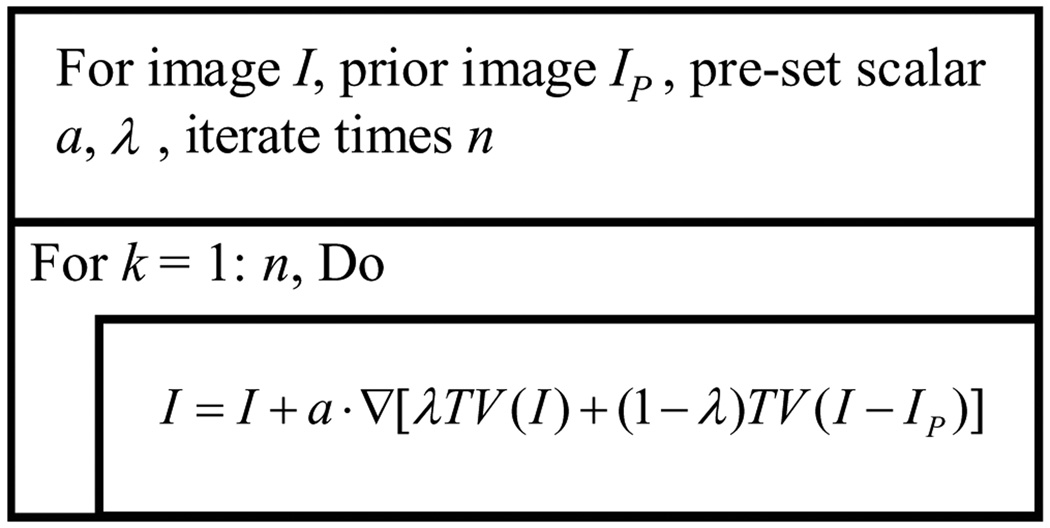
The ART step is implemented as shown in Figure 1. The minimization of the objective function of PICCS, i.e., Eq. (7), is conducted using the standard steepest descendent method (30). The flow chart of the implementation is shown in Figure 3.
Figure 3.
Flow chart of objective function minimization.
Stopping criterion
An image-guided stopping criterion was introduced to stop the iteration. The following squared difference between two adjacent iterations is utilized as the metric to evaluate image quality:
| (8) |
where I(k)(i,j) is the image value at pixel (i,j) in kth step. When the value of SD is smaller than a threshold value, the reconstruction process stops and the final image is displayed.
Dynamic phantoms in numerical simulations
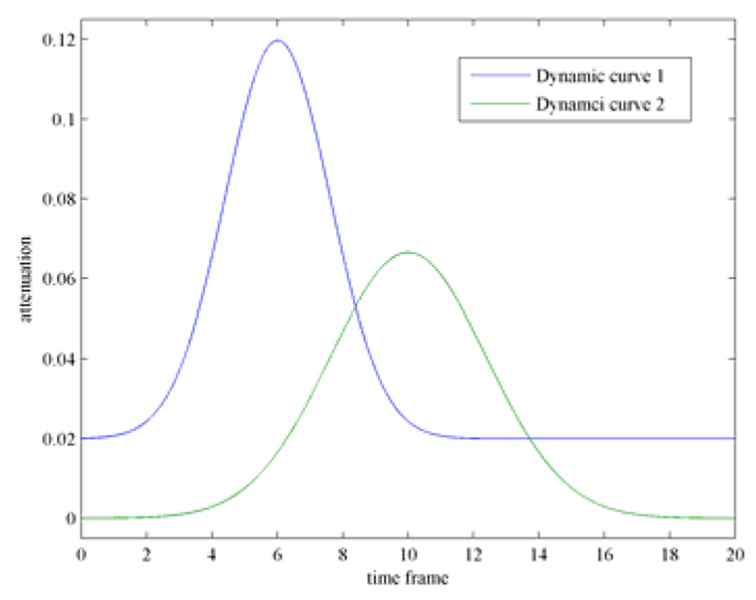
In order to validate the PICCS algorithm, numerical simulations were first conducted. The dynamic phantom is shown in Figure 5. In this phantom, six rows of circular discs with different diameters have been introduced to evaluate the spatial resolution (Figure 5). In order to study how to use PICCS algorithm to accurately reconstruct each time from using highly undersampled data set, contrast dynamics show in Figure 4 were introduced in two objects in the phantom (object 1: the bottom object in the central column with three objects; object 2: the large object in the left cavity). Namely, the density of image object 1 and object 2 dynamically changes following the two curves in Figure 5. The projection data were generated analytically for each time frame. In order to test the noise performance of the PICCS algorithm, Poisson noise were added into each projection by assuming entrance x-ray photon of 105 which is typical in x-ray CT. When view angle is fully sampled (400 projections over 360 degree view angle coverage), the standard filered backproejction algorithm was utilized to reconstruct three sampled time frames 7, 10, and 15. Images were presented in Figure 5. Due to the challenging structures of the phantom, reconstruction artifacts are still visible around the “ribs” in the phantom even if the view angles are not undersampled.
Figure 5.
Three typical time frames at 7, 10, and 15 were reconstructed using FBP algorithm. The dynamical change of the density for image object 1 and object 2 is shown in these three frames respectively.
Figure 4.
contrast enhancement curves for object 1 and object 2.
In order to validate PICCS image reconstruction algorithm, three undersampling factors: 10, 20, and 40 were selected to generate projection data for each time frame, which corresponds to 40, 20, and 10 view angles respectively in each time frame. The undersampled views were uniformly distributed in each time frame, but the data acquisition was interleaved in different time frames, as shown in Figure 6. The union of the interleaved acquisition yields a fully sampled data set which enables to reconstruct a prior image.
Figure 6.
Interleaved data acquisition for each time frame. Different color in small circle corresponds to data acquired at different time frames.
Experimental Data Acquisition and Data Processing
The PICCS algorithm was also validated using x-ray projection data acquired from an anesthetized male 47 kg swine. The scanning protocol utilized in this animal study was approved by the Institutional Review Board, and complies with the guidelines for care of animals given by the National Institutes of Health. The swine was anesthetized initially with a combination of 4 mg/kg telazol IM and 2 mg/kg xylazine IM. A 50-second continuous axial scan was performed using a power injection of 75 cc iodixanol at a rate of 8 cc/second. Data acquisition was initiated after a five-second delay. The ventilator was turned off during the acquisition to prevent respiratory motion, and the ECG signal was simultaneously recorded. The heart rate was approximately 83 beats/min during the acquisition presented in this work. A state-of-the-art clinical 64-slice MDCT scanner (GE Healthcare Lightspeed VCT, Waukesha, Wisconsin) installed at the University of Wisconsin hospital (Madison, WI) was used to scan the animal. A ‘cine mode’ with a 0.4 second gantry rotation period was employed in data acquisition. The porcine scan was performed with x-ray parameters of 120 kVp and 500 mA. The acquired raw data were preprocessed with the manufacturer’s software (GE Healthcare, Waukesha, Wisconsin) and images were reconstructed using the PICCS algorithm.
Fully sampled and undersampled experimental projection data sets
The acquired projection data during the 50 seconds scan were retrospectively gated using simultaneously recorded electrocardiogram (ECG) signal. In this study, a cardiac window with width of 261ms centered at the 75% R-R peak was utilized (Figure 7). This cardiac window corresponds to a short scan angular range (180 degrees plus fan angle) and 642 view angles. Using the short scan datasets at each heart beat, the cardiac images were reconstructed using the standard short scan filtered backprojection method. Thus, one heart beat corresponds one image frame in the analysis of contrast dynamics.
Figure 7.
A typical segments of the recorded ECG signals and the selected cardiac windows for heart beats 32, 33, 34, and 35.
In order to validate the PICCS algorithm, the fully sampled short-scan data set at each heart beat was down-sampled by different undersampling factors. In this study, undersampling factors of 16, 32, and 64 have been utilized which correspond to 40, 20, and 10 views of projection respectively at each heart beat. The undersampled view angles have been selected to approximately uniformly distribute along the short scan angular range. PICCS algorithm was applied to to reconstruct the corresponding image frames.
Experimental validation of PICCS algorithm
Experimental validation of PICCS algorithm consists of both qualitative and quantitative comparisons.
Qualitative comparison: For each image frame, four images will be reconstructed. The first image is reconstructed using the standard FBP algorithm and the fully sampled short scan data set. This image is used as a reference to qualitatively evaluate images reconstructed using FBP, CS, and PICCS and the undersampled data set. The same reconstruction parameters such as number of iterations, step length, and for on have been selected to be the exactly same for both CS and PICCS iterative reconstruction.
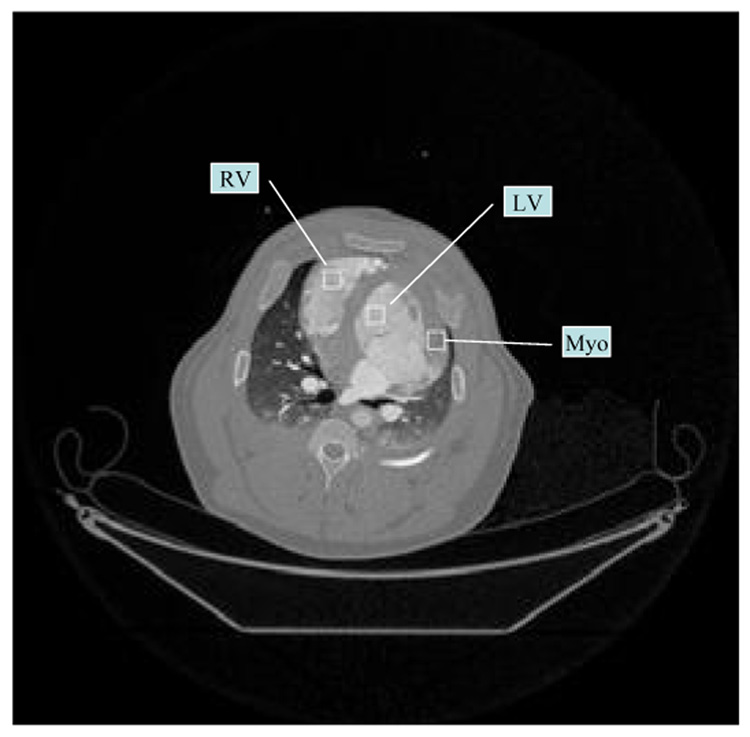
Quantitative comparison: In order to evaluate the reconstruction accuracy of PICCS algorithm, the dynamical contrast enhancement curves will be extracted from the reconstructed images using fully sampled FBP images and undersampled PICCS images over the total 66 time frames. Three regions of interests (ROIs) are selected from left ventricle, right ventricle, and myocardium as shown in Figure 8. Each ROI consists of 13×13 pixels.
Figure 8.
A sample of the reconstructed image and three target regions of interest (ROIs), one is one left ventricle, one is on right ventricle, and one is on
Prior Images in Experimental Studies
A prior image was reconstructed using the union of the interleaved view angles from a portion or all of heart beats during the 50 seconds data acquisition. This union dataset is not undersampled. Note that the contrast dynamic information is lost in the prior image since projection data from all time frames have been mixed. It is also worth mentioning that streaking artifacts are inevitable in this prior image. These streaks are not caused by view aliasing. They are caused by data inconsistency because of the different level of contrast enhancement in each time frame.
Results
In this section, both numerical simulation results and experimental results were presented to study the performance of the PICCS reconstruction algorithm.
Numerical Simulations: 20 view angles
In this study, projection data of the phantom described in Figure 4 and Figure 5 were analytically generate at 20 view angles for the total of 20 time frames. A prior image was reconstructed using the union of the view angles from all 20 frames, which consists of 400 view angles in total.
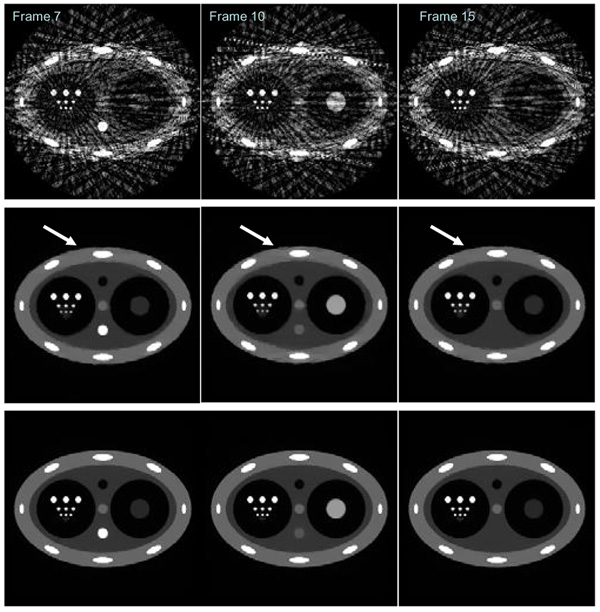
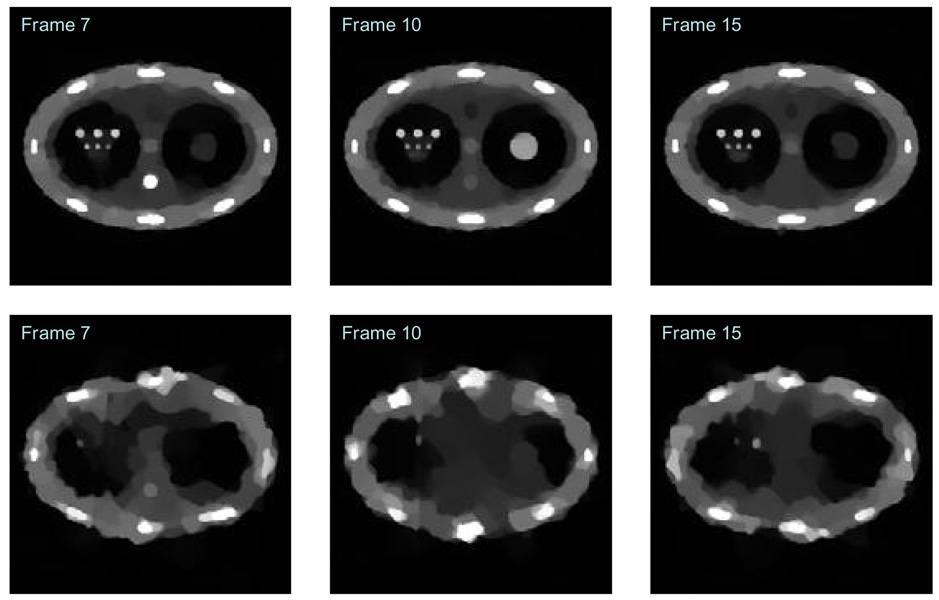
For each time frame, the standard FBP image reconstruction algorithm was used to reconstruct images. Three typical time frames (Frame 7, Frame 10, and Frame 15) are shown in the first row in Figure 9. Using the same amount of 20 view angles at each time frame, images were also reconstructed using the CS method. The results for the same three frames in FBP were shown in the second row in Figure 9. Finally, each time frame was also reconstructed using PICCS and the prior image in Figure 8. The results were shown in the third row in Figure 9. When the reconstructed images using FBP method and CS method were compared, it is clear that the quality of images reconstructed using CS method is significantly improved. However, the edges of the peripheral structures are not sharply reconstructed. The central disc at time frame 10 is severely distorted. In addition, the small discs in the fourth row with diameter of 1.6 pixels were not reconstructed while they are visible in FBP images. This indicates a spatial resolution loss in CS images. The clearly visible artifacts in CS images indicate that we can not claim that CS method enables accurate reconstruction of the specific phantom using 20 views of projections. Namely, the images under study were not sufficiently sparse to enable an accurate reconstruction of the phantom using 20 views of projection data.
Figure 9.
Sample images at time frame 7 (Left column), frame 10 (Central column), and frame 15 (Right column) reconstructed using FBP method (First row), CS (Second row), and PICCS (Third row).
When images reconstructed using CS and PICCS (the second row and the third row respectively) were compared, it is clear that the visible distortion artifacts for all structures in CS images were removed. It is also important to see that the fourth row of small discs with 1.6 pixels of diameter have been faithfully reconstructed using PICCS. Thus, there is no spatial resolution loss in PICCS when it is compared with the FBP method.
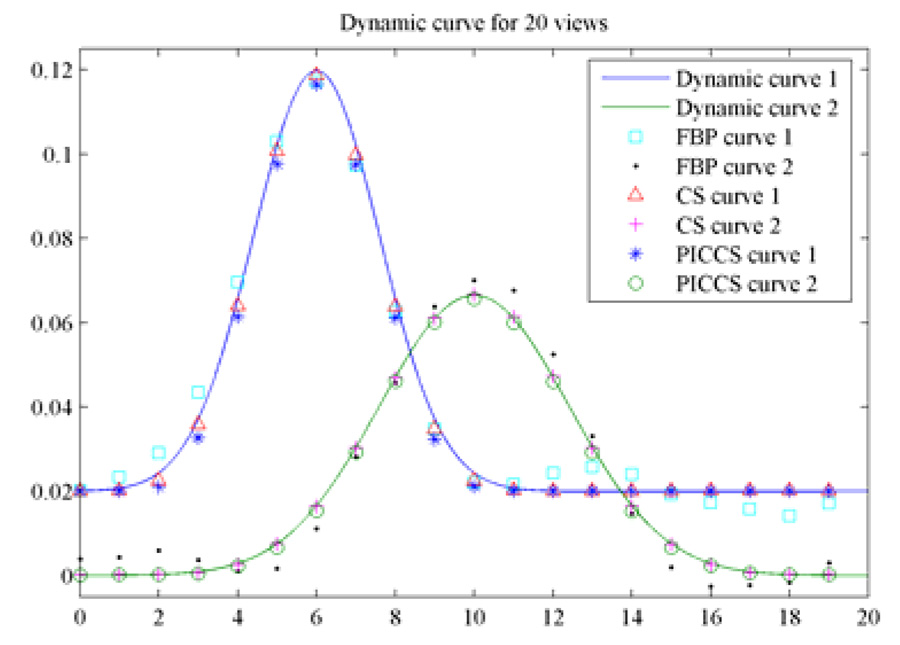
Contrast dynamics were studied using the reconstructed images for the FBP, CS, and PICCS algorithms. The results were shown in Figure 10. It is clear that both CS and PICCS algorithms enables accurate restoration of contrast dynamics. In contrast, FBP generates inaccurate dynamics at early and late frames where the contrast enhancement is low.
Figure 10.
Comparison of contrast dynamics for three reconstruction methods.
When the fully sampled FBP images in Figure 6 were compared with the undersampled PICCS images, it is clear that the image noise is much lower in the PICCS reconstructed images. In fact, the PICCS images look like images without any noise. This SNR enhancement can be attributed to two reasons: one is that a high SNR prior was utilized to reconstruct PICCS, the other factor is that PICCS inherits the de-noise feature from the standard CS method. Here we did not measure the noise variance in CS images since there are some residual reconstruction artifacts visible in images. These residual artifacts will bias the measurement of noise variance.
Finally, when CS is compared with PICCS, even if both methods may eventually yield accurate reconstruction of an image when the number of view angles is large enough, the speed of convergence of PICCS is much faster than CS. In the case presented in Figure 9, the images reconstructed from CS are inferior to the corresponding images reconstructed from PICCS with 10 ART iterations while the CS did not generate accurate reconstruction yet after 30 ART iterations.
Numerical Simulations: 10 view angles and 5 view angles
In order to further study the performance of the PICCS algorithm when view angles are vastly undersampled, numerical simulations were also conducted for the 10 and 5 view angles.
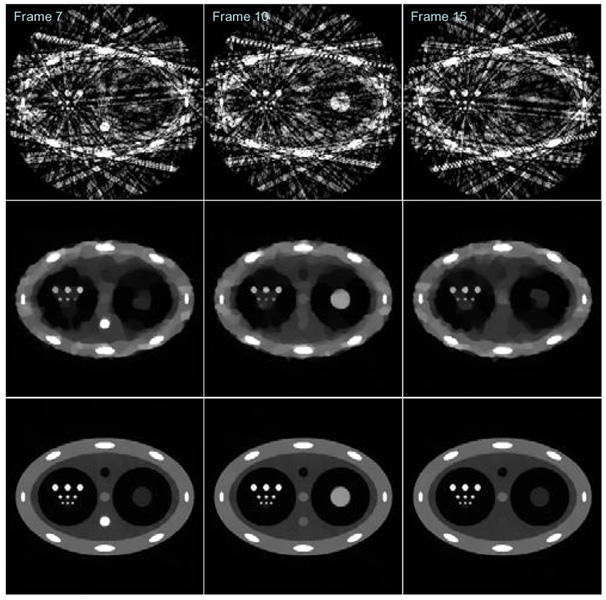
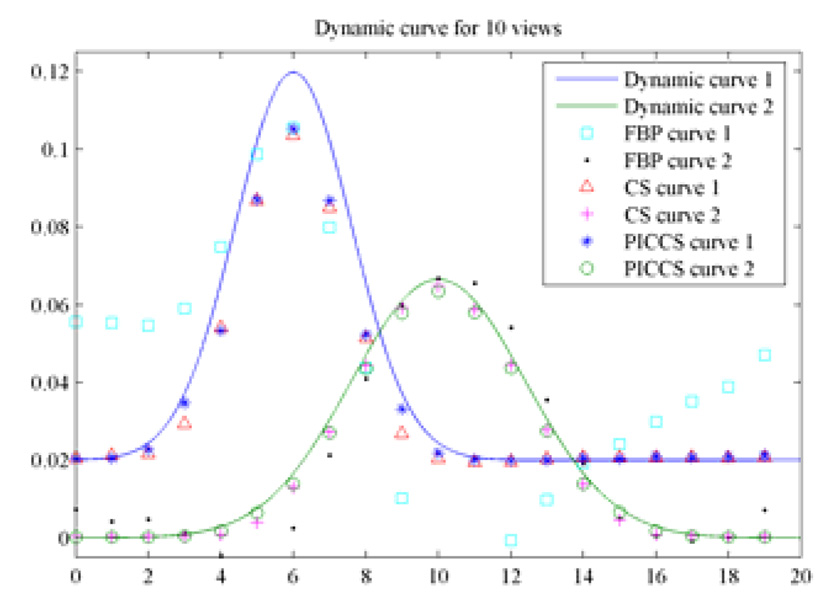
When the number of view angles is 20, 50 ART iterations were conducted to reconstruct the image while 20 iterations were used in PICCS algorithm. It is clearly seen that both FBP and CS yield unacceptable images where either streaking artifacts or distortion artifacts are rampant in the reconstructed images. However, the PICCS algorithm still generates nearly accurate reconstruction for all time frames. Note that three discs with diameter of 3.2 pixels were lost in CS reconstruction (Figure 11). In contrast, both FBP and PICCS can reconstruct this row of discs. The contrast dynamics were also extracted from reconstructed images and results were presented in Figure 12.
Figure 11.
Comparison of image reconstruction for FBP (first row), CS (second row), and PICCS (third row) using 10 views of projections for time frame 7 (Left column), frame 10 (Central column), and frame 15 (Right column).
Figure 12.
Comparison of contrast dynamics when 10 views of projections were utilized.
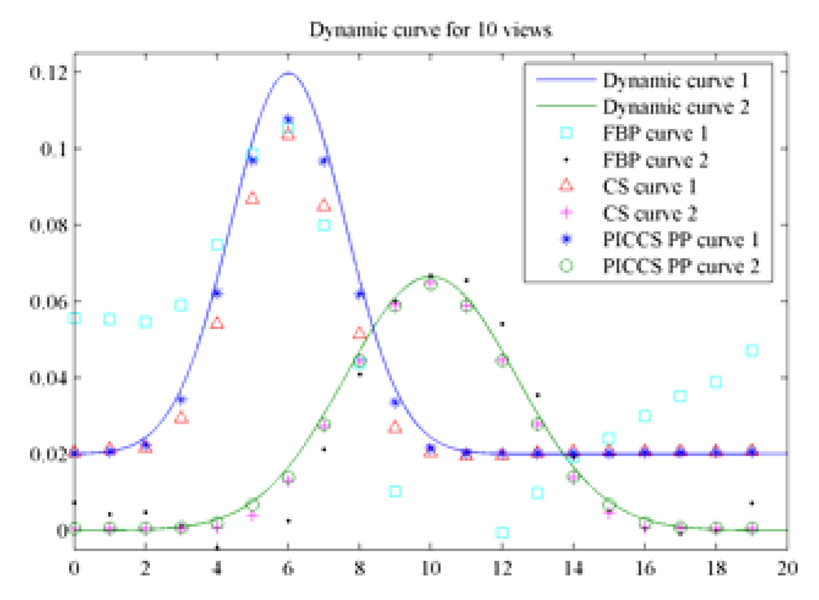
It was demonstrated in Figure 12 that the contrast dynamics of the object 2 was accurately reconstructed at all time frames. For object 1, the early and late time frames were accurately reconstructed, but the time frames 4–9 deviated from the theoretical ground truth a bit. In order to further improve the accuracy of contrast dynamics for object 1, progressive prior image was utilized in PICCS. For simplicity, we only used the reconstruct time frame 6 which contrast dynamics of object 1 reaches its peak value as our prior image to reconstruct image frames 4–9. Images were reconstructed again using the PICCS algorithm and new prior image. The new curve of contrast dynamics was presented in Figure 13. It is clear that all time frames but the peak frame, which was used as prior image, were accurately reconstructed.
Figure 13.
Improved contrast dynamics when a progressive prior image was utilized in PICCS.
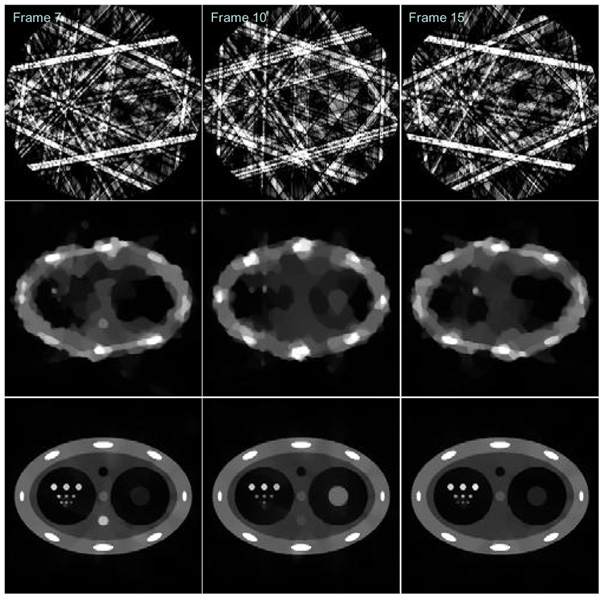
When the number of view angles for each time frame drops to 5, the reconstructed images were presented in Figure 14. In this case, the PICCS algorithm still enables acceptable reconstruction of the time frames, although some visible artifacts appear.
Figure 14.
Comparison of images reconstructed from 5 views of projections in each time frame. Top row: FBP Reconstruction; Middle row: CS reconstruction; Bottom row: PICCS reconstruction.
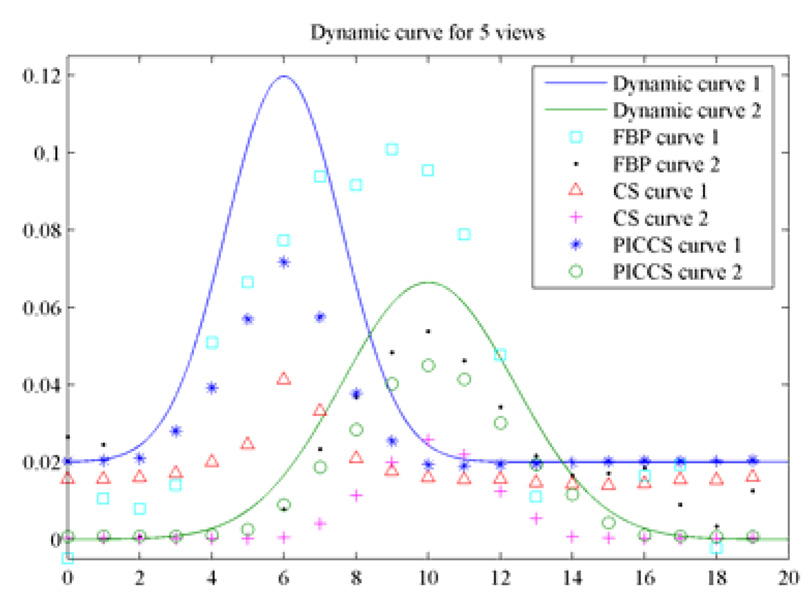
The contrast dynamic curves for object 1 and object 2 were extracted from images reconstructed using 5 view angles in each time frame (Figure 15). It is seen that the contrast dynamic values were systematically lower than the theoretical ground truth, but the global shape is well preserved in PICCS reconstruction. Progressive prior image was also utilized in the PICCS algorithm to reconstruct time frames. The improvement is not significant in this case. Therefore, when the number of view angles is about 5, the PICCS algorithm only enables qualitative reconstruction.
Figure 15.
Comparison of contrast dynamics when 5 views of projections were utilized in reconstruction.
In order to demonstrate that images reconstructed using the CS algorithm in Figure 11 and Figure 14 will not improve with more iterations in the reconstruction. Images were reconstructed using the CS method and 500 iterations. The results were presented in Figure 16. It is clear that image quality does not improve much even when 500 ART iterations were used when 10 (Upper row in Figure 17) and 5 views (Lower row in Figure 17) of projections were used.
Figure 16.
Images reconstructed using CS method and 500 ART iterations. The upper row is for 10 views and the lower row is for 5 views.
Figure 17.
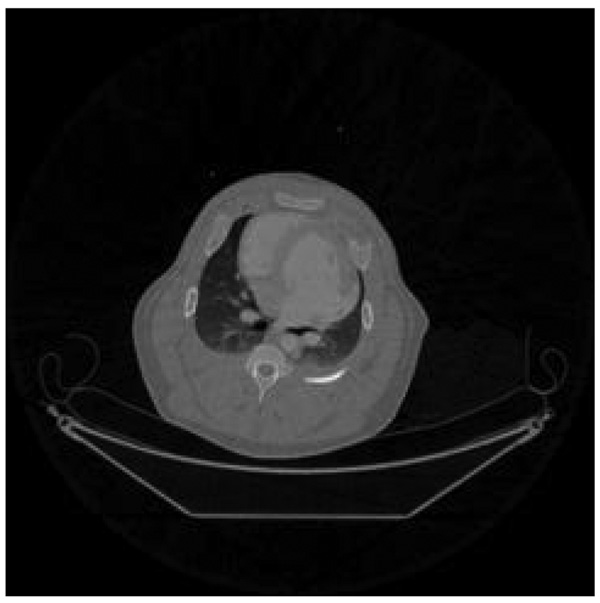
Prior image reconstructed using data from all heart beats and the standard filtered backprojection reconstruction algorithm.
Experimental Results
(1) 32× Undersampling: 20 views of projections
In experimental studies, projection data acquired during 66 consecutive heart beats were utilized in image reconstruction. For each heart beat, a reference image was reconstructed using the short scan FBP reconstruction algorithm from about 640 projections. In order to validate the PICCS reconstruction algorithm, 20 projections were selected from each heart beat. This represents a factor of 32 undersampling factor. From one heart beat to another, the data selection was approximately interleaved. Using the union of the 20 projections over the 66 heart beats, a high signal-to-noise (SNR) prior image was reconstructed using the standard FBP reconstruction algorithm (Figure 17). In this prior image, the dynamic information for contrast agent is lost due to the mix of the projection data.
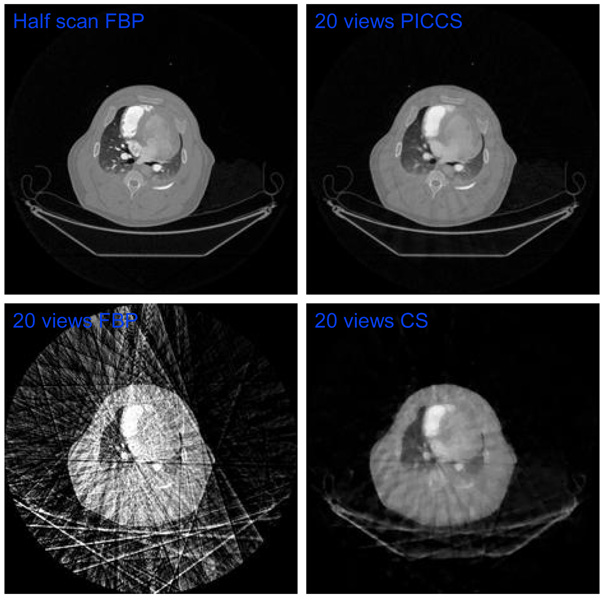
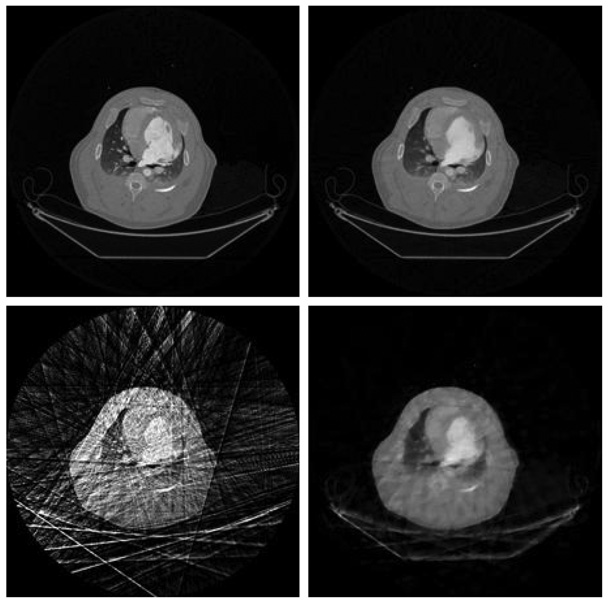
Using 20 views of projection data at each heart beat, FBP, CS and PICCS reconstruction methods were used to reconstruct individual images at each heart beat. Exactly same reconstruction parameters were used in CS and PICCS reconstruction. As shown in Figure 18, using 20 projections, severely streaking artifacts appear in image reconstructed using the FBP method. These streaking artifacts impede the visibility of the major anatomical structures. The profile of the patient bed is barely identifiable. Streaking artifacts in image reconstructed using CS method are significantly mitigated when compared with FBP images. However, the images are significantly blurred and the severe patchy structures appear in the reconstructed which indicates the failure of the CS reconstruction. Even the bones can not be faithfully reconstructed using the CS algorithm. Using the exactly same reconstruction parameters, the PICCS reconstruction algorithm generates nearly artifact-free image for each individual time frame. When the PICCS image is compared with FBP images reconstructed using 640 views of projections, the quality of reconstruction is nearly identical.
Figure 18.
Images reconstructed using PICCS, FBP, and CS reconstruction methods at a typical time frame. The same time frame image reconstructed using FBP and 640 views of projections is presented in upper left as a reference.
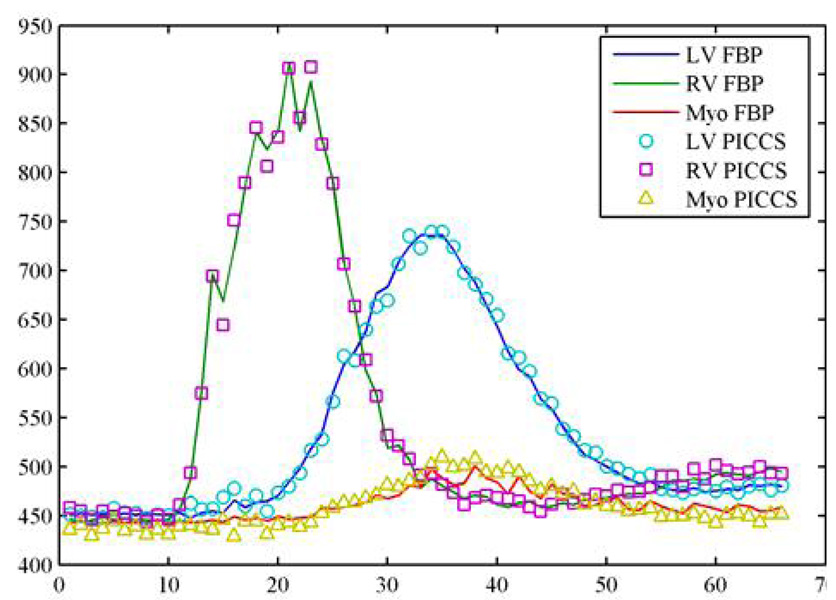
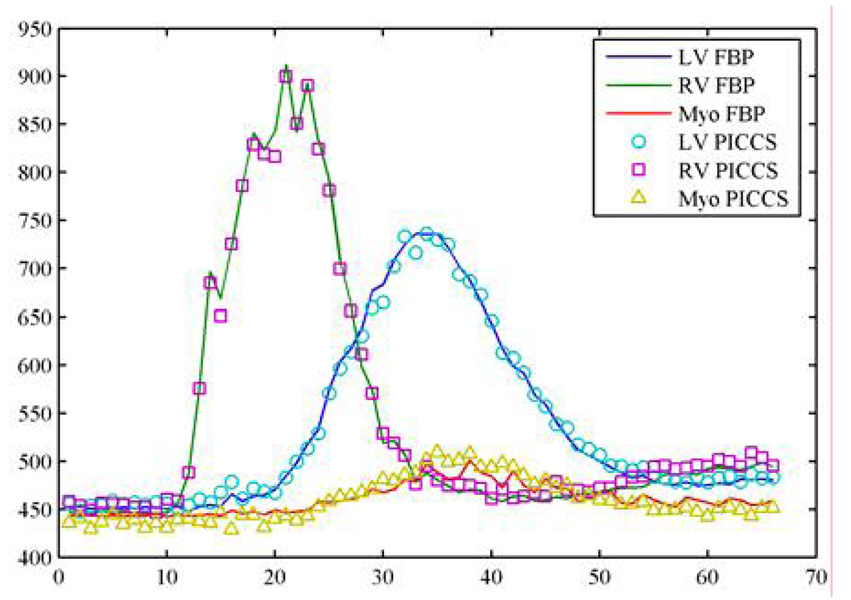
In order to evaluate the accuracy of the reconstruction, the contrast enhancement curves were generated from the fully sampled (640 views of projections) FBP images and the PICCS images. The same size of region of interests at the same locations (Figure 8) was utilized in extraction of the contrast enhancement curves. The results are shown in Figure 19. An excellent agreement was found between the reference curves and the curves extracted from the PICCS images.
Figure 19.
Comparison of contrast enhancement curve for undersampling factor of 16.
(2) 16 × Undersampling: 40 views of projections
When the undersampling factor is 16, there are 40 views of projections in each time frame. In this case, image quality for both undersampled FBP, CS, and PICCS are expected to be slightly better (Figure 20). In order to check the reconstruction accuracy, the contrast dynamic enhancement curve is given in Figure 21. The agreement between the PICCS and the fully sampled FBP results is dictated by the curves.
Figure 20.
The case of undersampling factor 40. Image correspondence is the same as Figure 19.
Figure 21.
Comparison of contrast enhancement curves for FBP algorithm with fully sampled data set and PICCS algorithm with undersampling factor of 32 at three regions of interest (ROIs).
(3) 64× Undersampling: 10 views of projections
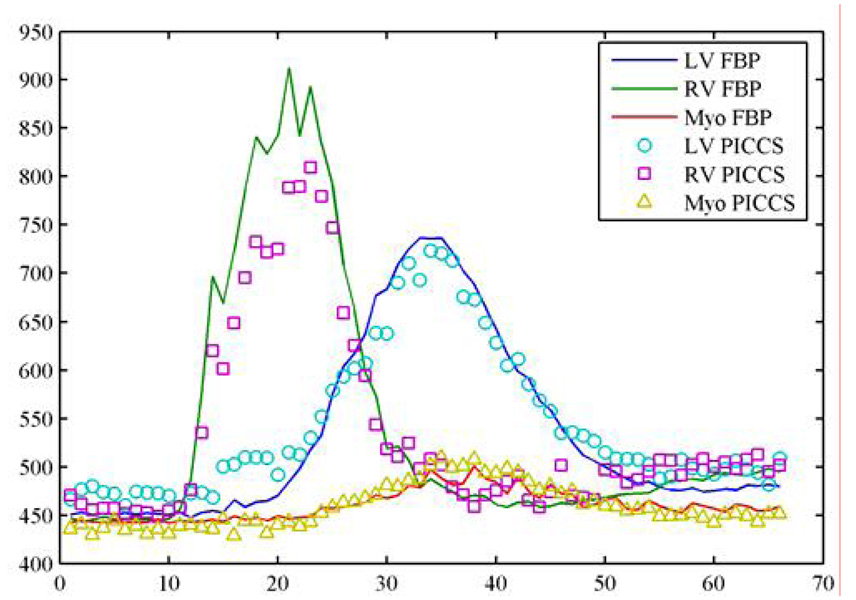
As a comparison, the undersampling factor was increased up to 64 such that there are only 10 views of projections in each time frame. In this case, the image quality is poorer than the previous cases (20 and 40 views). The contrast enhancement curves are presented in Figure 22. From the curves, one can see that the accuracy of the PICCS reconstruction is degraded. This indicated that the PICCS fails to accurately reconstruct images using 10 view angles
Figure 22.
Comparison of contrast enhancement curve for undersampling factor of 64.
Discussion and conclusions
In this paper, the compressed sensing image reconstruction theory and the newly developed prior image constrained compressed sensing (PICCS) were reviewed. Both numerical simulations results and experimental animal studies were conducted to demonstrate how to use the PICCS algorithm in CT imaging. The preliminary comparison of the performance between CS and PICCS were conducted to demonstrate that PICCS algorithm enables higher undersampling factor in image reconstruction.
In PICCS reconstruction, the prior image is used to promote the image sparsity. Thus, the quality of the prior image has a direct impact on the effectiveness of the PICCS. For example, the streaky images reconstructed using FBP in Figure 18 and 20 are not good prior images. If these streaky images were utilized in the PICCS algorithm, the parameter α in Eq. (7) would have to be chosen to be close to zero. Namely, there is little difference between PICCS and CS in this case.
In the CS algorithm, the initial guess of the image can be an empty image or an image reconstructed using the FBP image algorithm. The difference in the selection of initial seed image is not significant. In the PICCS algorithm, both the empty image and the prior image can be used as the initial seed image. The final image quality does not change significantly. However, the convergence speed is significantly different. When the prior image is used as seed image, the number of iterations is significantly reduced.
In this paper, the PICCS image reconstruction algorithm was implemented in two separate steps: One step involves the standard ART implementation; the other step involves a total variation minimization step using the standard steepest descendent method with a constant step size. Using this implementation, one of the key features in both the CS and the PICCS algorithms is manifested: ℓ1 norm minimization is playing a key role in CS and PICCS. When the ℓ1 norm minimization step is skipped, one is left with a pure ART reconstruction algorithm. The image quality is significantly poor when the same reconstruction parameters are utilized. Our selection of implementation was motivated to highlight the importance of the ℓ1 norm minimization. However, it does not imply our implementation is optimal. A potentially better implementation method is to combine the ART step with the minimization of PICCS objective function in a single loop using the Lagrange multiplier method. The minimization of the objective function can be implemented using the standard non-linear conjugate gradient (CG) method (30, 31).
One potential advantage of the PICCS algorithm in x-ray CT is the radiation dose reduction in dynamical imaging such as cerebral perfusion imaging and myocardial perfusion imaging. When the conventional FBP algorithm is used, we need more projection data to reconstruct high SNR images. However, when the PICCS reconstruction algorithm is used, as shown in our experimental studies, only about 20 view angles are required to reconstruct the high SNR images. Thus, one can reduce radiation dose by a factor of 32, i.e., 640/20 in myocardial perfusion imaging. A more thorough study is needed to fully explore this new radiation dose reduction mechanism.
While our numerical simulations and experimental studies were conducted using the CT data acquisition as the example, the PICCS algorithm can be readily extended to other imaging modalities such as MRI using radial projection data acquisition methods (1–4). In MRI, high undersampling factor means faster data acquisition time which is under extensive investigation.
In conclusion, when a high quality prior image is available or can be reconstructed from a dynamic image acquisition sequence, the PICCS algorithm can be utilized to accurately reconstruct images from a vastly undersampled data set. Numerical simulations and the in vivo experimental studies have been conducted to validate the PICCS algorithm. It has been demonstrated that, for a given number of views angles, PICCS enables accurate image reconstruction while both the CS algorithm and the FBP algorithm fail to reconstruct an acceptable image.
Acknowledgement
One of the authors (GHC) acknowledges the interesting discussions with Dr. Mistretta on his HYPR reconstruction algorithm and he also thanks Drs. Candes and Romberg for stimulating discussion on compressed sensing. The authors acknowledge assistance of data acquisition and preprocessing from Dr. Michael Van Lysel, Dr. Michael Spiedel, and Dr. Jiang Hsieh. The work is partially supported by the National Institutes of Health through grants R01EB 005712 and R01 EB 007902
References
- 1.Peters DC, Korosec FR, Grist ThM, Block WF, Holden JE, Vigen KK, Mistretta CA. Undersampled projection reconstruction applied to MR angiography. Magn. Res. Med. 2000;Vol. 43:91–101. doi: 10.1002/(sici)1522-2594(200001)43:1<91::aid-mrm11>3.0.co;2-4. [DOI] [PubMed] [Google Scholar]
- 2.Vigen KK, Peters DC, Grist ThM, Block WF, Mistretta CA. Undersampled projection-reconstruction imaging for time-resolved contrast-enhanced imaging. Magn. Res. Med. 2000;Vol. 43:170–176. doi: 10.1002/(sici)1522-2594(200002)43:2<170::aid-mrm2>3.0.co;2-p. [DOI] [PubMed] [Google Scholar]
- 3.Barger AV, Block WF, Toropov Y, Grist Th. M, Mistretta CA. Time-resolved contrast-enhanced imaging with isotropic resolution and broad coverage using an undersampled 3D projection trajectory. Magn. Res. Med. 2002;Vol. 48:297–305. doi: 10.1002/mrm.10212. [DOI] [PubMed] [Google Scholar]
- 4.Mistretta CA, Wieben O, Velikina J, Block W, Perry J, Wu Y, Johnson K, Wu Y. Highly constrained backprojection for time-resolved MRI. Magn. Res. Med. 2006;Vol. 55:30–40. doi: 10.1002/mrm.20772. [DOI] [PMC free article] [PubMed] [Google Scholar]
- 5.Sonke J-J, Zijp L, remeijer P, van Herk M. Respiratory correlated cone-beam CT. Med. Phys. 2005;Vol. 32:1176–1186. doi: 10.1118/1.1869074. [DOI] [PubMed] [Google Scholar]
- 6.Dietrich L, Jetter S, Tucking Th, Nill S, Oelfke U. Linac-integrated 4D cone beam CT: first experimental results. Phys. Med. Biol. 2006;Vol. 51:2939–2952. doi: 10.1088/0031-9155/51/11/017. [DOI] [PubMed] [Google Scholar]
- 7.Kriminski S, Mitschke M, Sorensen S, Wink NM, Chow PE, Tenn S, Solberg TD. Phys. Med. Biol. Vol. 50:5263–5280. doi: 10.1088/0031-9155/50/22/004. [DOI] [PubMed] [Google Scholar]
- 8.Li T, Schreibmann E, Yang Y, Xing L. Phys. Med. Biol. 2006;Vol. 51:253–267. doi: 10.1088/0031-9155/51/2/005. [DOI] [PubMed] [Google Scholar]
- 9.Li T, Xing L, Munro P, McGuinness C, Chao M, Yang Y, Loo B, Koong A. Four-dimensional cone-beam computed tomography using an on-board imager. Med. Phys. 2006;Vol. 33:3825–3833. doi: 10.1118/1.2349692. [DOI] [PubMed] [Google Scholar]
- 10.Li T, Xing L. Optimizing 4D cone-beam CT acquisition protocol for external beam radiotherapy. Int. J. Radiation Oncology Biol. Phys. 2006;Vol. 67:1211–1219. doi: 10.1016/j.ijrobp.2006.10.024. [DOI] [PubMed] [Google Scholar]
- 11.Chang J, Sillanpaa J, Ling CC, Seppi E, Yorke E, Mageras G, Amols H. Integrating respiratory gating into a megavoltage cone-beam CT system. Med. Phys. 2006;Vol. 33:2354–2361. doi: 10.1118/1.2207136. [DOI] [PubMed] [Google Scholar]
- 12.Li T, Koong A, Xing L. Enhanced 4D cone-beam CT with inter-phase motion model. Med. Phys. 2007;Vol. 34:3688–3695. doi: 10.1118/1.2767144. [DOI] [PubMed] [Google Scholar]
- 13.Lu J, Guerrero ThM, Munro P, Jeung A, Chi P-CM, Balter P, Zhu XR, Mohan R, Pan T. Med. Phys. 2007;Vol. 34:3520–3529. doi: 10.1118/1.2767145. [DOI] [PubMed] [Google Scholar]
- 14.Candès EJ, Romberg J, Tao T. Robust uncertainty principles: exact signal reconstruction from highly incomplete frequency information. IEEE Trans. Inform. Theory. 2006;52(no. 2):489–509. [Google Scholar]
- 15.Donoho DL. Compressed sensing. IEEE Trans. Inform. Theory. 2006;52(no. 4):1289–1306. [Google Scholar]
- 16.Block Kai Tobias, Uecker Martin, Frahm Jens. Undersampled radial MRI with multiple coils. Iterative image reconstruction using a total variation constraint. Magn. Res. Med. 2007;Vol. 57(no.6):1086–1098. doi: 10.1002/mrm.21236. [DOI] [PubMed] [Google Scholar]
- 17.Lustig M, Donoho DL, Pauly JM. Sparse MRI: The Application of Compressed Sensing for Rapid MR Imaging. Mag. Res. Med. 2007;58:1182–1195. doi: 10.1002/mrm.21391. [DOI] [PubMed] [Google Scholar]
- 18.Gamper U, Boesiger P, Kozerke S. Compressed Sensing in Dynamic MRI. Magn. Res. Med. 2008;Vol. 59:365–373. doi: 10.1002/mrm.21477. [DOI] [PubMed] [Google Scholar]
- 19.Sidky EY, Kao C-M, Pan X. Accurate image reconstruction from few-views and limited-angle data in divergent-beam CT. J. X-Ray Science and Technology. 2006;14:119–139. [Google Scholar]
- 20.Li M, Yang H, Kudo H. An accurate iterative reconstruction algorithm for sparse object: application ot 3D blood vessel reconstruction from a limited number of projections. Phys. Med. Biol. 2002;Vol. 47:2599–2609. doi: 10.1088/0031-9155/47/15/303. [DOI] [PubMed] [Google Scholar]
- 21.Velikina JV, Leng S, Chen G-H. Limited view-angle tomographic image reconstruction via total variation minimization. SPIE Medical Imaging. 2007:6510–6571. [Google Scholar]
- 22.LaRoque SJ, Sidky EY, Pan X. Image Reconstruction from Sparse Data in Echo-Planar Imaging. IEEE Nuclear Science Symposium Conference Record. 2006:3166–3169. [Google Scholar]
- 23.Sidky EY, Kao CM, Pan X. Effect of the data constraint on few-view, fan-beam CT image reconstruction by TV minimization. IEEE Nuclear Science Symposium Conference Record. 2006:2296–2298. [Google Scholar]
- 24.Sidky EY, Pan X. Accurate image reconstruction in circular cone-beam computed tomography by total variation minimization: a preliminary investigation. IEEE Nuclear Science Symposium Conference Record. 2006:2904–2907. [Google Scholar]
- 25.Chen G-H, Tang J, Leng S. Prior Image Constrained Compressed Sensing (PICCS): A method to accurately reconstruct dynamic CT images from highly undersampled projection data sets. Med. Phys. 2008;Vol. 25:660–663. doi: 10.1118/1.2836423. [DOI] [PMC free article] [PubMed] [Google Scholar]
- 26.Herman G. Image Reconstruction from Projections. Orlando: Academic Press; 1980. [Google Scholar]
- 27.Peters T. Algorithms for fast back- and re-projection in computed tomography. IEEE Trans. Nucl. Sci. 1981;Vol. 28:3641–3647. [Google Scholar]
- 28.Sidon R. Fast calculation of the exact radiolographic path lengths for a three-dimensional CT array. Med. Phys. 1985;Vol. 12:252–255. doi: 10.1118/1.595715. [DOI] [PubMed] [Google Scholar]
- 29.Candes E, Romberg J. Inverse Problem. 2007. [Google Scholar]
- 30.Press WH, Teukolsky SA, Vetterling WT, Flannery BP. Numerical Recipes in C. New York: Cambridge University Press; 1997. [Google Scholar]
- 31.Shewchuk JR. An introduction of the conjugate gradient method without agonizing pain. Preprint. 1994 [Google Scholar]
- 32.Song J, Liu QH, Johnson GA, Badea CT. Sparsness prio based iterative image reconstruction for retrospectively gated cardiac micro-CT. Med. Phys. 2007;Vol. 34:4476–4482. doi: 10.1118/1.2795830. [DOI] [PMC free article] [PubMed] [Google Scholar]


