

Abstract
The imprints of domestication and breed development on the genomes of livestock likely differ from those of companion animals. A deep draft sequence assembly of shotgun reads from a single Hereford female and comparative sequences sampled from six additional breeds were used to develop probes to interrogate 37,470 single-nucleotide polymorphisms (SNPs) in 497 cattle from 19 geographically and biologically diverse breeds. These data show that cattle have undergone a rapid recent decrease in effective population size from a very large ancestral population, possibly due to bottlenecks associated with domestication, selection, and breed formation. Domestication and artificial selection appear to have left detectable signatures of selection within the cattle genome, yet the current levels of diversity within breeds are at least as great as exists within humans.
The emergence of modern civilization was accompanied by adaptation, assimilation, and interbreeding of captive animals. In cattle (Bos taurus), this resulted in the development of individual breeds differing in, for example, milk yield, meat quality, draft ability, and tolerance or resistance to disease and pests. However, despite mapping and diversity studies (1–5) and the identification of mutations affecting some quantitative phenotypes (6–8), the detailed genetic structure and history of cattle are not known.
Cattle occur as two major geographic types, the taurine (humpless—European, African, and Asian) and indicine (humped—South Asian, and East African), which diverged >250 thousand years ago (Kya) (3). We sampled individuals representing 14 taurine (n = 376), three indicine (n = 73) (table S1), and two hybrid breeds (n = 48), as well as two individuals each of Bubalus quarlesi and Bubalus bubalis, which diverged from Bos taurus ~1.25 to 2.0 Mya (9, 10). All breeds except Red Angus (n = 12) were represented by at least 24 individuals. We preferred individuals that were unrelated for ≥4 generations; however, each breed had one or two sire, dam, and progeny trios to allow assessment of genotype quality.
Single-nucleotide polymorphisms (SNPs) that were polymorphic in many populations were primarily derived by comparing whole-genome sequence reads representing five taurine and one indicine breed to the reference genome assembly obtained from a Hereford cow (10) (table S2). This led to the ascertainment of SNPs with high minor allele frequencies (MAFs) within the discovery breeds (table S5). Thus, as expected, with trio progeny removed, SNPs discovered within the taurine breeds had higher average MAFs within the taurine than the indicine breeds, and vice versa (table S5); about 30% of SNPs had MAFs >0.3 within the taurine breeds, whereas only about 19% had MAFs >0.3 within the indicine breeds (table S4). The proportions of SNPs in intergenic, intronic, and exonic regions were 63.74, 34.9, and 1.35%, respectively, similar to their representation within the genome. We found that as few as 50 SNPs were necessary for parentage assignment and proof of identity (table S9). Additionally, when we compared ancestries based on pedigree and allele-sharing between individuals, we were able to predict accurately the extent of ancestry when the pedigree was not known (fig. S24), which could be a useful tool for the management of endangered bovine populations.
To examine relatedness among breeds, we analyzed SNP genotype frequencies with InSTRUCT (11) and performed principal component analysis (PCA) using Eigenstrat (12) (Fig. 1 and fig. S27). Varying the number of presumed ancestral populations (K) within InSTRUCT revealed clusters consistent with the known history of cattle breeds (Fig. 1A). The first level of clustering (K = 2) reflects the primary, predomestication division of taurine from indicine cattle. Consequently, breeds derived from indicine and taurine crosses (Beefmaster, Santa Gertrudis, and Sheko) show signatures of admixture with both approaches. At K = 3, the African breeds N’Dama and Sheko separate from the European breeds—a division that reflects an early, possibly predomestication, divergence. PCA recapitulated these findings (Fig. 1B). At higher levels of K, we observed clusters that identify single breeds as closed endogamous breeding units. For example, at K = 9, Jersey, Hereford, Romagnola, and Guernsey each form unique clusters.
Fig. 1.
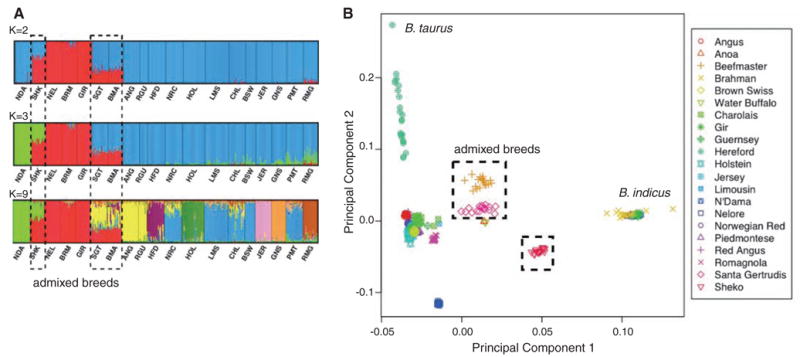
(A) Population structure assessed by InStruct. Bar plot, generated by DISTRUCT, depicts classifications with the highest probability under the model that assumes independent allele frequencies and inbreeding coefficients among assumed clusters. Each individual is represented by a vertical bar, often partitioned into colored segments with the length of each segment representing the proportion of the individual’s genome from K = 2, 3, or 9 ancestral populations. Breeds are separated by black lines. NDA, N’Dama; SHK, Sheko; NEL, Nelore; BRM, Brahman; GIR, Gir; SGT, Santa Gertrudis; BMA, Beefmaster; ANG, Angus; RGU, Red Angus; HFD, Hereford; NRC, Norwegian Red; HOL, Holstein; LMS, Limousin; CHL, Charolais; BSW, Brown Swiss; JER, Jersey; GNS, Guernsey; PMT, Piedmontese; RMG, Romagnola. (B) Principal components PC1 and PC2 from all SNPs. Taurine breeds remain separated from indicine breeds, and admixed breeds are intermediate.
If modern breeds arose from bottlenecks from a large ancestral population, we should detect bottleneck signatures within patterns of linkage disequilibrium (LD) and effective population size. We found that the decline of r2 with genetic distance varied among breeds, although the decline was generally rapid (fig. S10). The extent of LD in cattle is greater than human (13) but less than dog (14). The Jersey and Hereford breeds had higher r2 than other breeds across the range of distances separating loci. N’Dama had the highest r2 values at short distances and the lowest r2 at long distances, which suggested that they were derived from a relatively small ancestral population not subjected to very narrow bottlenecks. The indicine breeds had lower r2 values at short distances and intermediate r2 values at longer distances, which indicated that their ancestral population was much larger than that from which taurine cattle were domesticated (Fig. 2). As the MAFs for utilized SNPs were generally high and the estimates of LD did not require phased chromosomes, these results should be robust.
Fig. 2.

Effective population size in the past estimated from linkage disequilibrium data. Inset graph shows effective population size for the European humans over the same period; from (13). Breeds as in Fig. 1.
When breeds were combined, the decline in LD was more rapid, which reflected a lack of conserved phase relations across breeds. We characterized the extent of haplotype-sharing among breeds between pairs of adjacent SNPs using the r statistic. A high correlation between r values between two breeds indicates that the same haplotypes tend to persist within both breeds. Correlations between r values for SNPs separated by 10 kb were high among the taurine and indicine breeds but were low between these groups (fig. S11). Once SNPs are separated by 100 to 250 kb, we found little haplotype sharing between breeds. Clearly, phase relations dissipated as populations diverged despite the relatively young origin of all breeds. Breeds known to have a recent shared ancestry, notably, Angus and Red Angus; Holstein and Norwegian Red; and Beefmaster and Santa Gertrudis, showed a high correlation among r values for SNPs separated by 100 to 250 kb.
Breeds were expected to differ for effective population sizes (Ne) on the basis of differences in the decline of r2 with genetic distance (13). We estimated Ne at various times in each breed’s history by setting average r2 values equal to their expectation (15) (Fig. 2 and table S1). Ne has recently declined for all breeds, which reflects bottlenecks associated with domestication, breed formation, and, in some breeds, recent intense selection for milk or beef production. In contrast, human Ne has expanded exponentially over the same period (inset to Fig. 2).
A smaller Ne suggests lower genetic diversity, which is of concern for species viability. To assess genetic diversity free from SNP ascertainment bias, we used the polymerase chain reaction to amplify and sequence 119 closely spaced fragments from five genomic regions on two chromosomes. Two of these regions were known to harbor quantitative trait loci (QTL). Following the amplification of these regions from 18 Angus, 16 Holstein, and 5 Brahman, the individual segments were Sanger-sequenced to detect SNPs. Of the 1201 discovered SNP, only 258 were common to taurine and indicine breeds, consistent with their age of divergence. Remarkably, 569 SNP (47.4%) were unique to Brahman, and 365 SNP (30.4%) were found only in Angus or Holstein, with 169 SNP (46.3%) common to both breeds. This suggests that breeds represent partly overlapping sub-samples within the taurine diversity. However, seven times as many taurine animals had to be sequenced to uncover 75.3% as many SNPs as were discovered in indicine animals. Estimates of the unascertained genomic distributions of SNPs by MAFs within taurine and indicine breeds are in fig. S19.
Diversities as measured by the population mutation rate (θ) and pairwise nucleotide heterozygosity (π) were also estimated for the 119 fragments and compared between the three breeds (Fig. 3). Angus and Holstein have similar levels of nucleotide diversity measured by both statistics (~1.4 × 10⁻³) and have ~ 40% more nucleotide variation than is found in human populations (~1.0 × 10⁻³). Brahman variation was even higher, with average estimates of θ and π of 3.35 × 10⁻³ and 2.74 × 10⁻³, respectively. These correspond to densities of 1 SNP every 714 bp for pairs of Angus or Holstein chromosomes and 1 SNP every 285 bp for pairs of Brahman chromosomes. These results demonstrate that genetic diversity in cattle is not low despite the decline in Ne.
Fig. 3.

Nucleotide diversity across five ENCODE regions resequenced in 47 animals from ANG, Angus; BRM, Brahman; and HOL, Holstein. (A) Watterson’s estimate (θ) of the population mutation rate per base pair (pooled across regions). (B) Average pairwise nucleotide distance (π) within breeds. (C and E) Non-parametric bootstrap estimates of diversity ratios among the three populations on the basis of θ. (D and F) Nonparametric bootstrap estimates of diversity ratios among the three populations on the basis of π.
The lower genetic diversity within modern taurine cattle could reflect a lower diversity within the predomestication ancestral population, and/or postdomestication effects of stronger bottlenecks at breed formation and stronger selection for docility and productivity. Selection is unlikely to be the primary cause, because the diversity distributions for θ and π were similar for all five sequenced regions, and only one region revealed a signature of selection. On the other hand, Fig. 2 suggests that the predomestication Ne of indicine cattle, which originated in southern Asia, a center of species diversity, was much larger than that of taurine cattle. Finally, the process of breed formation in European taurine cattle involved sequential limited migrations from the center of domestication in west Asia (5). Diversity declines with distance from primary sites of domestication (4) and ancient DNA from domesticated cattle and aurochs in Europe show that there was essentially no gene flow from the aurochs into domesticated cattle (5). Therefore, the evidence suggests that the current difference in diversity is mainly due to progenitor population diversity and bottleneck effects at, and before, breed formation rather than differences in the intensity of natural or artificial selection postdomestication.
Cattle have been marked by selection during domestication, breed formation, and ongoing selection to enhance performance and productivity. We utilized three methods to detect genomic selection in cattle: (i) the iHS statistic, which identifies regions of increased local LD (16) suggestive of directional selection; (ii) the FST statistic, a measure of the degree of differentiation between subpopulations (17); and (iii) the composite likelihood ratio test (CLR) (18), which assumes a selective sweep model (10). The iHS method was limited by low SNP density and our inability to completely specify ancestral SNP allele states (10). However, despite these limitations, we found evidence for selective sweeps on chromosomes 2, 6, and 14 (table S8 and fig. S20). We identified selection near MSTN, in which mutations can cause double muscling (6). Similarly, high iHS values were found in the region near ABCG2 in which mutations cause differences in milk yield and composition (8). A peak in iHS values was also identified within a gene poor region of chromosome 14 adjacent to a region containing genes from KHDRBS3 to TG, associated with intramuscular fat content in beef (19).
Calculation of FST across all populations for each SNP detected both balancing and divergent selection (fig. S20). Some of the highest and lowest average FST values were found in genes associated with behavior, the immune system, and feed efficiency (Table 1). Domestication most likely required the selection of smaller and more docile animals that could resist pathogens and adapt to a human-controlled environment (20). One region under selection contains R3HDM1 and is associated with efficient food conversion and intramuscular fat content in some breeds (2). In addition to the R3HDM1 gene (21), this region is also under selection in Europeans, most likely because it contains LCT, mutations of which allow the digestion of lactose in adults (22). These results suggest that mutations in this region may affect energy homeostasis. Furthermore, we detected selection between beef and dairy breeds with both CLR and iHS, represented by a broad, high FST peak across the region, centered on SPOCK1 (Table 1). As several QTL have been mapped to this region, multiple loci could be under divergent selection (1), although this peak does not encompass CAST, which affects meat quality (23).
Table 1.
Genomic regions associated with extreme FST values with gene content consistent with domestication. FST values averaged over eight adjacent SNP. Gene functions from OMIM and NCBI Gene database, except for R3HDM1 described in (2).
| Genes | Index SNP | FST | BTA | Location | Effect or important phenotypes |
|---|---|---|---|---|---|
| High values | |||||
| ZRANB3, R3HDM1 | rs29021800 | 0.31 | 2 | 64740286…64931017 | Feed efficiency |
| WIF1 | BTA-27454 | 0.29 | 5 | 52696749…53098507 | Mammalian mesoderm segmentation |
| SPOCK1 | BTA-142690 | 0.30 | 7 | 47501122…47899778 | Proteoglycan—synaptic fields of the developing CNS |
| NBEA | BTA-153392 | 0.34 | 12 | 25884192…26189285 | Human idiopathic autism |
| NMT1, DCAKD, C1QL1 | BTA-45533 | 0.31 | 19 | 46088946…46157261 | Activator of serum complement system |
| DACH2, CHM, POU3F4, BRWD3 | BTA-161991 | 0.39 | X | 41471338…44478564 | Human mental retardation |
| NLGN3 to DGAT2L6 | BTA-164256 | 0.36 | X | 49279035…50192452 | Severe combined immunodeficiency |
| Low values | |||||
| PPARGC1A, DHX15, SOD3 | BTC-039516 | 0.04 | 6 | 45354707…45415844 | Antioxidative extracellular protection |
| No known gene | BTC-049723 | 0.05 | 14 | 4569804…5204473 | |
| DNAH9 | rs29018632 | 0.05 | 19 | 30943404…31220868 | Multisubunit molecular motor |
| POU5F1, MHC | BTA-55856 | 0.05 | 23 | 27895932…28145846 | Major histocompatibility complex |
| ZNF187 | rs29024230 | 0.04 | 23 | 30241236…30502690 | Expressed in olfactory tissues |
| AUTS2 | BTC-074065 | 0.04 | 25 | 31773107…32498861 | Human autism susceptibility candidate |
| RYR2 | rs29011563 | 0.05 | 28 | 8736599…8772178 | Stress- and exercise-induced sudden cardiac death |
Our high resolution examination of cattle shows that unlike the dog—which has restricted diversity and high levels of inbreeding—domesticated cattle had a large ancestral population size and that more aurochs must have been domesticated than wolves; reducing the severity of the domestication bottleneck. SNP diversity within taurine breeds was similar to that of humans, but was significantly less than diversity within indicine breeds, which suggested that the Indian subcontinent was a major site of cattle domestication and predomestication diversity. Selection first for domestication and then for agricultural specialization have apparently reduced breed effective population sizes to relatively small numbers. The recent decline in diversity is sufficiently rapid that loss of diversity should be of concern to animal breeders. Despite this, population levels of LD are unexpectedly low considering the relatively small Ne, which indicates that effective population sizes were much larger in the very recent past.
Supplementary Material
The Bovine HapMap Consortium
Overall project leadership: Richard A. Gibbs,1,2* Jeremy F. Taylor,3* Curtis P. Van Tassell4*
HapMap project group leaders: William Barendse,5,6 Kellye A. Eversole,7 Richard A. Gibbs,1,2 Clare A. Gill,8 Ronnie D. Green,9 Debora L. Hamernik,10 Steven M. Kappes,9 Sigbjørn Lien,11 Lakshmi K. Matukumalli,12,4 John C. McEwan,13 Lynne V. Nazareth,1,2 Robert D. Schnabel,3 Jeremy F. Taylor,3 Curtis P. Van Tassell,4 George M. Weinstock,1,2 David A. Wheeler1,2
Breed champions: Paolo Ajmone-Marsan,14 William Barendse,5,6 Paul J. Boettcher,15 Alexandre R. Caetano,16 Jose Fernando Garcia,15,17 Clare A. Gill,8 Ronnie D. Green9 (leader), Olivier Hanotte,18 Sigbjørn Lien,11 Paola Mariani,19 John C. McEwan,13 Loren C. Skow,20 Tad S. Sonstegard,4 Curtis P. Van Tassell,4 John L. Williams19,21
Pedigree analysis and breed sampling: Alexandre R. Caetano,16 Boubacar Diallo,22 Ronnie D. Green,9 Lemecha Hailemariam,23 Olivier Hanotte,18 Mario L. Martinez,24† Chris A. Morris,25 Luiz O. C. Silva,26 Richard J. Spelman,27 Jeremy F. Taylor3 (leader), Curtis P. Van Tassell4,28 (leader), Woudyalew Mulatu,28 Keyan Zhao29
Sample acquisition and DNA preparation: Colette A. Abbey,8 Morris Agaba,18 Flábio R. Araujo,26 Rowan J. Bunch,5,6 James Burton,30 Clare A. Gill8 (leader), Chiara Gorni,19 Ronnie D. Green,9 Hanotte Olivier,18 Blair E. Harrison,5,6 Sigbjørn Lien,11 Bill Luff,31 Marco A. Machado,24 Paola Mariani,19 John C. McEwan,13 Chris A. Morris,25 Joel Mwakaya,18 Graham Plastow,32 Warren Sim,5,6 Loren C. Skow,20 Timothy Smith,33 Tad S. Sonstegard,4 Richard J. Spelman,27 Jeremy F. Taylor,3 Merle B. Thomas,5,6 Alessio Valentini,34 Curtis P. Van Tassell,4 Paul Williams,5 James Womack,35 John A. Woolliams21
Genome assembly: Yue Liu,1,2 Xiang Qin,1,2 Kim C. Worley1,2 (leader)
SNP discovery: Chuan Gao,8 Clare A. Gill,8 Huaiyang Jiang,1,2 Yue Liu,1,2 Stephen S. Moore,32 Lynne V. Nazareth,1,2 Yanru Ren,1,2 Xing-Zhi Song,1,2 David A. Wheeler1,2 (leader), Kim C. Worley1,2
ENCODE resequencing: Carlos D. Bustamante,29 Ryan D. Hernandez,29 Donna M. Muzny,1,2 Lynne V. Nazareth,1,2 Shobha Patil,1,2 Yanru Ren,1,2 Anthony San Lucas,1,2 David A. Wheeler1,2 (leader)
Genotyping: Qing Fu,1,2 Matthew P. Kent,11 Sigbjørn Lien,11 Stephen S. Moore,32 Lynne V. Nazareth1,2 (leader), Richard Vega,1,2 David A. Wheeler1,2 (leader)
Database & Web site development: Colette A. Abbey,8 Chuan Gao,8 Clare A. Gill,8 Ronnie D. Green,9 Lakshmi K. Matukumalli12,4 (leader), Aruna Matukumalli,4 Sean McWilliam,5,6 Curtis P. Van Tassell4
QA/QC: Colette A. Abbey,8 Clare A. Gill,8 Matthew P. Kent,11 Sigbjørn Lien,11 Lakshmi K. Matukumalli12,4 (leader), Robert D. Schnabel3 (leader), Gert Sclep,19 Jeremy F. Taylor3
Allele frequency analysis: Paolo Ajmone-Marsan,14 Katarzyna Bryc,29 Carlos D. Bustamante29 (leader), Jungwoo Choi,8 Hong Gao,29 John J. Grefenstette,12 Lakshmi K. Matukumalli12,4 (leader), Brenda Murdoch,32 Stephen S. Moore,32 Lynne V. Nazareth1,2 (leader), Alessandra Stella,19 Curtis P. Van Tassell,4 Rafael Villa-Angulo,12 David A. Wheeler1,2 (leader), Mark Wright29
Map data provision and analysis: Jan Aerts,21,36, Oliver Jann,21 Lakshmi K. Matukumalli,12,4 Riccardo Negrini,14 Tad S. Sonstegard,4 John L. Williams19,21
Haplotype estimation: Paolo Ajmone-Marsan,14 John J. Grefenstette12 (leader), Lakshmi K. Matukumalli,12,4 Riccardo Negrini,14 Robert D. Schnabel,3 Jeremy F. Taylor,3 Rafael Villa-Angulo12
Long-range LD analysis: John J. Grefenstette,12 Lakshmi K. Matukumalli,12,4 Curtis P. Van Tassell4 (leader), Rafael Villa-Angulo12
LD persistence across breeds: Mike E. Goddard,37,38 Ben J. Hayes37 (leader)
Selective sweeps: William Barendse5,6 (leader), Daniel G. Bradley,39 Paul J. Boettcher,15 Carlos D. Bustamante,29 Jungwoo Choi,8 Marcos Barbosa da Silva,4,24 Clare A. Gill,8 Lilian P. L. Lau,39 George E. Liu,4 David J. Lynn,39,40 Francesca Panzitta,19 Gert Sclep,19 Mark Wright29
Applications: Carlos D. Bustamante29 (leader), Ken G. Dodds,13 John C. McEwan13 (leader), Jeremy F. Taylor3 (leader), Curtis P. Van Tassell4
1Human Genome Sequencing Center, Baylor College of Medicine, One Baylor Plaza, Houston, TX 77030, USA. 2Department of Molecular and Human Genetics, Baylor College of Medicine, One Baylor Plaza, Houston, TX 77030, USA. 3Division of Animal Sciences, University of Missouri, 920 East Campus Drive, Columbia, MO 65211–5300, USA. 4Bovine Functional Genomics Laboratory, U.S. Department of Agriculture (USDA) Agricultural Research Service (USDA–ARS), Beltsville Agricultural Research Center (BARC)–East, Beltsville, MD 20705, USA. 5Commonwealth Scientific and Industrial Research Organization (CSIRO), Livestock Industries, 306 Carmody Road, St. Lucia, Queensland 4067, Australia. 6Cooperative Research Center (CRC) for Beef Genetic Technologies, University of New England, Armidale, NSW 2351, Australia. 7Alliance for Animal Genome Research, 5207 Wyoming Road, Bethesda, MD 20816, USA. 8Department of Animal Science, Texas A&M University, 2471 TAMU, College Station, TX 77843–2471, USA. 9National Program Staff, USDA–ARS, 5601 Sunnyside Avenue, Beltsville, MD 20705, USA. 10USDA Cooperative State Research, Education, and Extension Service, 1400 Independence Avenue, SW, Washington, DC 20250–2220, USA. 11Centre for Integrative Genetics and Department of Animal and Aquacultural Sciences, Norwegian University of Life Sciences, Arboretveien 6, Ås 1432, Norway. 12Department of Bioinformatics and Computational Biology, George Mason University, 10900 University Boulevard, Manassas, VA 20110, USA. 13Animal Genomics, AgResearch, Invermay, Post Box 50034, Mosgiel 9053, New Zealand. 14Istituto di Zootecnica, Università Cattolica del Sacro Cuore, via East Parmense, 84, Piacenza 29100, Italy. 15Joint United Nations Food and Agriculture Organization (FAO)–International Atomic Energy Agency (IAEA), Division of Nuclear Techniques in Food and Agriculture, IAEA, Post Office Box 100, Wagramerstrasse 5, Vienna A1400, Austria. 16Embrapa Genetic Resources and Biotechnology Center, Final Avenida W/5 Norte, Brasília, DF 70770-900, Brazil. 17Universidade Estadual Paulista (UNESP), Department of Animal Production and Health, IAEA Collaborating Centre in Animal Genomics and Bioinformatics, Aracatuba, SP 16050-680, Brazil. 18Animal Genetics Resources Characterization, International Livestock Research Institute, Post Office Box 30709, Nairobi 00100, Kenya. 19Parco Tecnologico Padano, Via Einstein, Polo Universitario, Lodi 26900, Italy. 20Department of Veterinary Integrative Biological Sciences, College of Veterinary Medicine and Biomedical Sciences, Texas A&M University, College Station, TX 77843–4461, USA. 21The Roslin Institute, Royal (Dick) School of Veterinary Studies, The University of Edinburgh, Roslin, Midlothian, E25 9PS, UK. 22Direction Nationale de l’Élevage, Post Office Box 559, Conakry, Guinea. 23Ethiopian Institute of Agricultural Research, Post Office Box 2003, Addis Ababa, Ethiopia. 24Embrapa Dairy Cattle Center, Rua Eugênio do Nascimento, 610, Juiz de Fora, MG 36038-330, Brazil. 25Animal Genomics, AgResearch, Ruakura, Post Box 3123, Hamilton 3240, New Zealand. 26Embrapa Beef Cattle Center, Rod. BR 262, km 4, Campo Grande, MS 79002-970, Brazil. 27Research and Development, LIC, Post Box 3016, Hamilton 3240, New Zealand. 28Animal Genetics Resources Characterization, International Livestock Research Institute, Post Office Box 5689, Addis Ababa, Ethiopia. 29Department of Biological Statistics and Computational Biology, Cornell University, 101 Biotechnology Building, Ithaca, NY 14853, USA. 30Veterinary Biomedical Sciences, Royal (Dick) School of Veterinary Studies, The University of Edinburgh Summerhall, Edinburgh, EH9 1QH Scotland. 31World Guernsey Cattle Federation, The Hollyhocks, 10 Clos des Goddards, Rue des Goddards, Castel, Guernsey, GY5 7JD, Channel Islands, UK. 32Agricultural Food and Nutritional Science, University of Alberta, 410 AgFor Centre, Edmonton, AB, T6G 2P5, Canada. 33Molecular Genetics Research Unit, USDA–ARS, U.S. Meat Animal Research Center, Post Office Box 166, Clay Center, NE 68933, USA. 34Dipartimento di Produzioni Animali, Universita della Tuscia, via de Lellis, Viterbo 01100, Italy. 35Department of Veterinary Pathobiology, College of Veterinary Medicine and Biomedical Sciences, Texas A&M University, College Station, TX 77843–4461, USA. 36Genome Dynamics and Evolution, Wellcome Trust Sanger Institute, Hinxton, CB10 1SA, UK. 37Animal Genetics and Genomics, Department of Primary Industries, 475 Mickelham Road Attwood, VIC 3031, Australia. 38Faculty of Land and Food Resources, University of Melbourne, Royal Parade, Parkville, VIC 3010, Australia. 39Smurfit Institute of Genetics, Trinity College, Dublin 2, Ireland. 40Department of Molecular Biology and Biochemistry, Simon Fraser University, 8888 University Drive, Burnaby, BC, V5A 1S6, Canada.
*To whom correspondence and requests for materials should be addressed. E-mail: curt.vantassell@ars.usda.gov (C.P.V.T.), taylorjerr@missouri.edu (J.F.T.), and agibbs@bcm.tmc.edu (R.A.G.)
† In memoriam.
Footnotes
References and Notes
- 1.Kappes SM, et al. J Anim Sci. 2000;78:3053. doi: 10.2527/2000.78123053x. [DOI] [PubMed] [Google Scholar]
- 2.Barendse W, et al. Genetics. 2007;176:1893. doi: 10.1534/genetics.107.072637. [DOI] [PMC free article] [PubMed] [Google Scholar]
- 3.Bradley DG, et al. Proc Natl Acad Sci USA. 1996;93:5131. [Google Scholar]
- 4.Loftus RT, et al. Mol Ecol. 1999;8:2015. doi: 10.1046/j.1365-294x.1999.00805.x. [DOI] [PubMed] [Google Scholar]
- 5.Edwards CJ, et al. Proc R Soc London B Biol Sci. 2007;274:1377. doi: 10.1098/rspb.2007.0020. [DOI] [PMC free article] [PubMed] [Google Scholar]
- 6.Grobet L, et al. Nat Genet. 1997;17:71. doi: 10.1038/ng0997-71. [DOI] [PubMed] [Google Scholar]
- 7.Grisart B, et al. Genome Res. 2002;12:222. doi: 10.1101/gr.224202. [DOI] [PubMed] [Google Scholar]
- 8.Cohen-Zinder M, et al. Genome Res. 2005;15:936. doi: 10.1101/gr.3806705. [DOI] [PMC free article] [PubMed] [Google Scholar]
- 9.Schreiber A, et al. J Hered. 1999;90:165. doi: 10.1093/jhered/90.1.165. [DOI] [PubMed] [Google Scholar]
- 10.Materials and methods are available as supporting materials on Science Online.
- 11.Gao H, Williamson S, Bustamante CD. Genetics. 2007;176:1635. doi: 10.1534/genetics.107.072371. [DOI] [PMC free article] [PubMed] [Google Scholar]
- 12.Patterson N, Price AL, Reich D. PLoS Genet. 2006;2:e190. doi: 10.1371/journal.pgen.0020190. [DOI] [PMC free article] [PubMed] [Google Scholar]
- 13.Tenesa A, et al. Genome Res. 2007;17:520. doi: 10.1101/gr.6023607. [DOI] [PMC free article] [PubMed] [Google Scholar]
- 14.Lindblad-Toh K, et al. Nature. 2005;438:803. doi: 10.1038/nature04338. [DOI] [PubMed] [Google Scholar]
- 15.Sved JA. Theor Popul Biol. 1971;2:125. doi: 10.1016/0040-5809(71)90011-6. [DOI] [PubMed] [Google Scholar]
- 16.Voight BF, Kudaravalli S, Wen X, Pritchard JK. PLoS Biol. 2006;4:e72. doi: 10.1371/journal.pbio.0040072. [DOI] [PMC free article] [PubMed] [Google Scholar]
- 17.Akey JM, Zhang G, Zhang K, Jin L, Shriver MD. Genome Res. 2002;12:1805. doi: 10.1101/gr.631202. [DOI] [PMC free article] [PubMed] [Google Scholar]
- 18.Nielsen R, et al. Genome Res. 2005;15:1566. doi: 10.1101/gr.4252305. [DOI] [PMC free article] [PubMed] [Google Scholar]
- 19.Barendse W, et al. Aust J Exp Agric. 2004;44:669. [Google Scholar]
- 20.Clutton-Brock J. A Natural History of Domesticated Mammals. 2. Cambridge Univ. Press; Cambridge: 1999. p. 238. [Google Scholar]
- 21.Sabeti PC, et al. Nature. 2007;449:913. doi: 10.1038/nature06250. [DOI] [PMC free article] [PubMed] [Google Scholar]
- 22.Tishkoff SA, et al. Nat Genet. 2007;39:31. doi: 10.1038/ng1946. [DOI] [PMC free article] [PubMed] [Google Scholar]
- 23.Barendse W, et al. Genetics. 2007;176:2601. doi: 10.1534/genetics.107.074328. [DOI] [PMC free article] [PubMed] [Google Scholar]
- 24.The Bovine Hapmap Consortium funded by the National Human Genome Research Institute of the National Institutes of Health, U.S. Department of Agriculture’s Agricultural Research Service (USDA-ARS) and Cooperative State Research, Education and Extension Service (USDA CSREES), the Research Council of Norway, as well as: American Angus Association, American Hereford Association, American Jersey Cattle Association, AgResearch (New Zealand), Beef CRC and Meat and Livestock Australia for the Australian Brahman Breeders Association, Beefmaster Breeders United, The Brazilian Agricultural Research Corporation (Embrapa), Brown Swiss Association, Commonwealth Scientific and Industrial Research Organization, Dairy InSight, GENO Breeding and Artificial Insemination Association—Norway, Herd Book/France Limousin Selection, Holstein Association USA, International Atomic Energy Agency (IAEA)—United Nations Food and Agriculture Organization (FAO)/IAEA Vienna, International Livestock Research Institute—Kenya, Italian Piedmontese Breeders—Parco Tecnologico Padano, Italian Romagnola Society—Università Cattolica del Sacro Cuore, Livestock Improvement Corporation, Meat and Wool New Zealand. North American Limousin Foundation, Red Angus Association of America, Roslin Institute for UK Guernsey, and Sygen (now Genus). See SOM for additional acknowledgements. The genome sequence (AAFC03000000) and SNPs (SOM) are available from NCBI.
Associated Data
This section collects any data citations, data availability statements, or supplementary materials included in this article.