

Abstract
Obesity is associated with a decrease in energy expenditure relative to energy intake. The decrease in physical activity associated with obesity in several species, including humans, contributes to decreased energy expenditure. Several hormones and neuropeptides that affect appetite also modulate physical activity, including neuromedin U (NMU), a peptide found in the gut and brain. We have demonstrated that NMU microinjected into the hypothalamic paraventricular nucleus (PVN) in rats increases the energy expenditure associated with physical activity, called non-exercise activity thermogenesis (NEAT). Here we examined whether obesity in rats is related to decreased sensitivity of the PVN to the locomotor-activating effect of NMU. Diet-induced obese (DIO) rats and lean, diet-resistant (DR) rats were given PVN microinjections of increasing doses of NMU both before and after one month on a high-fat diet. We found that NMU increases physical activity, energy expenditure, and NEAT in a dose-dependent manner in both DR and DIO rats, both before and after one month on the high-fat diet. Before high-fat feeding, the obesity-prone and lean rats showed similar levels of physical activity after intra-PVN microinjections of NMU. After one month of the high-fat diet, however, the obesity-resistant rats showed significantly more NMU-induced physical activity compared to the obese DIO rats. Taken together with previous studies, these results suggest that obesity may represent a state associated with decreased central sensitivity to neuropeptides such as NMU that increase physical activity and therefore energy expenditure.
Keywords: physical activity, energy expenditure, obesity, non-exercise activity thermogenesis, NEAT, diet-induced obese (DIO) rats
1. Introduction
Low levels of physical activity are consistently considered a risk factor for obesity and related diseases as well as decreased quality of life [92,93]. The energy expended in physical activity is the most variable and labile component of total energy expenditure, underscoring its potential to effect change in body weight [12,14,60]. Low levels of non-exercise activity thermogenesis, or NEAT, are associated with increased fat gain in humans [61]. Moreover, the ability to increase NEAT after overfeeding is correlated with an individual’s ability to fend off weight gain [61]. Lastly, obese individuals spend less time standing and ambulating compared to lean people [62], which impacts energy expenditure and therefore promotes further weight gain. Considering the increasing recognition of the importance of physical activity and specifically NEAT in maintaining a healthy weight in a sedentary society [12,61,62], relatively little is known regarding the neural and physiological mechanisms regulating physical activity, or how diet and obesity may affect these mechanisms.
Many of the same hormones and neuropeptides that affect appetite have also been found to alter physical activity and NEAT which, in animals, is simply the energy expenditure of all activity [8,72,86,87]. For example, stimulation of specific brain regions with orexin (hypocretin) increases NEAT in rats [39,40]. These brain areas and their associated neuropeptides are in an ideal position to sense changes in energy balance and alter physical activity accordingly. One of these neuropeptides, neuromedin U (NMU), is present in brain nuclei that modulate energy balance [34]. Another peptide, neuromedin S (NMS), shares structural commonalities with NMU and acts on the same receptors [33,67]. These peptides are present in fibers and cell bodies in hypothalamic nuclei including the arcuate, paraventricular, and suprachiasmatic nuclei [2,29,34,44,79,84]. NMU may alter energy expenditure in coordination with energy intake to promote negative energy balance. Data from human populations demonstrate that amino acid variants in the NMU peptide are associated with overweight and obesity [22], highlighting the potential importance of NMU in human energy balance.
The primary CNS receptor for NMU, the NMU receptor-2 (NMU2R), is found in brain sites that are important in regulating appetite and metabolism including the PVN [17,19,21,29,79,82]. The PVN is involved in fat mobilization and sympathetic activation [3,41] and, moreover, shows differential noradrenergic activation in lean and obesity-prone rats [50]. Furthermore, the PVN is a site of action of numerous peptides that increase physical activity and energy expenditure, including NMU [39,43,85,96]. Several lines of evidence implicate changes in NMU with obesity. Expression of brain NMU changes with fasting and obesity [19,29,34], and overexpression of NMU results in decreased body weight, fat content, and food intake, as well as decreased body weight gain on a high-fat diet [44]. Mice deficient in NMU are obese, hyperphagic, and have increased adiposity, and also show decreased locomotor activity and energy expenditure [24]. Site-specific or i.c.v. application of NMU to the brain decreases appetite and increases physical activity and energy expenditure [17,25,29,34,37,69,70,73,96]. Consequently, NMU is a plausible candidate for the promotion of negative energy balance through increasing the energy expenditure of activity.
Several obese rodent models have been used to investigate the physiological control of energy balance. Diet-induced obese (DIO) and diet-resistant (DR) rats were developed through selective breeding for weight gain on a high-fat diet [53,56]. The strains of rats differ in body weight on a standard diet; the DIO rats increase their body weight on a high-energy diet whereas DR rats on the same diet do not differ in body weight from chow-fed control DR rats (unpublished data)[53]. In fact, it may be the DR rats, rather than the DIO rats, which are unusual in that their spontaneous activity is high and their body weight low compared to both DIO and control Sprague-Dawley rats [87]. The causes of the disparity in body weight between DIO and DR rats are multifaceted and polygenic, and physiological changes can be seen in the DIO rats before they develop obesity, including decreases in insulin and leptin sensitivities [54,57,89]. In this way, this model of obesity may better represent the development human obesity, which has a multitude of bases including hereditary and dietary causes.
In the following studies, we used DIO and DR rats to determine if differences in levels of physical activity seen in these rats [72] might be attributable to decreased sensitivity to the physical activity-inducing peptide NMU. Others and we have demonstrated that the ability of orexin to increase physical activity and energy expenditure is enhanced in lean compared to obese rats [72,87]. First, we tested the hypothesis that the ability of NMU to increase physical activity and energy expenditure is decreased in obesity-prone DIO rats compared to lean DR rats. Second, we compared the effects of NMU on physical activity and energy expenditure before and after high-fat feeding in DR and DIO rats. Lastly, we determined if the differences seen in NMU-induced physical activity in DR and DIO rats might be due to differences in the amount of NMU stored and released into the PVN.
2. Results
Body weight, food intake, and body composition
As illustrated in Table 1 and Fig. 1, the body weight analysis showed a significant interaction as well as significant main effects of both group and diet. DIO and DR rats both gained weight on the high-fat diet, but the DIO rats gained significantly more. The percent increase in body weight over the same period of time did not significantly differ between DIO and DR rats. The obesity-prone rats were 32.2% heavier than the lean rats on the standard chow immediately before high-fat feeding and 35.7% heavier than the DR rats after 29 days on the high-fat diet. The average daily food intake over the 29 days of high-fat feeding was significantly greater in the DIO rats compared to the DR rats. Lastly, the food efficiency (the g of body weight gained from each g of high-fat chow eaten) was significantly greater in the DIO rats compared to the DR rats (p<0.05). The DIO rats had a significantly higher percent of body fat compared to the DR rats (Figure 1C; in mean ± SE; DIO: 24.16% ± 1.05%, DR: 19.84 % ± 1.06%, p<0.01), as well as significantly more fat mass and fat-free mass (fat mass, DIO: 147 ± 8g, DR: 87 ± 3g, p<0.0001; fat-free mass: DIO: 641 ± 17g, DR: 352 ± 11g, p<0.001). In summary, DIO rats consumed more food, gained more weight, and had significantly higher carcass lipid content after high-fat feeding compared to DR rats.
Table 1.
Body weight in diet-induced obese (DIO) and diet-resistant (DR) rats before (pre) and after (post) one month on a high-fat diet.
| Baseline BW (g) | High-fat diet BW (g) | Increase in BW (g) | Increase in BW (%) | BW (% of DR) | * Feed efficiency | Food intake/day | ||
|---|---|---|---|---|---|---|---|---|
| pre | post | |||||||
| DIO | 472±13 | 604±18 | 132±7 | 25±3 | 132 | 136 | 0.23±0.02 | 20±0.53 |
| DR | 357±11 | 445±9 | 90±8 | 28±1 | --- | --- | 0.19±0.01 | 16±0.35 |
| p-value | <0.0001 | <0.001 | <0.001 | ns | --- | --- | <0.05 | =0.00001 |
Mean ± SEM
feed efficiency: body weight gain (g) per g food intake
Figure 1.

Body weight and food intake of diet-induced obese (DIO) and lean, diet-resistant (DR) rats before and after high-fat feeding. (A) The DIO rats were significantly heavier than the DR rats both before and after high-fat feeding. (B) The ratio of body weight gain to food intake (feed efficiency) on a high-fat diet was significantly greater in DIO rats than DR rats: DIO rats gained significantly more body weight per each g of chow eaten. (C) Body composition in diet-induced obese (DIO) and diet-resistant (DR) rats after 1 month of high-fat feeding. The DIO rats had significantly more fat mass, lean mass, and percent body fat compared to DR rats (p<0.01). *greater than DR rats, p<0.05; **greater than DR rats at the same time point, p<0.0001.
Dose-response to NMU: Baseline feeding
Activity and metabolic data are presented in Table 2 and Fig. 2. For the baseline measurement (i.e., on the standard diet), NMU significantly increased horizontal, ambulatory, and total activity counts; no effect of NMU was seen on vertical activity. We found no significant interactions between obesity propensity (i.e., DIO or DR) and dose of NMU in any activity or metabolic variable. NMU also significantly increased energy expenditure per animal, per gram body weight, and per metabolic body weight (i.e., body weight0.75) in DIO and DR rats. On the standard chow, DIO and DR rats differed only in whole animal thermogenesis, with DIO rats showing greater energy expenditure than DR rats. No physical activity variable showed any significant differences between DIO and DR rats, and there were no significant effects of group or NMU on RQ. In summary, microinjections of NMU into the PVN region significantly increased physical activity and energy expenditure in both DIO and DR rats on a standard diet, and DIO and DR rats were affected to a similar degree. In general, the doses of NMU used by others to successfully alter physical activity in rats (0.3 nmoles NMU in 1 μl vehicle) were similar to those employed here [96].
Table 2.
Physical activity and energy expenditure (EE) induced by neuromedin U (NMU) in diet-induced obese (DIO) and diet-resistant (DR) rats both before (pre) and after (post) one month on a high-fat diet (mean ± SEM).
| NMU (ng) |
VO2 (ml/kg/hr) |
EE (100x Kcal/g0.75/min) |
REE (Kcal/hr) |
RQ | Vertical (counts/min) |
Total (counts/min) |
|||||||
|---|---|---|---|---|---|---|---|---|---|---|---|---|---|
| pre | post | pre | post | pre | post | pre | post | pre | post | pre | post | ||
| DIO | 0.000 | 1458±72 | 1482±120 | 3.30±0.16 | 3.45±0.24 | 2.38±0.07 | 3.36±0.35 | 0.88±0.02 | 0.77±0.01 | 0.56±0.26 | 0.24±0.16 | 113±19 | 98±13 |
| 0.125 | 1762±90 | 1556±176 | 3.98±0.23 | 3.70±0.23 | 2.44±0.15 | 3.25±0.14 | 0.91±0.02 | 0.80±0.01 | 1.98±0.57 | 0.28±0.11 | 225±35 | 149±33 | |
| 0.250 | 1647±147 | 1570±67 | 3.72±0.34 | 3.50±0.16 | 2.34±0.06 | 3.02±0.15 | 0.88±0.02 | 0.78±0.01 | 0.72±0.33 | 0.81±0.33 | 186±47 | 136±17 | |
| 0.500 | 1777±100 | 1639±64 | 4.03±.022 | 3.87±0.18 | 2.46±0.12 | 3.22±0.10 | 0.90±0.02 | 0.80±0.01 | 1.33±0.51 | 0.74±0.33 | 234±34 | 136±30 | |
| DR | 0.000 | 1553±93 | 1620±73 | 3.31±0.19 | 3.52±0.17 | 2.18±0.11 | 2.77±0.12 | 0.88±0.03 | 0.77±0.01 | 1.38±0.46 | 1.01±0.60 | 113±28 | 132±36 |
| 0.125 | 1417±137 | 2012±91 | 3.01±0.29 | 4.41±0.21 | 2.09±0.10 | 2.39±0.19 | 0.75±0.04 | 0.79±0.01 | 1.14±0.49 | 1.33±0.61 | 140±30 | 264±38 | |
| 0.250 | 1755±181 | 1780±123 | 3.70±0.17 | 3.88±0.27 | 2.12±0.07 | 2.79±0.09 | 0.86±0.03 | 0.79±0.01 | 1.72±0.32 | 0.89±0.39 | 196±36 | 218±37 | |
| 0.500 | 1873±79 | 1871±132 | 4.02±0.16 | 4.09±0.29 | 2.09±0.15 | 2.78±0.14 | 0.90±0.03 | 0.78±0.01 | 2.14±0.71 | 1.09±0.18 | 213±42 | 264±41 | |
| p-value | NMU | <0.01 | ns | <0.01 | <0.01 | ns | ns | ns | Ns | ns | ns | <0.01 | <0.01 |
| group | ns | <0.05 | ns | ns | N/A | N/A | ns | Ns | ns | ns | ns | <0.05 | |
Figure 2.
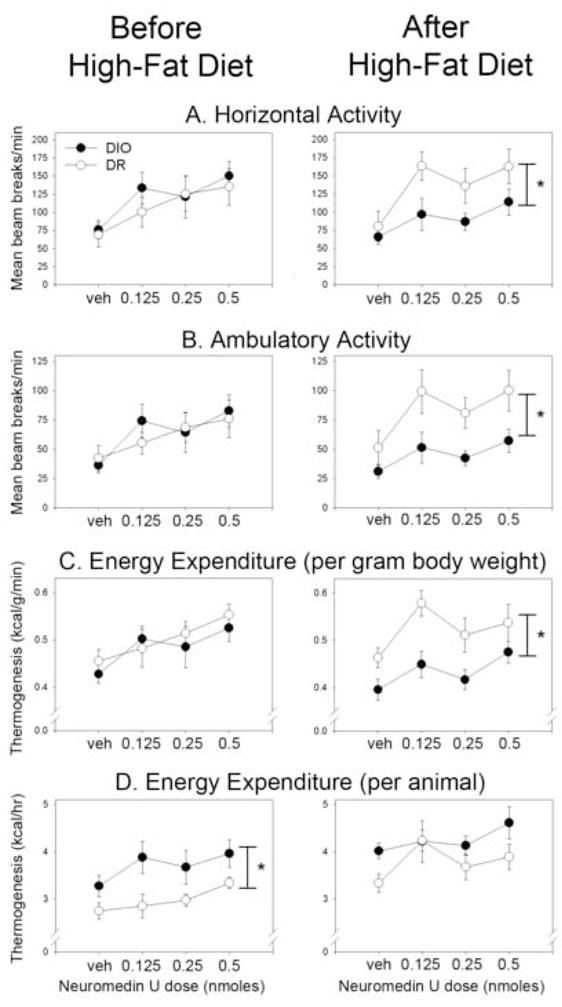
Physical activity energy expenditure after microinjections of neuromedin U (NMU) into the hypothalamic paraventricular nucleus (PVN). Diet-induced obese (DIO) and diet-resistant (DR) rats both showed dose-dependent increases in (A) horizontal and (B) ambulatory physical activity before and after one month on a high-fat diet. The DR rats showed significantly more physical activity in response to NMU compared to their obese counterparts only after high-fat feeding. (C) For energy expenditure divided by body weight, a significant difference between energy expenditure after intra-PVN NMU in DIO and DR rats was seen only after high-fat feeding. (D) Whole-animal energy expenditure was significantly different between DIO and DR rats before but not after high-fat feeding. Response to vehicle (veh) microinjection did not significantly differ between DR and DIO rats in any conditions. *DR≠DIO, p<0.05.
Dose-response to NMU: High-fat feeding
Table 2 and Fig. 2 show the effects of NMU on physical activity in DIO and DR rats during the second measurement (i.e., after 29 days on the high-fat diet). As with the baseline measurement, NMU significantly increased horizontal, ambulatory, and total activity counts, but not vertical activity in DIO and DR rats. After the rats were fed the high-fat chow, however, we also detected group differences in activity where the DR rats showed significantly more activity in response to PVN injections of NMU compared to the DIO rats. For energy expenditure per animal, the DIO and DR rats did not significantly differ in whole-animal thermogenesis, despite the divergent body weights in these groups of rats. The energy expended per gram body weight showed significant effects of both group and NMU, and the energy expended per metabolic body weight showed only a main effect of NMU, but no difference between groups. As before, RQ showed no effects of either group or NMU. In summary, after one month of a high-fat diet, the ability of a range of intra-PVN NMU concentrations to induce physical activity and raise energy expenditure was diminished in DIO compared to DR rats.
Changes between baseline and high-fat feeding
For horizontal, ambulatory, and total activity, we found significant interactions at 0.125 nmol and 0.5 nmol NMU: DR rats showed significantly more activity at each of these doses of NMU compared to DIO rats (but no group differences were seen in activity after vehicle microinjection) after high-fat feeding but not on the standard diet. The energy expenditure per animal showed a significant interaction only at the 0.125 nmol dose, with DR but not DIO rats having a significant increase in whole-animal thermogenesis, and with DIO rats expending more energy than DR rats before but not after high-fat feeding despite the greater increase in body weight seen in DIO rats. After high-fat feeding, DIO rats expended significantly more energy than DR rats after vehicle but not after microinjection of any dose of NMU. The energy expenditure per gram body weight showed a significant interaction at 0.125 nmol NMU, where DR rats had greater energy expenditure per gram body weight than DIO rats, but only after 29 days on the high-fat diet; the same effect was seen when metabolic body weight was used. RQ decreased after high-fat feeding to a similar extent in both DIO and DR rats and at every dose of NMU. Lastly, REE associated with vehicle microinjections was not significantly different from REE associated with any dose of NMU in either the DIO or DR rats, neither before or after high-fat feeding.
Radioimmunoassay for NMU
No significant effects were found in PVN NMU concentrations due to either obesity propensity (DIO vs. DR rats) or diet, and we found no interaction between rat strain and diet. The NMU concentrations were, in pg NMU/μg protein (mean ± SEM): DIO rats, standard diet (29.9±2.9) and high-fat diet (31.0±1.9); DR rats, standard diet (32.6±3.8) and high-fat diet (29.1±2.9).
3. Discussion
Physical activity levels have decreased in parallel with the emergence of obesity worldwide [7,15,18,30,31,36,74,81,92,93,97]. Reductions in physical activity and NEAT are associated with weight gain and obesity in both rats [71,87] and humans [61,62]. To investigate how NEAT changes with increasing obesity, we examined potential brain mechanisms that modulate physical activity and energy expenditure. One brain region critical to the control of energy balance is the PVN, which is important in the regulation of energy intake, energy expenditure, physical activity, and in obesity [3,39,41,43,72,73,85,96]. We have previously demonstrated that sensitivity of the PVN to the locomotor-activating effects of orexin decreases with obesity in rats [72]. Here, we examined NMU, a neuropeptide that modulates physical activity through its actions on brain regions that integrate signals relating to energy balance and body weight [40,42,48,71,73,85,87]. Because NMU affects energy balance through changes in both energy intake [24,25,34,37,44,69,96] and expenditure [17,23–25,88,96], in part through increases in physical activity [24,69,73], we examined how NMU affects physical activity in obese and non-obese rats.
These studies show that, first, obesity-prone and obesity-resistant rats demonstrated NMU-induced increases in physical activity that are comparable to outbred rats [73], and that it is not REE but rather the energy expenditure of activity—the animal counterpart of human NEAT—that increases accordingly. Unlike the rats in our previous study [73], however, many of the DIO rats and high-fat fed DR rats had uneven dose-response curves that showed peaks at a low dose (Fig. 2). Second, we questioned whether changes in physical activity induced by intra-PVN NMU could contribute to obesity in DIO rats. We show that the high-fat-fed DR rats have more NMU-induced horizontal, ambulatory, and total activity compared to DIO rats, suggesting that endogenous NMU may evoke a blunted physical activity response in obese DIO rats. This dampened sensitivity may contribute to the lower levels of physical activity seen in DIO rats on a high-fat diet [72], which may be an important factor in the development and maintenance of obesity. Thus, NMU mediates changes in NEAT, and decreases in NMU sensitivity may be important in the decreased physical activity seen in obesity.
We can speculate as to the potential mechanisms through which NMU alters physical activity and why this effect is altered in obesity. Whereas some differences between DIO and DR rats can be seen before the onset of obesity [11,52,54], the differential sensitivity to NMU was only seen after high-fat feeding. Therefore, when hypothesizing how NMU sensitivity is altered, we can focus on the potential effects of both diet and obesity. We examined whether changes in PVN NMU sensitivity are associated with an increased NMU tone by quantifying the amount of NMU contained within the PVN of DIO and DR rats on regular and high-fat chow using micropunched PVN tissue. Decreases in neuropeptide concentrations in target brain regions have been interpreted as being the consequence of increased release and depletion of the neuropeptide [10]. We found no significant differences in PVN NMU content associated with either diet or obesity propensity. Therefore, our data do not support the hypothesis that altered tonic NMU release into the PVN is a causal factor in the decreased NMU sensitivity seen in obese rats. It remains possible that we could not detect a change in steady-state NMU release compensated for by altered NMU synthesis. It is also possible that NMU2R levels in the PVN are altered in obese rats after high-fat feeding, which would then modify PVN sensitivity to the locomotor-activating effects of NMU. We have no data to address this question, though. The mechanistic change causing decreased NMU sensitivity in the PVN that we report here is currently unknown, but plausible mechanisms can be the subject of future investigation.
The neuromedin projections to the PVN may originate from several sources. NMU neurons are present in hindbrain and hypothalamic nuclei that sense energy balance signals [19,34,35,84], and alteration of NMU release in the PVN may be one mechanism through which these brain regions regulate energy balance. In addition, another hypothalamic region contains neuromedin-expressing neurons, namely the suprachiasmatic nucleus (SCN), the primary circadian clock in mammals [67,68]. Because the SCN projects to the parovcellar region of the PVN [28,47], the SCN may impose a daily rhythm on physical activity and energy expenditure in part though the actions of neuromedin in the PVN. This is an especially intriguing possibility given the links between clock gene deficiencies and obesity [20,90], and given the decreased amplitude of the daily rhythm in energy expenditure seen in diabetic obese rats [32,66].
Once PVN neurons containing NMU receptors are activated, NMU may exert its effects on physical activity through corticotrophin-releasing hormone (CRH). Mice deficient in CRH do not show NMU-suppressed feeding or NMU-induced increases in oxygen consumption or body temperature [25]. A CRH antagonist abolishes the effects of NMU on locomotor activity [23], and NMU stimulates the release of CRH in hypothalamic explants [96]. Neurons containing NMU project to the PVN, [2,84] and PVN neurons (both CRH-containing and other neurons) are sensitive to NMU [75,77,78,98]. NMU may activate brain mechanisms through which stressors increase physical activity in order to increase NEAT. Furthermore, compared to DR rats, DIO rats show a dampened stress response, no stress-induced CRH expression in the PVN [58], and decreased amygdala CRH mRNA [65]. Taken together, these results suggest that decreases in the ability of NMU to induce physical activity might possibly be the result of downstream changes in CRH sensitivity in DIO rats rather than a direct effect on brain NMU.
Obesity-resistant rats demonstrated greater levels of NMU-induced activity and the associated energy expenditure (i.e., NEAT) compared to obesity-prone rats, but only after high-fat feeding. Two possible explanations present themselves. First, the change in sensitivity might be due primarily to increased dietary fat, as fat intake alters other hypothalamic systems important in energy balance. Hypothalamic orexin expression is increased after high-fat feeding as well as in response to increased circulating triglycerides [9,95], and the hypothalamus has the capacity to sense fatty acids as an indicator of energy surplus [46]. If fat intake alters NMU sensitivity in the PVN, another factor must account for the differential susceptibility of DIO and DR rats. Second, the decreased sensitivity to peptides such as NMU or orexin could be secondary to the obesity and the concomitant effects on adiposity seen in the DIO rats both in this study and elsewhere [59], including changes in circulating hormones [16,64,99] and other physiological sequalae of obesity. Conditions of positive or negative energy balance can change brain NMU expression [19,29,34]. Also, fasting decreases NMU expression in the rat arcuate nucleus [29], similar to other feeding-inhibitory signals that act in the arcuate nucleus [6,45]. The NMU neurons projecting to the PVN may originate in the nucleus of the solitary tract and be responsive to the gastrointestinal satiety hormone CCK [35]. Another way in which diet and adiposity may affect brain NMU is through leptin, which may exert its actions on appetite in part, though not entirely [24], through brain NMU [37]. NMU expression is decreased in brain nuclei of leptin- and leptin receptor-deficient rodents [29,34], which is consistent with the idea that endogenous leptin decreases appetite through increasing NMU expression. Pre-obese DIO rats are less sensitive to the anorectic and NPY-suppressive effects of leptin and show less pSTAT3 induction compared to DR rats [52,54]. Though the neural mechanisms through which leptin affects energy intake and expenditure may differ, it is possible that leptin acts through NMU to modulate physical activity levels, and that changes in adiposity and leptin levels are eventually reflected in changes in NMU sensitivity. In this way, adiposity may act through leptin to effect the changes in NMU sensitivity seen in this study.
One limitation of our study is the lack of pre-manipulation body composition data demonstrating the relative weight gain of DIO and DR rats that would enable us to express the thermogenesis data in terms of lean body mass. The characteristic changes in body weight and adiposity in DIO and DR rats are well known, however [51,55,56], as illustrated by the higher body fat content in the DIO in this study (Fig. 1C). To account for the difficulty in comparing energy expenditure between rats of different sizes and body compositions, we expressed thermogenesis both per animal and in terms of body weight or metabolic body weight (Table 2, Fig. 2); neither approach is ideal [1], but the analyses still yield useful information. First, we see that, compared to DIO rats, DR rats had greater NMU-induced energy expenditure per gram body weight or metabolic body weight only after the high-fat diet, similar to the pattern of NMU-induced physical activity (Fig. 2C and Table 2). Second, whole-animal energy expenditure is nearly always greater in larger rats (e.g., DIO) compared to smaller ones (e.g., DR). Therefore, we would have anticipated that the group difference between the DIO and DR rats’ NMU-associated energy expenditure would increase after the augmentation of body weight differences by high-fat feeding. Instead, the opposite occurred: no significant difference was seen between the obese and DR rats’ NMU-induced energy expenditure after the dietary manipulation (Fig. 2D), when the group difference in body weight had widened. No matter how energy expenditure is expressed, the data indicate that NMU increases energy expenditure to a greater extent in DR compared to DIO rats upon high-fat feeding, and that this is primarily due to NMU-induced physical activity.
These studies demonstrate that, with increasing obesity subsequent to a high-fat diet, the PVN shows decreased sensitivity to the physical activity-activating properties of NMU, and that this is reflected in decreased NEAT. This decrease in sensitivity to activity-promoting peptides may account for the decreased physical activity levels seen in high-fat-fed DIO rats [72]. Taken together with previous results [71,87], these data may be relevant to the etiology of obesity because understanding the mechanisms of changes in physical activity may allow for the prevention of decreased energy expenditure of activity and, therefore, prevention of weight gain. Changing the energy expenditure of activity has the capacity to meaningfully affect body weight [12,61,62]. Moreover, pharmaceutical interventions can be targeted to peptides such as NMU that affect physical activity rather than solely aimed at altering appetite. Increasing NEAT may be a critical component to the prevention of obesity in our increasingly sedentary society [7,12,27,61,62,91,94].
4. Experimental Procedure
Animals
Nineteen adult male DIO or DR Sprague-Dawley rats (10 DIO rats and 9 DR rats, 8 weeks old at arrival; Charles River Labs, Wilmington, MA) were used for the measurement of physical activity and energy expenditure in response to intra-PVN NMU. An additional 13 DIO and 13 DR rats were used to examine NMU concentrations in the PVN. Rats were housed individually (microinjection study) or in groups of 2–3 (micropunch study) with food (Laboratory Rodent Diet 5001, PMI Nutrition International, St. Louis, MO) and water available ad libitum, and exposed to a 12:12 hour light: dark cycle (lights on at 0600 h CST). All procedures were approved by the Mayo Foundation Institutional Animal Care and Use Committee.
Stereotaxic surgery
All cannulation supplies (guide cannulae, dummy cannulae, and microinjection needles) were obtained from Plastics One (Roanoke, VA). Rats underwent surgery for the implantation of chronic unilateral guide cannulae aimed at the PVN as described previously [73]. Each rat was first anesthetized with pentobarbital sodium (Nembutal, 50 mg/kg) then shaved and mounted into the stereotaxic frame (David Kopf Instruments, Tujunga, CA). We used the following coordinates to implant the 26-gauge guide cannula so that the injection was aimed at the PVN: AP −1.3, ML +0.5, DV −7.3; bregma and the skull (for DV) were used as the reference points. The 33-gauge injector needle extended 1mm beyond the tip of the guide cannula. For up to four days after surgery, rats were given pain relief (0.05 mg/kg buprenex) as needed.
PVN sensitivity to NMU microinjections
For microinjection of NMU into the PVN, each rat was removed from its acclimation cage and gently restrained. After the dummy cannula was unscrewed from the unilateral guide cannula, the microinjection needle was inserted. The microinjection needle was attached to a 2 μl Hamilton syringe using polyethylene tubing. The animal was slowly injected with 500 nl of NMU (Phoenix Pharmaceuticals, Belmont, CA) or vehicle (aCSF) over 30 sec, and the needle remained in place for an extra 30 sec before removal. The spread of 500nl microinjections through brain tissue is comparable to 200nl injections [63], making it improbable that the NMU was acting on hypothalamic nuclei other than the PVN, especially considering that the peptide is more likely than indicator dye to have its spread limited by breakdown or binding. After injection, we measured physical activity and energy expenditure of DIO and DR rats both before and after high-fat feeding. We measured NEAT in each rat after PVN microinjections of the following doses of NMU: 0, 0.125, 0.25, and 0.5 nmol. These doses were based on previous data demonstrating that this range of NMU concentrations encompassed the range of sensitivity of the rat PVN to NMU with respect to initiation of physical activity [73]. Rats were measured in pairs, one DIO and one DR at a time, with one rat assigned to each calorimeter (each calorimeter was used to measure both DIO and DR rats on a given day). Up to four pairs of rats were measured on one day, with each pair receiving a different concentration of NMU on each of four consecutive days, each pair receiving the four doses of NMU in a different order, and a given pair undergoing measurement at the same time of day on each day of treatment.
After these measurements, rats were returned to the animal room. Each rat was then placed on a high-fat diet (Rodent Diet D12492; Research Diets, Inc, New Brunswick, NJ) for 29 days; this diet is specific for increased calories from fat, not carbohydrates, compared to the standard diet. We used a diet very high in fat to maximize potential strain differences in a short period of time, and also to compare these results to other studies using this diet [72]. The high-fat diet had 20% kcal from each protein and carbohydrate and 60% kcal from fat, and the standard rodent diet contained 28% kcal from protein, 12% kcal from fat, and 60% kcal from carbohydrate. We took daily measurements of body weight and food intake throughout this period. Starting on the 30th day of high-fat feeding, we started the second set of measurements which were identical to the first set. The same rats were tested in the same order on each day and given the same order of doses over the 4 days during the second set of measurements as the first set.
Physical activity and energy expenditure
To assess NEAT in rats, we measured physical activity and energy expenditure without access to an exercise wheel. Although activity in a running wheel may be modulated by similar brain circuits as spontaneous activity, the presence of running wheels results in several aberrant effects on the amount and pattern of activity as well as on other aspects of energy balance in several rodent species including rats [4,5,13,38,80,83] and thus has independent, confounding influences on energy expenditure. All measurements took place during the light phase of the activity cycle. Though NMU-induced activity can also be seen during the dark (active) phase of the cycle in rats [73], measurement of activity during the light phase is less likely to be affected by acute light exposure and the underlying activity fluctuations throughout the night [49]. Prior to calorimetric measurement, each rat was acclimated in a chamber that was identical is size, shape, material, and texture to the calorimetry chamber (i.e., a clear cylindrical chamber with a circular-grid-patterned base; diameter = 30cm, height = 20cm, volume = 14L), but without regulated air flow. After a day of acclimation, we assessed physical activity and energy expenditure after injections of the PVN with vehicle or NMU. Physical activity was measured using Opto-M Varimex Minor activity monitors (Columbus Instruments, Columbus, OH), which measure physical activity using infrared beam breaks in 3 axes. We measured horizontal, vertical (i.e., rearing), and ambulatory activity (vertical activity excluding repetitive, stationary beam breaks). Energy expenditure was measured using a small animal calorimeter (Columbus Instruments). The beam-break apparatus was placed around the calorimetry chamber to facilitate concurrent measurements of energy expenditure and physical activity.
Following PVN microinjection, the rat was placed into the calorimetry chamber without access to food or water. The chamber was then sealed and the measurement commenced. Room air was pumped into the chamber at 3.0–4.0 liters/min, and expired air was sampled at 0.7 liters/minute. We measured metabolic variables once every minute excluding the first 20 min after microinjection and a 3-min reference period after every 30 1-min samples; each measurement lasted 2 hours. Oxygen consumption and carbon dioxide production were measured and used to calculate energy expenditure and respiratory quotient (RQ, the ratio of CO2 produced to O2 consumed). We calculated the average RQ, energy expenditure per gram body weight or metabolic body weight (body weight0.75), energy expenditure per animal, and physical activity counts per minute over the first hour after NMU microinjection because this is when the majority of the NMU-induced physical activity occurs. We continued the measurement period to capture resting energy expenditure (REE), which was calculated by averaging the energy expenditure associated with at least 2 min of zero activity counts over the 2-hr course of the measurement (REE could not be calculated for the first hour of the measurement only because NMU often induced enough activity so that no zero activity counts were contained in the first hour). At the end of the 2-hr measurement, we stopped data collection and returned the rat to its acclimation chamber.
Microinjection site
At the end of the study, we determined the exact site of the microinjection needle relative to the PVN. Each rat was given a terminal injection of pentobarbital sodium and the brain was removed after a microinjection of India ink (500 nl) into the PVN. Brains were stored in 10% buffered formalin (Fisher Scientific) followed by 30% sucrose in formalin before being sectioned into 50 μm sections using a Leica cryostat. Sections were mounted onto Fisher Superfrost Plus slides, stained with cresyl violet, and affixed with cover slips using DPX. Using a microscope with a calibrated reticle, we determined the injection site of each animal and its distance from the PVN. The microinjections of the PVN were not specific to either the magnocellular or parvocellular region. Datasets from any animal in which the injection site was more than 250 μm from the PVN, or from any animal that had more than one missing data point, were excluded from the final analysis. The final animals numbers used for data analysis were 7 (DIO) and 6 (DR). For daily body weight and food intake analysis, we analyzed each animal that completed the study (excluding one statistical outlier), so the final animal numbers for these analyses were 9 (DIO) and 7 (DR).
Body composition
The rat carcasses (excluding the heads) were processed for body composition analysis, as described in Harris, 1991 [26], to determine percent body fat. First, gut contents were removed and the carcasses were weighed and autoclaved for 40 min at 122 °C. After water (equal in mass to the carcass) was added, the carcass was homogenized using a Polytron PT 3000 homogenizer. Homogenates were processed in triplicate. Chloroform (5 ml) and methanol (10 ml) were added to 8 ml of each homogenate sample, vortexed, and incubated on ice for 1 hr. Then, after adding 5 ml chloroform and 5 ml KCl, the samples were again incubated on ice for 30 min before centrifugation at 40,000 rpm for 20 min. The chloroform fraction was separated and dried overnight, leaving only the lipid, before being weighed. The percent body fat for each rat was determined by calculating the percent contribution of fat to the total weight of sample processed.
Radioimmunoassay for NMU
The DIO and DR rats were group housed within strain. Rats were randomly divided into groups at 9 weeks of age, with half of the rats of each strain given either high-fat chow (DIO, n=6; DR, n=7) or remaining on the standard chow (LabDiet #5001; DIO, n=7; DR, n=6). After 27–28 days on the high-fat (or continuation of standard) chow, we isolated the PVN using a brain micropunch. Animals were sacrificed between two and 6 hours after lights-on using rapid decapitation. The brains were removed and placed in ice-cold sterile saline for 20 min, then each brain was sliced using a tissue slicer (Stoelting, Wood Dale, IL). A 1-mm slice containing the PVN was taken using a rat brain atlas as a guide (Figs. 42–49 of reference [76]). The slice was placed on a slide (caudal-side up) and frozen using dry ice, after which a 2-mm tissue puncher (Fine Science Tools, Foster City, CA) was used to dissect the PVN bilaterally (1 micropunch/rat). The tissue punch was then frozen in liquid nitrogen and stored at −70°C for later homogenization and protein extraction using 700μl 0.1M acetic acid. The samples were then centrifuged at 14,000g for 15 min at 4°C and the supernatant was boiled for 10 min. A spectrophotometer (SpectraMax 340 at 595 nm absorbance) was used to determine protein concentration of each sample (35μl). A portion of the remaining sample (50μl) was dissolved in 950μl of distilled water for the determination of NMU concentration using RIA. A NMU RIA kit was used (Peninsula Laboratories, San Carlos, CA), which contained 125I-NMU, rabbit anti-NMU, and goat anti-rabbit secondary antibody. The NMU concentrations from the RIA were divided by the protein quantity, yielding pg NMU/μg total protein for each PVN sample.
Statistical analysis
(1) To compare the effects of NMU on physical activity and energy expenditure, the data were analyzed using mixed 2-way (2×4) repeated-measures ANOVAs, with the dose of NMU as the within-subjects independent variable, the rat strain (DIO or DR) as the between-subject independent variable, and the metabolic or physical activity count means as the dependent variables. (2) To determine which doses of NMU accounted for group- and diet-related differences in the effects of NMU, we used a 2×2 mixed repeated-measures ANOVAs to compare the effects of diet (within-subjects independent variable) on DIO and DR rats (between-subjects variable) at each dose of NMU. (3) Food intake data, percent change in body weight (normalized using an arcsin square root transformation) were analyzed using t-tests, and the body weight data were analyzed using a mixed 2×2 ANOVA, with group (DIO and DR) as the between-subjects independent variable and diet (pre- vs. post-high-fat diet) as the within-subjects independent variable. (4) For body composition analysis, we normalized the data on the percent body mass comprised of lipid using an arcsin-square root transformation; the data were then analyzed using an independent-samples t-test with group (DIO or DR) as the dependent variable. (5) For the analysis of REE, we used individual paired t-tests to compare the REE after each dose of NMU to vehicle within each group. (6) Lastly, the NMU RIA results were analyzed using a 2×2 ANOVA, with the rats strain (DIO or DR) and diet (high-fat or standard chow) as the independent variables, and the concentration of NMU as the dependent variable.
Acknowledgments
Funding for this publication was provided by the Minnesota Department of Employment and Economic Development from the State’s legislative appropriation for the Minnesota Partnership for Biotechnology and Medical Genomics, as well as DK56650-05, DK63226-03, DK66270-02, and R04-0771 to JAL. Funding was also provided by 0635113N from the American Heart Association and NINDS 055859 to C.M.N. We also wish to thank Randy Foster for advice on statistical calculations, Laurie Bale and Cheryl Conover for technical support with the radioimmunoassay, and Catherine Kotz for helpful communications regarding the manuscript.
Footnotes
Publisher's Disclaimer: This is a PDF file of an unedited manuscript that has been accepted for publication. As a service to our customers we are providing this early version of the manuscript. The manuscript will undergo copyediting, typesetting, and review of the resulting proof before it is published in its final citable form. Please note that during the production process errors may be discovered which could affect the content, and all legal disclaimers that apply to the journal pertain.
References
- 1.Arch JR, Hislop D, Wang SJ, Speakman JR. Some mathematical and technical issues in the measurement and interpretation of open-circuit indirect calorimetry in small animals. Int J Obes (Lond) 2006;30:1322–31. doi: 10.1038/sj.ijo.0803280. [DOI] [PubMed] [Google Scholar]
- 2.Ballesta J, Carlei F, Bishop AE, Steel JH, Gibson SJ, Fahey M, Hennessey R, Domin J, Bloom SR, Polak JM. Occurrence and developmental pattern of neuromedin U-immunoreactive nerves in the gastrointestinal tract and brain of the rat. Neuroscience. 1988;25:797–816. doi: 10.1016/0306-4522(88)90037-1. [DOI] [PubMed] [Google Scholar]
- 3.Bamshad M, Song CK, Bartness TJ. CNS origins of the sympathetic nervous system outflow to brown adipose tissue. Am J Physiol. 1999;276:R1569–78. doi: 10.1152/ajpregu.1999.276.6.R1569. [DOI] [PubMed] [Google Scholar]
- 4.Belke TW, Wagner JP. The reinforcing property and the rewarding aftereffect of wheel running in rats: a combination of two paradigms. Behav Processes. 2005;68:165–72. doi: 10.1016/j.beproc.2004.12.006. [DOI] [PubMed] [Google Scholar]
- 5.Blanchong JA, McElhinny TL, Mahoney MM, Smale L. Nocturnal and diurnal rhythms in the unstriped Nile rat, Arvicanthis niloticus. J Biol Rhythms. 1999;14:364–77. doi: 10.1177/074873099129000777. [DOI] [PubMed] [Google Scholar]
- 6.Brady LS, Smith MA, Gold PW, Herkenham M. Altered expression of hypothalamic neuropeptide mRNAs in food-restricted and food-deprived rats. Neuroendocrinology. 1990;52:441–7. doi: 10.1159/000125626. [DOI] [PubMed] [Google Scholar]
- 7.Brown DW, Brown DR, Heath GW, Balluz L, Giles WH, Ford ES, Mokdad AH. Associations between physical activity dose and health-related quality of life. Med Sci Sports Exerc. 2004;36:890–6. doi: 10.1249/01.mss.0000126778.77049.76. [DOI] [PubMed] [Google Scholar]
- 8.Castaneda TR, Jurgens H, Wiedmer P, Pfluger P, Diano S, Horvath TL, Tang-Christensen M, Tschop MH. Obesity and the neuroendocrine control of energy homeostasis: the role of spontaneous locomotor activity. J Nutr. 2005;135:1314–9. doi: 10.1093/jn/135.5.1314. [DOI] [PubMed] [Google Scholar]
- 9.Chang GQ, Karatayev O, Davydova Z, Leibowitz SF. Circulating triglycerides impact on orexigenic peptides and neuronal activity in hypothalamus. Endocrinology. 2004;145:3904–12. doi: 10.1210/en.2003-1582. [DOI] [PubMed] [Google Scholar]
- 10.Chappell PB, Smith MA, Kilts CD, Bissette G, Ritchie J, Anderson C, Nemeroff CB. Alterations in corticotropin-releasing factor-like immunoreactivity in discrete rat brain regions after acute and chronic stress. J Neurosci. 1986;6:2908–14. doi: 10.1523/JNEUROSCI.06-10-02908.1986. [DOI] [PMC free article] [PubMed] [Google Scholar]
- 11.Clegg DJ, Benoit SC, Reed JA, Woods SC, Dunn-Meynell A, Levin BE. Reduced anorexic effects of insulin in obesity-prone rats fed a moderate-fat diet. Am J Physiol Regul Integr Comp Physiol. 2005;288:R981–6. doi: 10.1152/ajpregu.00675.2004. [DOI] [PubMed] [Google Scholar]
- 12.Dauncey MJ. Activity and energy expenditure. Can J Physiol Pharmacol. 1990;68:17–27. doi: 10.1139/y90-002. [DOI] [PubMed] [Google Scholar]
- 13.Dixon DP, Ackert AM, Eckel LA. Development of, and recovery from, activity-based anorexia in female rats. Physiol Behav. 2003;80:273–9. doi: 10.1016/j.physbeh.2003.08.008. [DOI] [PubMed] [Google Scholar]
- 14.Donahoo WT, Levine JA, Melanson EL. Variability in energy expenditure and its components. Curr Opin Clin Nutr Metab Care. 2004;7:599–605. doi: 10.1097/00075197-200411000-00003. [DOI] [PubMed] [Google Scholar]
- 15.Flegal KM, Carroll MD, Ogden CL, Johnson CL. Prevalence and trends in obesity among US adults, 1999–2000. JAMA. 2002;288:1723–7. doi: 10.1001/jama.288.14.1723. [DOI] [PubMed] [Google Scholar]
- 16.Funahashi H, Hori T, Shimoda Y, Mizushima H, Ryushi T, Katoh S, Shioda S. Morphological evidence for neural interactions between leptin and orexin in the hypothalamus. Regul Pept. 2000;92:31–5. doi: 10.1016/s0167-0115(00)00146-4. [DOI] [PubMed] [Google Scholar]
- 17.Gartlon J, Szekeres P, Pullen M, Sarau HM, Aiyar N, Shabon U, Michalovich D, Steplewski K, Ellis C, Elshourbagy N, Duxon M, Ashmeade TE, Harrison DC, Murdock P, Wilson S, Ennaceur A, Atkins A, Heidbreder C, Hagan JJ, Hunter AJ, Jones DN. Localisation of NMU1R and NMU2R in human and rat central nervous system and effects of neuromedin-U following central administration in rats. Psychopharmacology (Berl) 2004;177:1–14. doi: 10.1007/s00213-004-1918-3. [DOI] [PubMed] [Google Scholar]
- 18.Giammattei J, Blix G, Marshak HH, Wollitzer AO, Pettitt DJ. Television watching and soft drink consumption: associations with obesity in 11- to 13-year-old schoolchildren. Arch Pediatr Adolesc Med. 2003;157:882–6. doi: 10.1001/archpedi.157.9.882. [DOI] [PubMed] [Google Scholar]
- 19.Graham ES, Turnbull Y, Fotheringham P, Nilaweera K, Mercer JG, Morgan PJ, Barrett P. Neuromedin U and Neuromedin U receptor-2 expression in the mouse and rat hypothalamus: effects of nutritional status. J Neurochem. 2003;87:1165–73. doi: 10.1046/j.1471-4159.2003.02079.x. [DOI] [PubMed] [Google Scholar]
- 20.Green CB, Douris N, Kojima S, Strayer CA, Fogerty J, Lourim D, Keller SR, Besharse JC. From the Cover: Loss of Nocturnin, a circadian deadenylase, confers resistance to hepatic steatosis and diet-induced obesity. Proc Natl Acad Sci U S A. 2007;104:9888–93. doi: 10.1073/pnas.0702448104. [DOI] [PMC free article] [PubMed] [Google Scholar]
- 21.Guan XM, Yu H, Jiang Q, Van Der Ploeg LH, Liu Q. Distribution of neuromedin U receptor subtype 2 mRNA in the rat brain. Brain Res Gene Expr Patterns. 2001;1:1–4. doi: 10.1016/s1567-133x(00)00002-8. [DOI] [PubMed] [Google Scholar]
- 22.Hainerova I, Torekov SS, Ek J, Finkova M, Borch-Johnsen K, Jorgensen T, Madsen OD, Lebl J, Hansen T, Pedersen O. Association between neuromedin U gene variants and overweight and obesity. J Clin Endocrinol Metab. 2006;91:5057–63. doi: 10.1210/jc.2006-1442. [DOI] [PubMed] [Google Scholar]
- 23.Hanada R, Nakazato M, Murakami N, Sakihara S, Yoshimatsu H, Toshinai K, Hanada T, Suda T, Kangawa K, Matsukura S, Sakata T. A role for neuromedin U in stress response. Biochem Biophys Res Commun. 2001;289:225–8. doi: 10.1006/bbrc.2001.5945. [DOI] [PubMed] [Google Scholar]
- 24.Hanada R, Teranishi H, Pearson JT, Kurokawa M, Hosoda H, Fukushima N, Fukue Y, Serino R, Fujihara H, Ueta Y, Ikawa M, Okabe M, Murakami N, Shirai M, Yoshimatsu H, Kangawa K, Kojima M. Neuromedin U has a novel anorexigenic effect independent of the leptin signaling pathway. Nat Med. 2004;10:1067–73. doi: 10.1038/nm1106. [DOI] [PubMed] [Google Scholar]
- 25.Hanada T, Date Y, Shimbara T, Sakihara S, Murakami N, Hayashi Y, Kanai Y, Suda T, Kangawa K, Nakazato M. Central actions of neuromedin U via corticotropin-releasing hormone. Biochem Biophys Res Commun. 2003;311:954–8. doi: 10.1016/j.bbrc.2003.10.098. [DOI] [PubMed] [Google Scholar]
- 26.Harris RB. Growth measurements in Sprague-Dawley rats fed diets of very low fat concentration. J Nutr. 1991;121:1075–80. doi: 10.1093/jn/121.7.1075. [DOI] [PubMed] [Google Scholar]
- 27.Heini AF, Weinsier RL. Divergent trends in obesity and fat intake patterns: the American paradox. Am J Med. 1997;102:259–64. doi: 10.1016/S0002-9343(96)00456-1. [DOI] [PubMed] [Google Scholar]
- 28.Hermes ML, Buijs RM, Renaud LP. Electrophysiology of suprachiasmatic nucleus projections to hypothalamic paraventricular nucleus neurons. Prog Brain Res. 1996;111:241–52. doi: 10.1016/s0079-6123(08)60412-4. [DOI] [PubMed] [Google Scholar]
- 29.Howard AD, Wang R, Pong SS, Mellin TN, Strack A, Guan XM, Zeng Z, Williams DL, Jr, Feighner SD, Nunes CN, Murphy B, Stair JN, Yu H, Jiang Q, Clements MK, Tan CP, McKee KK, Hreniuk DL, McDonald TP, Lynch KR, Evans JF, Austin CP, Caskey CT, Van der Ploeg LH, Liu Q. Identification of receptors for neuromedin U and its role in feeding. Nature. 2000;406:70–4. doi: 10.1038/35017610. [DOI] [PubMed] [Google Scholar]
- 30.Hu FB, Li TY, Colditz GA, Willett WC, Manson JE. Television watching and other sedentary behaviors in relation to risk of obesity and type 2 diabetes mellitus in women. Jama. 2003;289:1785–91. doi: 10.1001/jama.289.14.1785. [DOI] [PubMed] [Google Scholar]
- 31.Hu FB, Willett WC, Li T, Stampfer MJ, Colditz GA, Manson JE. Adiposity as Compared With Physical Activity in Predicting Mortality Among Women. Obstet Gynecol Surv. 2005;60:311–312. doi: 10.1056/NEJMoa042135. [DOI] [PubMed] [Google Scholar]
- 32.Ichikawa M, Miyasaka K, Fujita Y, Shimazoe T, Funakoshi A. Disappearance of diurnal rhythm of energy expenditure in genetically diabetic obese rats. Jpn J Physiol. 1998;48:211–4. doi: 10.2170/jjphysiol.48.211. [DOI] [PubMed] [Google Scholar]
- 33.Ida T, Mori K, Miyazato M, Egi Y, Abe S, Nakahara K, Nishihara M, Kangawa K, Murakami N. Neuromedin s is a novel anorexigenic hormone. Endocrinology. 2005;146:4217–23. doi: 10.1210/en.2005-0107. [DOI] [PubMed] [Google Scholar]
- 34.Ivanov TR, Lawrence CB, Stanley PJ, Luckman SM. Evaluation of neuromedin U actions in energy homeostasis and pituitary function. Endocrinology. 2002;143:3813–21. doi: 10.1210/en.2002-220121. [DOI] [PubMed] [Google Scholar]
- 35.Ivanov TR, Le Rouzic P, Stanley PJ, Ling WY, Parello R, Luckman SM. Neuromedin U neurones in the rat nucleus of the tractus solitarius are catecholaminergic and respond to peripheral cholecystokinin. J Neuroendocrinol. 2004;16:612–9. doi: 10.1111/j.1365-2826.2004.01210.x. [DOI] [PubMed] [Google Scholar]
- 36.James PT, Leach R, Kalamara E, Shayeghi M. The worldwide obesity epidemic. Obes Res, 9 Suppl. 2001;4:228S–233S. doi: 10.1038/oby.2001.123. [DOI] [PubMed] [Google Scholar]
- 37.Jethwa PH, Small CJ, Smith KL, Seth A, Darch SJ, Abbott CR, Murphy KG, Todd JF, Ghatei MA, Bloom SR. Neuromedin U has a physiological role in the regulation of food intake and partially mediates the effects of leptin. Am J Physiol Endocrinol Metab. 2005;289:E301–5. doi: 10.1152/ajpendo.00404.2004. [DOI] [PubMed] [Google Scholar]
- 38.Kas MJ, Edgar DM. A nonphotic stimulus inverts the diurnal-nocturnal phase preference in Octodon degus. J Neurosci. 1999;19:328–33. doi: 10.1523/JNEUROSCI.19-01-00328.1999. [DOI] [PMC free article] [PubMed] [Google Scholar]
- 39.Kiwaki K, Kotz CM, Wang C, Lanningham-Foster L, Levine JA. Orexin A (hypocretin 1) injected into hypothalamic paraventricular nucleus and spontaneous physical activity in rats. Am J Physiol Endocrinol Metab. 2004;286:E551–9. doi: 10.1152/ajpendo.00126.2003. [DOI] [PubMed] [Google Scholar]
- 40.Kotz CM. Integration of feeding and spontaneous physical activity: Role for orexin. Physiol Behav. 2006;88:294–301. doi: 10.1016/j.physbeh.2006.05.031. [DOI] [PubMed] [Google Scholar]
- 41.Kotz CM, Briggs JE, Grace MK, Levine AS, Billington CJ. Divergence of the feeding and thermogenic pathways influenced by NPY in the hypothalamic PVN of the rat. Am J Physiol. 1998;275:R471–7. doi: 10.1152/ajpregu.1998.275.2.R471. [DOI] [PubMed] [Google Scholar]
- 42.Kotz CM, Briggs JE, Pomonis JD, Grace MK, Levine AS, Billington CJ. Neural site of leptin influence on neuropeptide Y signaling pathways altering feeding and uncoupling protein. Am J Physiol. 1998;275:R478–84. doi: 10.1152/ajpregu.1998.275.2.R478. [DOI] [PubMed] [Google Scholar]
- 43.Kotz CM, Wang C, Levine AS, Billington CJ. Urocortin in the hypothalamic PVN increases leptin and affects uncoupling proteins-1 and -3 in rats. Am J Physiol Regul Integr Comp Physiol. 2002;282:R546–51. doi: 10.1152/ajpregu.00436.2001. [DOI] [PubMed] [Google Scholar]
- 44.Kowalski TJ, Spar BD, Markowitz L, Maguire M, Golovko A, Yang S, Farley C, Cook JA, Tetzloff G, Hoos L, Del Vecchio RA, Kazdoba TM, McCool MF, Hwa JJ, Hyde LA, Davis H, Vassileva G, Hedrick JA, Gustafson EL. Transgenic overexpression of neuromedin U promotes leanness and hypophagia in mice. J Endocrinol. 2005;185:151–64. doi: 10.1677/joe.1.05948. [DOI] [PubMed] [Google Scholar]
- 45.Kristensen P, Judge ME, Thim L, Ribel U, Christjansen KN, Wulff BS, Clausen JT, Jensen PB, Madsen OD, Vrang N, Larsen PJ, Hastrup S. Hypothalamic CART is a new anorectic peptide regulated by leptin. Nature. 1998;393:72–6. doi: 10.1038/29993. [DOI] [PubMed] [Google Scholar]
- 46.Lam TK, Schwartz GJ, Rossetti L. Hypothalamic sensing of fatty acids. Nat Neurosci. 2005;8:579–84. doi: 10.1038/nn1456. [DOI] [PubMed] [Google Scholar]
- 47.Leak RK, Moore RY. Topographic organization of suprachiasmatic nucleus projection neurons. J Comp Neurol. 2001;433:312–34. doi: 10.1002/cne.1142. [DOI] [PubMed] [Google Scholar]
- 48.Leibowitz SF, Wortley KE. Hypothalamic control of energy balance: different peptides, different functions. Peptides. 2004;25:473–504. doi: 10.1016/j.peptides.2004.02.006. [DOI] [PubMed] [Google Scholar]
- 49.Levin BE. Spontaneous motor activity during the development and maintenance of diet-induced obesity in the rat. Physiol Behav. 1991;50:573–81. doi: 10.1016/0031-9384(91)90548-3. [DOI] [PubMed] [Google Scholar]
- 50.Levin BE. Reduced paraventricular nucleus norepinephrine responsiveness in obesity-prone rats. Am J Physiol. 1996;270:R456–61. doi: 10.1152/ajpregu.1996.270.2.R456. [DOI] [PubMed] [Google Scholar]
- 51.Levin BE, Dunn-Meynell AA. Defense of body weight against chronic caloric restriction in obesity-prone and -resistant rats. Am J Physiol Regul Integr Comp Physiol. 2000;278:R231–7. doi: 10.1152/ajpregu.2000.278.1.R231. [DOI] [PubMed] [Google Scholar]
- 52.Levin BE, Dunn-Meynell AA. Reduced central leptin sensitivity in rats with diet-induced obesity. Am J Physiol Regul Integr Comp Physiol. 2002;283:R941–8. doi: 10.1152/ajpregu.00245.2002. [DOI] [PubMed] [Google Scholar]
- 53.Levin BE, Dunn-Meynell AA, Balkan B, Keesey RE. Selective breeding for diet-induced obesity and resistance in Sprague-Dawley rats. Am J Physiol. 1997;273:R725–30. doi: 10.1152/ajpregu.1997.273.2.R725. [DOI] [PubMed] [Google Scholar]
- 54.Levin BE, Dunn-Meynell AA, Banks WA. Obesity-prone rats have normal blood-brain barrier transport but defective central leptin signaling before obesity onset. Am J Physiol Regul Integr Comp Physiol. 2004;286:R143–50. doi: 10.1152/ajpregu.00393.2003. [DOI] [PubMed] [Google Scholar]
- 55.Levin BE, Dunn-Meynell AA, McMinn JE, Alperovich M, Cunningham-Bussel A, Chua SC., Jr A new obesity-prone, glucose-intolerant rat strain (F.DIO) Am J Physiol Regul Integr Comp Physiol. 2003;285:R1184–91. doi: 10.1152/ajpregu.00267.2003. [DOI] [PubMed] [Google Scholar]
- 56.Levin BE, Hogan S, Sullivan AC. Initiation and perpetuation of obesity and obesity resistance in rats. Am J Physiol. 1989;256:R766–71. doi: 10.1152/ajpregu.1989.256.3.R766. [DOI] [PubMed] [Google Scholar]
- 57.Levin BE, Magnan C, Migrenne S, Chua SC, Jr, Dunn-Meynell AA. F-DIO obesity-prone rat is insulin resistant before obesity onset. Am J Physiol Regul Integr Comp Physiol. 2005;289:R704–11. doi: 10.1152/ajpregu.00216.2005. [DOI] [PubMed] [Google Scholar]
- 58.Levin BE, Richard D, Michel C, Servatius R. Differential stress responsivity in diet-induced obese and resistant rats. Am J Physiol Regul Integr Comp Physiol. 2000;279:R1357–64. doi: 10.1152/ajpregu.2000.279.4.R1357. [DOI] [PubMed] [Google Scholar]
- 59.Levin BE, Triscari J, Sullivan AC. Metabolic features of diet-induced obesity without hyperphagia in young rats. Am J Physiol. 1986;251:R433–40. doi: 10.1152/ajpregu.1986.251.3.R433. [DOI] [PubMed] [Google Scholar]
- 60.Levine J, Melanson EL, Westerterp KR, Hill JO. Measurement of the components of nonexercise activity thermogenesis. Am J Physiol Endocrinol Metab. 2001;281:E670–5. doi: 10.1152/ajpendo.2001.281.4.E670. [DOI] [PubMed] [Google Scholar]
- 61.Levine JA, Eberhardt NL, Jensen MD. Role of nonexercise activity thermogenesis in resistance to fat gain in humans. Science. 1999;283:212–4. doi: 10.1126/science.283.5399.212. [DOI] [PubMed] [Google Scholar]
- 62.Levine JA, Lanningham-Foster LM, McCrady SK, Krizan AC, Olson LR, Kane PH, Jensen MD, Clark MM. Interindividual variation in posture allocation: possible role in human obesity. Science. 2005;307:584–6. doi: 10.1126/science.1106561. [DOI] [PubMed] [Google Scholar]
- 63.Lohman RJ, Liu L, Morris M, O’Brien TJ. Validation of a method for localised microinjection of drugs into thalamic subregions in rats for epilepsy pharmacological studies. J Neurosci Methods. 2005;146:191–7. doi: 10.1016/j.jneumeth.2005.02.008. [DOI] [PubMed] [Google Scholar]
- 64.Lopez M, Seoane L, Garcia MC, Lago F, Casanueva FF, Senaris R, Dieguez C. Leptin regulation of prepro-orexin and orexin receptor mRNA levels in the hypothalamus. Biochem Biophys Res Commun. 2000;269:41–5. doi: 10.1006/bbrc.2000.2245. [DOI] [PubMed] [Google Scholar]
- 65.Michel C, Dunn-Meynell A, Levin BE. Reduced brain CRH and GR mRNA expression precedes obesity in juvenile rats bred for diet-induced obesity. Behav Brain Res. 2004;154:511–7. doi: 10.1016/j.bbr.2004.03.019. [DOI] [PubMed] [Google Scholar]
- 66.Miyasaka K, Ichikawa M, Momose K, Araki A, Kobayashi M, Ichimaru Y, Funakoshi A. Physiological and pathological age-associated changes in diurnal rhythm of energy expenditure in rats. Arch Gerontol Geriatr. 2004;39:83–91. doi: 10.1016/j.archger.2004.01.002. [DOI] [PubMed] [Google Scholar]
- 67.Mori K, Miyazato M, Ida T, Murakami N, Serino R, Ueta Y, Kojima M, Kangawa K. Identification of neuromedin S and its possible role in the mammalian circadian oscillator system. Embo J. 2005;24:325–35. doi: 10.1038/sj.emboj.7600526. [DOI] [PMC free article] [PubMed] [Google Scholar]
- 68.Nakahara K, Hanada R, Murakami N, Teranishi H, Ohgusu H, Fukushima N, Moriyama M, Ida T, Kangawa K, Kojima M. The gut-brain peptide neuromedin U is involved in the mammalian circadian oscillator system. Biochem Biophys Res Commun. 2004;318:156–61. doi: 10.1016/j.bbrc.2004.04.014. [DOI] [PubMed] [Google Scholar]
- 69.Nakazato M, Hanada R, Murakami N, Date Y, Mondal MS, Kojima M, Yoshimatsu H, Kangawa K, Matsukura S. Central effects of neuromedin U in the regulation of energy homeostasis. Biochem Biophys Res Commun. 2000;277:191–4. doi: 10.1006/bbrc.2000.3669. [DOI] [PubMed] [Google Scholar]
- 70.Niimi M, Murao K, Taminato T. Central administration of neuromedin U activates neurons in ventrobasal hypothalamus and brainstem. Endocrine. 2001;16:201–6. doi: 10.1385/ENDO:16:3:201. [DOI] [PubMed] [Google Scholar]
- 71.Novak CM, Jiang X, Wang C, Teske JA, Kotz CM, Levine JA. Caloric restriction and physical activity in zebrafish (Danio rerio) Neurosci Lett. 2005;383:99–104. doi: 10.1016/j.neulet.2005.03.048. [DOI] [PubMed] [Google Scholar]
- 72.Novak CM, Kotz CM, Levine JA. Central orexin sensitivity, physical activity, and obesity in diet-induced obese and diet-resistant rats. Am J Physiol Endocrinol Metab. 2005 doi: 10.1152/ajpendo.00293.2005. [DOI] [PubMed] [Google Scholar]
- 73.Novak CM, Zhang M, Levine JA. Neuromedin U in the paraventricular and arcuate hypothalamic nuclei increases non-exercise activity thermogenesis. Journal of Neuroendocrinology. 2006;18:594–601. doi: 10.1111/j.1365-2826.2006.01454.x. [DOI] [PubMed] [Google Scholar]
- 74.Ogden CL, Fryar CD, Carroll MD, Flegal KM. Mean body weight, height, and body mass index, United States 1960–2002. Adv Data. 2004:1–17. [PubMed] [Google Scholar]
- 75.Ozaki Y, Onaka T, Nakazato M, Saito J, Kanemoto K, Matsumoto T, Ueta Y. Centrally administered neuromedin U activates neurosecretion and induction of c-fos messenger ribonucleic acid in the paraventricular and supraoptic nuclei of rat. Endocrinology. 2002;143:4320–9. doi: 10.1210/en.2002-220201. [DOI] [PubMed] [Google Scholar]
- 76.Paxinos G, Watson C. The Rat Brain in Stereotaxic Coordinates. 5. Elsevier Academic Press; 2005. [Google Scholar]
- 77.Qiu DL, Chu CP, Shirasaka T, Nabekura T, Kunitake T, Kato K, Nakazato M, Katoh T, Kannan H. Neuromedin U depolarizes rat hypothalamic paraventricular nucleus neurons in vitro by enhancing IH channel activity. J Neurophysiol. 2003;90:843–50. doi: 10.1152/jn.00225.2003. [DOI] [PubMed] [Google Scholar]
- 78.Qiu DL, Chu CP, Tsukino H, Shirasaka T, Nakao H, Kato K, Kunitake T, Katoh T, Kannan H. Neuromedin U receptor-2 mRNA and HCN channels mRNA expression in NMU-sensitive neurons in rat hypothalamic paraventricular nucleus. Neurosci Lett. 2005;374:69–72. doi: 10.1016/j.neulet.2004.10.033. [DOI] [PubMed] [Google Scholar]
- 79.Raddatz R, Wilson AE, Artymyshyn R, Bonini JA, Borowsky B, Boteju LW, Zhou S, Kouranova EV, Nagorny R, Guevarra MS, Dai M, Lerman GS, Vaysse PJ, Branchek TA, Gerald C, Forray C, Adham N. Identification and characterization of two neuromedin U receptors differentially expressed in peripheral tissues and the central nervous system. J Biol Chem. 2000;275:32452–9. doi: 10.1074/jbc.M004613200. [DOI] [PubMed] [Google Scholar]
- 80.Redlin U, Mrosovsky N. Nocturnal activity in a diurnal rodent (Arvicanthis niloticus): the importance of masking. J Biol Rhythms. 2004;19:58–67. doi: 10.1177/0748730403260371. [DOI] [PubMed] [Google Scholar]
- 81.Rissanen AM, Heliovaara M, Knekt P, Reunanen A, Aromaa A. Determinants of weight gain and overweight in adult Finns. Eur J Clin Nutr. 1991;45:419–30. [PubMed] [Google Scholar]
- 82.Shan L, Qiao X, Crona JH, Behan J, Wang S, Laz T, Bayne M, Gustafson EL, Monsma FJ, Jr, Hedrick JA. Identification of a novel neuromedin U receptor subtype expressed in the central nervous system. J Biol Chem. 2000;275:39482–6. doi: 10.1074/jbc.C000522200. [DOI] [PubMed] [Google Scholar]
- 83.Sherwin CM. Voluntary wheel running: a review and novel interpretation. Anim Behav. 1998;56:11–27. doi: 10.1006/anbe.1998.0836. [DOI] [PubMed] [Google Scholar]
- 84.Steel JH, Van Noorden S, Ballesta J, Gibson SJ, Ghatei MA, Burrin J, Leonhardt U, Domin J, Bloom SR, Polak JM. Localization of 7B2, neuromedin B, and neuromedin U in specific cell types of rat, mouse, and human pituitary, in rat hypothalamus, and in 30 human pituitary and extrapituitary tumors. Endocrinology. 1988;122:270–82. doi: 10.1210/endo-122-1-270. [DOI] [PubMed] [Google Scholar]
- 85.Sutton RE, Koob GF, Le Moal M, Rivier J, Vale W. Corticotropin releasing factor produces behavioural activation in rats. Nature. 1982;297:331–3. doi: 10.1038/297331a0. [DOI] [PubMed] [Google Scholar]
- 86.Tang-Christensen M, Vrang N, Ortmann S, Bidlingmaier M, Horvath TL, Tschop M. Central administration of ghrelin and agouti-related protein (83–132) increases food intake and decreases spontaneous locomotor activity in rats. Endocrinology. 2004;145:4645–52. doi: 10.1210/en.2004-0529. [DOI] [PubMed] [Google Scholar]
- 87.Teske JA, Levine AS, Kuskowski M, Levine JA, Kotz CM. Elevated hypothalamic orexin signaling, sensitivity to orexin A and spontaneous physical activity in obesity resistant rats. Am J Physiol Regul Integr Comp Physiol. 2006 doi: 10.1152/ajpregu.00536.2005. [DOI] [PubMed] [Google Scholar]
- 88.Thompson EL, Murphy KG, Todd JF, Martin NM, Small CJ, Ghatei MA, Bloom SR. Chronic administration of NMU into the paraventricular nucleus stimulates the HPA axis but does not influence food intake or body weight. Biochem Biophys Res Commun. 2004;323:65–71. doi: 10.1016/j.bbrc.2004.08.058. [DOI] [PubMed] [Google Scholar]
- 89.Tkacs NC, Levin BE. Obesity-prone rats have preexisting defects in their counterregulatory response to insulin-induced hypoglycemia. Am J Physiol Regul Integr Comp Physiol. 2004;287:R1110–5. doi: 10.1152/ajpregu.00312.2004. [DOI] [PubMed] [Google Scholar]
- 90.Turek FW, Joshu C, Kohsaka A, Lin E, Ivanova G, McDearmon E, Laposky A, Losee-Olson S, Easton A, Jensen DR, Eckel RH, Takahashi JS, Bass J. Obesity and metabolic syndrome in circadian Clock mutant mice. Science. 2005;308:1043–5. doi: 10.1126/science.1108750. [DOI] [PMC free article] [PubMed] [Google Scholar]
- 91.van Baak MA, van Mil E, Astrup AV, Finer N, Van Gaal LF, Hilsted J, Kopelman PG, Rossner S, James WP, Saris WH. Leisure-time activity is an important determinant of long-term weight maintenance after weight loss in the Sibutramine Trial on Obesity Reduction and Maintenance (STORM trial) Am J Clin Nutr. 2003;78:209–14. doi: 10.1093/ajcn/78.2.209. [DOI] [PubMed] [Google Scholar]
- 92.Weinsier RL, Hunter GR, Heini AF, Goran MI, Sell SM. The etiology of obesity: relative contribution of metabolic factors, diet, and physical activity. Am J Med. 1998;105:145–50. doi: 10.1016/s0002-9343(98)00190-9. [DOI] [PubMed] [Google Scholar]
- 93.Weinsier RL, Nelson KM, Hensrud DD, Darnell BE, Hunter GR, Schutz Y. Metabolic predictors of obesity. Contribution of resting energy expenditure, thermic effect of food, and fuel utilization to four-year weight gain of post-obese and never-obese women. J Clin Invest. 1995;95:980–5. doi: 10.1172/JCI117807. [DOI] [PMC free article] [PubMed] [Google Scholar]
- 94.Wen LM, Orr N, Millett C, Rissel C. Driving to work and overweight and obesity: findings from the 2003 New South Wales Health Survey, Australia. Int J Obes (Lond) 2006;30:782–6. doi: 10.1038/sj.ijo.0803199. [DOI] [PubMed] [Google Scholar]
- 95.Wortley KE, Chang GQ, Davydova Z, Leibowitz SF. Peptides that regulate food intake: orexin gene expression is increased during states of hypertriglyceridemia. Am J Physiol Regul Integr Comp Physiol. 2003;284:R1454–65. doi: 10.1152/ajpregu.00286.2002. [DOI] [PubMed] [Google Scholar]
- 96.Wren AM, Small CJ, Abbott CR, Jethwa PH, Kennedy AR, Murphy KG, Stanley SA, Zollner AN, Ghatei MA, Bloom SR. Hypothalamic actions of neuromedin U. Endocrinology. 2002;143:4227–34. doi: 10.1210/en.2002-220308. [DOI] [PubMed] [Google Scholar]
- 97.Wyatt HR, Peters JC, Reed GW, Barry M, Hill JO. A Colorado statewide survey of walking and its relation to excessive weight. Med Sci Sports Exerc. 2005;37:724–30. doi: 10.1249/01.mss.0000161750.84096.d4. [DOI] [PubMed] [Google Scholar]
- 98.Yokota M, Ozaki Y, Sakamoto F, Yamada S, Saito J, Fujihara H, Ueta Y. Fos expression in CRF-containing neurons in the rat paraventricular nucleus after central administration of neuromedin U. Stress. 2004;7:109–12. doi: 10.1080/10253890410001727370. [DOI] [PubMed] [Google Scholar]
- 99.Zhu Y, Yamanaka A, Kunii K, Tsujino N, Goto K, Sakurai T. Orexin-mediated feeding behavior involves both leptin-sensitive and -insensitive pathways. Physiol Behav. 2002;77:251–7. doi: 10.1016/s0031-9384(02)00843-0. [DOI] [PubMed] [Google Scholar]