

Abstract
Background and Aims
Forisomes are Ca2+-dependent contractile protein bodies that form reversible plugs in sieve tubes of faboid legumes. Previous work employed Vicia faba forisomes, a not entirely unproblematic experimental system. The aim of this study was to seek to establish a superior model to study these intriguing actuators.
Methods
Existing isolation procedures were modified to study the exceptionally large, tailed forisomes of Canavalia gladiata by differential interference contrast microscopy in vitro. To analyse contraction/expansion kinetics quantitatively, a geometric model was devised which enabled the computation of time-courses of derived parameters such as forisome volume from simple parameters readily determined on micrographs.
Key Results
Advantages of C. gladiata over previously utilized species include the enormous size of its forisomes (up to 55 µm long), the presence of tails which facilitate micromanipulation of individual forisomes, and the possibility of collecting material repeatedly from these fast-growing vines without sacrificing the plants. The main bodies of isolated Canavalia forisomes were box-shaped with square cross-sections and basically retained this shape in all stages of contraction. Ca2+-induced a 6-fold volume increase within about 10–15 s; the reverse reaction following Ca2+-depletion proceeded in a fraction of that time.
Conclusions
The sword bean C. gladiata provides a superior experimental system which will prove indispensable in physiological, biophysical, ultrastructural and molecular studies on the unique ATP-independent contractility of forisomes.
Key words: Ca2+-dependent contractility, contractile protein, fabaceae, forisome geometry, contraction kinetics, Canavalia gladiata, phloem transport, sieve element, tailed forisome
INTRODUCTION
In the higher plants, the products of photosynthesis are distributed through the syncytial sieve tube network of the phloem, a natural microfluidics system that enables mass flow driven by gradients in hydrostatic pressure (Evert, 1982; Gould et al., 2005). The sieve tubes consist of enucleate sieve elements (SEs), highly differentiated tubular cells that are cytoplasmically connected by widened plasmodesmata, so-called sieve pores (Behnke and Sjolund, 1990; Sjolund, 1997; van Bel et al., 2002). Mature SEs lack an operational cytoskeleton, but contain a multitude of phloem-specific proteins (P-proteins) of obscure function (Cronshaw and Sabnis, 1990; Sabnis and Sabnis, 1995). Members of the subfamily Faboideae (= Papilionoideae) within the Fabaceae (= Leguminosae; legume family) carry forisomes, unique P-protein bodies capable of Ca2+-driven volume changes that let them control the flux through the sieve tube by reversible plug formation (Knoblauch and Peters, 2004a). While forisomes may not always seal sieve tubes completely (Peters et al., 2006), they certainly control the efficient sieve tube diameter and probably are involved in the transient reductions in phloem flow rates that occur in faboid legumes in response to environmental stressors (Lang and Minchin, 1986; Pickard and Minchin, 1990, 1992).
Forisome dynamics were first observed accidentally in Vicia faba (Knoblauch et al., 2001). Consequently, methods of forisome isolation were developed and optimized for this species (Knoblauch et al., 2003). In vitro, the Ca2+-response of the spindle-shaped Vicia forisomes consists of a longitudinal shortening by some 30% and a > 2-fold increase of radial diameter. It can be completed in < 1s, but no detailed kinetic studies are available (Knoblauch et al., 2003). While the reversible assembly of highly ordered macromolecular arrays has been implied to play a role (Peters et al., 2007), the mechanism of forisome contractility is not fully understood to date (Pickard et al., 2006). However, due to their unusual properties, forisomes are receiving interest as a natural prototype for protein-based smart materials with applications in micro- and nanotechnology (Mavroidis and Dubey, 2003; Knoblauch and Peters, 2004b; Shen et al., 2006). It should be noted, though, that the sheer number of faboid species alone (certainly > 12 000; Doyle and Luckow, 2003; Lewis et al., 2005) alone makes it appear unlikely that Vicia faba provides the best possible system to study forisome action. For example, in several genera – but not Vicia – forisomes carry two tail-like protrusions (Straßburger, 1892; Lawton, 1978a) which do not appear to take part in the plugging reaction in vivo (Knoblauch et al., 2001). The presence of such non-responsive tails would probably facilitate the handling and micromanipulation of individual forisomes in vitro.
Here the sword bean Canavalia gladiata, a legume with particularly big, tailed forisomes, is introduced as a new experimental system, and the dynamic geometry of its forisomes evaluated during contraction and expansion induced by Ca2+. To do so, a quantitative geometric model was developed which allows the calculation of derived parameters such as volume and surface area from forisome length and diameter which can be easily measured on micrographs.
MATERIALS AND METHODS
Plant material
Three sword bean species were chosen: Canavalia gladiata [Jacq.] DC ‘Akanata Mame’ (Kitazawa Seed Co., Oakland CA, USA), C. ensiformis (L.) Benth. (Sunshine Seeds, Ahlen, Germany) and C. maritima (Aubl.) Thou. (seeds collected in the wild). The plants were grown in a greenhouse in 35-cm pots in potting mix supplemented with bark bits. They were maintained on a 14-h day under sunlight supplemented as needed by metal halide illumination, watered twice daily and fertilized once a week. Temperature was kept between 25 °C and 30 °C (day) or between 23 °C and 30 °C (night).
Forisome preparation
Segments of maturing runners (3–4 mm in diameter) were collected from Canavalia plants several months old. The peripheral stem tissues were peeled off in two strips and were bathed in Ca2+-free medium (10 mm Na2EDTA, 100 mm KCl, 10 mm HEPES, pH 7·3) for 15 min. Then the phloem tissue was scratched off of the inner face of the peels, incubated in Ca2+-free medium for 10 min, and ground in liquid nitrogen manually with a pestle and mortar. The resulting frozen tissue powder was thawed in Ca2+-free medium and passed through a 60-μm mesh filter, to yield a crude forisome preparation.
Microscopy
Initial studies of forisome morphology by differential interference contrast microscopy (DIC) were performed with a Leitz Dialux 20 microscope equipped with Smith DIC optics, an NPL Fluotar 100/1·32 ICT oil immersion objective, and a Wild Leitz Photoautomat MPS 46/52 camera (Leica, Wetzlar, Germany).
After identification of C. gladiata as the most promising experimental system, responses to Ca2+ (replacement of the EDTA in the Ca2+-free medium by 10 mm CaCl2) were examined in droplets of crude forisome preparations positioned on a microscope slide. The light microscope used in these experiments (Leica DM LFSA) was equipped with Leica HCX APO water immersion objectives and DIC optics. In some cases, forisomes spontaneously stuck to the slide surface with one of their tails. More frequently, the tip of a glass micropipette (pulled from borosilicate capillaries, 1 mm o.d.) mounted on a micromanipulator (MX-1; Narashige, Tokyo, Japan) had to be gently pressed onto one of the tails of a forisome selected for experimentation, so that it attached to the glass surface holding the forisome in place during the exchange of media. Generally, the presence of tails on the forisomes proved advantageous as it greatly facilitated the handling of individual forisomes. To study changes of forisome geometry over several minutes after media exchange, micrographs were taken at 1-s intervals using a DC200 digital camera (Leica) controlled with Leica's IM50 software. Incubation media were exchanged by shooting the new medium forcefully onto the microscope slide using a micropipette, while removing medium continuously at the opposite side of the slide with a Pasteur pipette connected to a vacuum pump.
Data analysis
Using the freeware image analysis package ImageJ (v 1·33u; http://rsb.info.nih.gov/ij/), the length of the forisome main body (L), and the diameters of the main body both at its centre (central diameter, D) and at the insertion of one of the tails (tip diameter, d) were determined. No image processing such as contrast enhancement was applied. It was found impracticable to measure d at both ends of the forisomes, as the forisomes' longitudinal axis was usually not adequately parallel with the focal plane of the microscope. SigmaPlot (version 7·101; SPSS Inc., Chicago, IL, USA) was used to fit the function
 |
to exponential domains of the time courses, which provided excellent results. Forisome volume and other parameters were determined using the geometric model introduced in the Appendix; time-courses of the derived parameters were computed by replacing forisome length (L), central diameter (D) and tip diameter (d) in the equations of the geometric model (Appendix) by the functions fitted to the original data of these measured parameters. As a measure of the swiftness of the response, the 10–90 % response time (length of period between the times at which 10 % and 90 % of the full response were reached) was determined from the computed time-courses.
RESULTS
Morphology of tailed forisomes
Searching for particularly big forisomes with tails, > 140 legume species were screened and Canavalia was found particularly promising. Species of the genus produce sturdy, rapidly growing runners and/or twining stems, which can be harvested for forisome isolation without sacrificing the mother plant. In our hands, C. gladiata performed more reliably under greenhouse conditions than C. maritima and C. ensiformis and readily produced seeds. The species lent itself to forisome observation in vivo by methods described elsewhere for Vicia faba (Knoblauch et al., 2001; Peters et al., 2006), and to the isolation of individual forisomes as well as to the production of forisome preparations using slightly modified methods developed for that species (Knoblauch et al., 2003).
Canavalia gladiata forisomes were chosen as a new model and their reactivity tested in vitro. Isolated forisomes were between 20 µm and 55 µm long and reacted to calcium ions by the typical anisotropic deformation, consisting of a longitudinal contraction and a radial expansion. They appeared box-like and almost rectangular in both side- and head-view (Fig. 1A, C), and substantially retained this shape after the response to Ca2+ (Fig. 1B, D) and to alkaline pH (not shown). The tails did not participate in the reaction, but characteristic root-like structures became visible at the tail bases in longitudinally contracted forisomes (Fig. 1B). In about two-thirds of the numerous specimens examined, these tail roots appeared to be connected by fibrillar structures (Fig. 1E). As described previously for Vicia faba (Knoblauch et al., 2003), the calcium response was fully reversible by application of chelators and could be repeated numerous times.
Fig. 1.
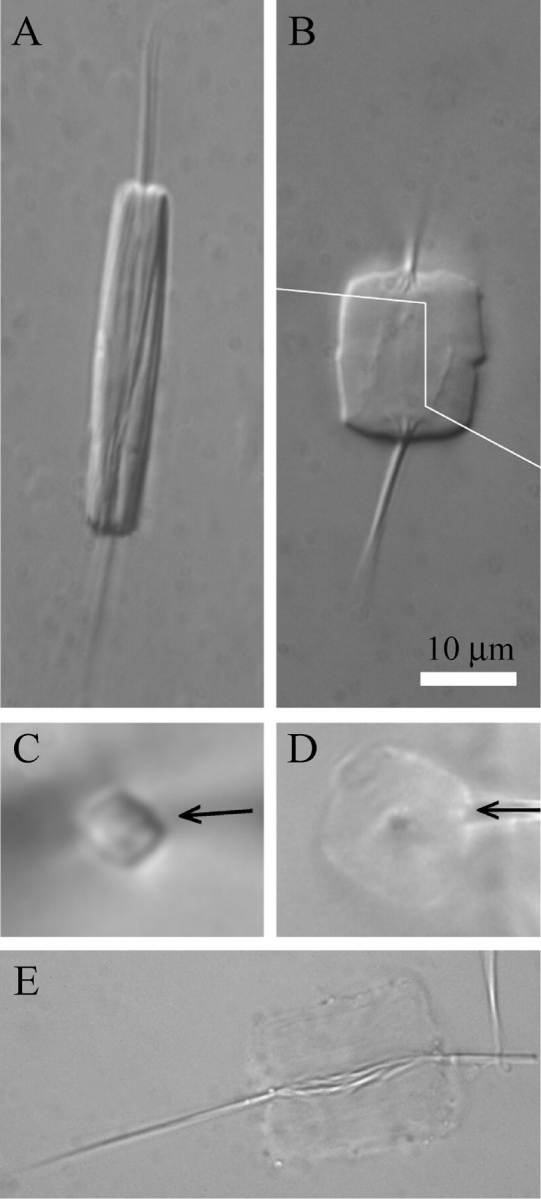
Morphology of forisomes isolated from sword bean (Canavalia gladiata) in the resting state (A, C) and after Ca2+-induced longitudinal contraction (B, D), as seen by DIC microscopy. (A) Side-view in Ca2+-free medium. (B) Same forisomes as in (A) after addition of 2 mm Ca2+. The figure is a composite of two images (dividing line shown in white) taken at slightly different focal planes to show the root structures at the bases of both tails. This forisome showed a particularly strong longitudinal contraction of > 50 %. (C) Head-view of a forisome mounted on a micropipette tip (visible as shadow entering the image from the right; arrow), focused on the centre of the forisome body. The cross-section is rectangular with slightly convex sides. (D) Same forisome as in (C) after the Ca2+-response. (E) Forisome in the presence of Ca2+, showing fibrils that connect the roots of the tails. Such connections were found in about two-thirds of the > 100 forisomes examined. The scale bar shown in (B) applies to all micrographs.
A rectangular cross-sectional shape with convex sides and its maintenance during Ca2+-induced contraction is demonstrated here for the first time in functional forisomes (Fig. 1C, D). More or less square cross-sections of forisomes had been documented by transmission electron microscopy for several legume species (Palevitz and Newcomb, 1971) before forisome contractility became known. The verification of this geometry in the functional state was important since the shape of forisomes in the fully dehydrated state does not necessarily resemble that in the hydrated functional one. For soybean (Glycine max), ultrastuctural results had led to a model in which the forisome consisted of a main body bounded by four smooth but slightly curved sides and one tapering tail at each end (see fig. 11 in Wergin and Newcomb, 1970). Based on this qualitative model, a quantitative one was devised from which forisome main body volume, surface area, circumferences, cross-sectional areas, etc. could be estimated from measurements of central diameter (D), tip diameter (d) and length (L), for all stages of contraction and expansion (see Appendix).
Kinetics of the Ca2+-response
Average-sized forisomes between 36 µm and 41 µm long were selected as a geometrically homogenous sample for kinetic studies; geometric parameters of this subset are presented in Table 1. At first sight, time-courses of forisome length (L), central diameter (D) and tip diameter (d) reconstructed from micrographs taken at 1-s intervals during the Ca2+-response appeared correlated (Fig. 2A–C). However, there was significant variation in the velocity of the responses and, in this respect, the three geometric parameters were independent of each other. To demonstrate this, the slowest and the fastest overall responses are shown in Fig. 2A and B, respectively, out of six time-courses analysed in depth. In Fig. 2A, L, D and d reach what seem to be final values not before at least 10 s after the start of the response. On the other hand, in Fig. 2B, the response appears essentially complete with the first measured post-stimulus data-point in D and d, but not in L. This independence of the variation in the time-courses of the three parameters argues against the idea that the variability of the velocity of the overall response was mainly due to differences in the delivery of sufficient amounts of Ca2+ to the forisomes. The time at which the Ca2+-level in the vicinity of the forisome reached the threshold for the response could not be determined exactly in the present experiments, making it difficult to establish response phase lags. To keep unavoidable non-inherent lags short, 10 mm Ca2+, an unphysiologically high concentration, was applied, but still the possibility exists that slow overall responses such as those shown in Fig. 2A might be caused by slowly rising Ca2+ concentrations. However, if this were so, it would remain unclear how extremely fast and slow responses in different geometric parameters could occur simultaneously (Fig. 2B). Thus the present results, while not supporting statements regarding inherent phase lags and the possible effects of gradually rising Ca2+ levels, suggest that Ca2+-induced changes in forisome length and diameter are not necessarily strictly linked.
Table 1.
Geometry of isolated Canavalia gladiata forisomes (n = 6) used for analysis of contraction/expansion kinetics
| Measured parameters |
Calculated parameters |
|||||||
|---|---|---|---|---|---|---|---|---|
| Length L (μm) | Central diameter D (μm) | Tip diameter d (μm) | Volume (μm3) | Surface area (μm2) | Greatest cross-sectional area (μm2) | Polar circumference (μm) | Equatorial circumference (μm) | |
| Resting state (excess of chelator) | 38·6 ± 2·8 | 4·8 ± 0·6 | 3·3 ± 0·3 | 657 ± 129 | 610 ± 58 | 21·3 ± 5·7 | 83·7 ± 5·5 | 17·2 ± 2·3 |
| Plugging state (excess of free Ca2+) | 27·4 ± 4·0 | 17·8 ± 1·8 | 10·4 ± 1·2 | 6170 ± 970 | 1730 ± 216 | 295 ± 26 | 78·2 ± 7·1 | 64·6 ± 3·8 |
| Factor of Ca2+-induced change* | 0·71 | 3·7 | 3·2 | 9·4 | 2·8 | 13·9 | – | 3·7 |
Geometry in the plugging state was evaluated after 150 s of exposure to 10 mm Ca2+.
The values are mean ± s.d.
* Factors of change shown only if the difference between resting and plugging state was statistically significant (P < 0·01, Student's t-test).
Fig. 2.

Kinetics of Ca2+-responses in forisomes isolated from Canavalia gladiata. (A) and (B) show the fastest and slowest, respectively, overall responses to the addition of 10 mm Ca2+ from a total of six experiments; the curves are the time-courses of forisome main body length (L; open squares), central diameter (D; closed circles), and tip diameter (d; open circles). Ca2+ was applied at time = 20 s. (C) Gives a representative complete expansion/reaction sequence, with Ca2+ applied at time = 20 s and EDTA added at time = 206 s. From the curves fitted to the L, D and d measurements, time-courses of forisome volume and surface area (D) and of polar as well as equatorial circumference (CF) and cross-sectional (CS) area at the centre of the forisome main body were computed (E).
Intriguingly, the velocity of the response to the removal of calcium ions by adding chelators was always more rapid than the reverse reaction. Figure 2C shows a typical contraction–expansion cycle. Here, D and L responded slowly but d rapidly to Ca2+-addition (at time = 20 s). In contrast, all parameters jumped back rapidly to resting state values following the application of EDTA (at time = 206 s). As this was consistently observed, and since there was no difference in the ways in which calcium- and chelator-media were applied, it was concluded that the response to Ca2+-addition was inherently slower than that to Ca2+ removal. The difference in the kinetics became more obvious in the computed time-courses of the surface area and volume of the forisome main body (Fig. 2D). While care must be taken to not over-interpret such curves as their shapes depend in part on the choice of the function fitted to the data, it is unquestionable that forisome swelling continued at a rapidly decreasing rate for at least 20 s after its onset while deswelling occurred almost instantaneously; e.g. the 10–90 % response times for the volume increase and decrease shown (Fig. 2D) were 12·7 and 1·6 s, respectively.
Over a period of 2·5 min after application of Ca2+, the volume of Canavalia forisome main bodies increased 9-fold in average (Table 1). A biologically more important geometric parameter is the forisome's greatest cross-sectional area which determines the fraction of the sieve tube diameter the forisome occludes, and thus its efficacy as a sieve tube plug. It increased dramatically during Ca2+-induced swelling (Fig. 2E), on average by a factor of almost 14 (Table 1).
Obviously, the computed time-course of equatorial circumference paralleled that of cross-sectional area (Fig. 2E). On the other hand, polar circumference did not change significantly during the expansion–contraction cycle, indicating that most of the variation in length of the longitudinal sides of the forisome main body was balanced by reverse changes in tip diameter.
DISCUSSION
Tailed as well as tail-less protein bodies specific to the legume phloem were well-known around 1900 (Bacarini, 1892; Straßburger, 1892; Mrazek, 1910), and numerous studies into the ultrastructure of these intriguing cell constituents became available during the 20th century (e.g. Palevitz and Newcomb, 1971; Lawton, 1978a). However, it was not before 2001 when the inappropriateness of their then accepted name, ‘spindle-shaped nondispersive P-protein bodies’ (Behnke, 1991), became evident after the disclosure of their function as regulated sieve-tube plugs that is based on their ability to disperse reversibly (Knoblauch et al., 2001), eventually leading to them being renamed ‘forisomes’ (gate-bodies; Knoblauch et al., 2003). Functional studies available concern the tailless forisomes of Vicia faba which have been demonstrated to reversibly form plug-like structures in vivo (Knoblauch et al., 2001) and to anisotropically contract in vitro (Knoblauch et al., 2003). An analogous reactivity of tailed forisomes could only be inferred from the occurrence of tailed sieve-tube plugs in Phaseolus vulgaris and from the reinterpretation of older electron micrographs in the light of current knowledge (Knoblauch et al., 2001). The present study provides the first direct demonstration of anisotropic contractility in tailed forisomes, and shows that tailed and tailless ones can be isolated and studied by similar methods.
However, Canavalia offers obvious advantages over Vicia as an experimental model system. Canavalia grows as a vine, and ample material can be obtained from the fast-growing winding stems without having to sacrifice the plant; a few individuals kept in a greenhouse over prolonged periods have proven fully sufficient to support our ongoing research. Forisome size is a decisive factor that determines a forisome's suitability for tests that require manipulation of the protein body. Canavalia gladiata produces the largest forisomes seen so far; in terms of resting state volume, they are about four times larger than those of V. faba. As anticipated, the presence of tails proved to be a distinctive asset since they could be used as handles that greatly facilitated the handling of individual forisomes without need to touch the contractile main body. Ironically, nothing is known about the function in vivo of these structures that come so handy to the experimenter in vitro. In agreement with previous findings in Phaseolus (Knoblauch et al., 2001), no Ca2+-dependent deformation of the tails of Canavalia forisomes was detected. This adds to the convenience offered by the tails as handles for forisome manipulation in experimental situations. In terms of ultrastructure, the main bodies of tailed as well as tailless forisomes are characterized by a regular cross-striation of 10–12 nm periodicity that runs perpendicular across the longitudinally oriented fibrils which form the elongate protein body (Laflèche, 1966). In the tails which appear to consist of the same fibrillar material as the main bodies, the fine cross-striation is overlain or even replaced by an identically oriented 45-nm striation (Wergin and Newcomb, 1970; Palevitz and Newcomb, 1971; Lawton, 1978a, b). This ultrastructural differentiation may, in future studies, help to elucidate the molecular mechanisms of forisome contractility by correlating structure and function, another good reason to establish a species possessing tailed forisomes as a model.
Forisomes had appeared to be square in cross-section in the transmission electron-microscope (Palevitz and Newcomb, 1971). The present finding that they retain this shape when radially expanded (Fig. 1C, D) supports the notion that forisomes remain structurally coherent in all phases of the Ca2+-induced contraction/expansion cycle (Knoblauch and Peters, 2004a). The Ca2+-driven radial expansion therefore has the character of a conversion rather than that of a dispersion. However, the structural coherence that is maintained at all stages of the contractile response does not imply that changes in length and diameter are always strictly correlated, as indicated by the variable kinetics of the different geometric parameters (Fig. 2A, B). In this context it is worth noting that while Vicia forisomes change their shape in side view from elongate spindle-shaped to spherical, the forisomes of Canavalia always retain a rectangular outline (Fig. 2A, B). Thus it appears that the geometric architecture of the contractile macromolecules differs between forisomes from different legume species.
DIC microscopy indicated that fibrillar structures which differ from the bulk material of the forisome main body in their optical properties connect the bases of the tails in some Canavalia forisomes, but not in others. At this stage, it remains unclear whether these structures represent the usual main body fibrils in a modified state of organization, or a biochemically distinct material. The role of these structures, if any, in Canavalia forisome contraction is also obscure, not only because they are not always present; similar structures are not known from contractile but tailless forisomes of Vicia. It should be noted as well that, thus far, no physiological function has been established for forisome tails. Detailed structural investigations based on a combination of DIC light and electron microscopy appear a promising approach to solve these problems. In contrast to older ultrastructural investigations which relied entirely on the examination of forisomes within sieve elements (Laflèche, 1966; Wergin and Newcomb, 1970; Palevitz and Newcomb, 1971; Lawton, 1978a, b), such studies will now benefit from our ability to isolate forisomes in a fully functional state (Knoblauch et al., 2003; this study).
The recent analysis showing that available results from Vicia are not readily reconciled with the idea that forisomes are capable of blocking sieve tubes completely (Peters et al., 2006) demonstrates that truly quantitative data are required for a realistic evaluation of forisome function. Therefore, a quantitative model was devised based on geometric characteristics of Canavalia forisomes (Appendix). However, the model may be adapted to forisomes of different shape by minor mathematical modifications. It provides the means to establish continuous time-courses of geometric parameters which cannot be directly measured on simple micrographs (Fig. 2D, E) and therefore is indispensable for studies of the kinetics of forisome action. For instance, the time-course of forisome volume during a contraction–expansion cycle shows that the volume decrease proceeded an order of magnitude faster than the volume increase (Fig. 2D; estimated 10–90 % response times were 1·6 s and 12·7 s, respectively). This suggests that the volume decrease is limited by diffusion to a much lesser extent than the increase, which will have to be accounted for by any mechanistic model on the molecular level. Another intriguing finding is the fact that the polar circumference changes very little (Fig. 2E) as Canavalia forisomes undergo the Ca2+-induced transition from parallelepipeds of high aspect ratio to ones of a markedly lower aspect ratio (Fig. 1). This could be explained by the existence of fibrils of constant length running along the forisome surface from one tail insertion to the other. However, this would imply the hardly intuitive idea of two right-angle kinks moving along these fibrils in synchrony but in opposite directions during the responses, to maintain the box-like shape. We consider it more likely that the three-dimensional organization of the fibrils is modified during the reaction in ways which, perhaps coincidentally, result in changes in forisome length being cancelled out by reverse changes in tip diameter. A more detailed understanding of forisome geometry on the molecular level is required to solve this problem.
The cross-sectional surface area of a forisome defines the proportion of the sieve tube which may be occluded by the protein body. Therefore, the physiologically most significant finding in the present study is the fact that this parameter increased from 21·3 µm2 to 295 µm2 in the presence of Ca2+ (Table 1). In terms of figures, these values correspond to cross-sectional areas of circular tubes of 5·2 µm and 19·4 µm diameter, respectively. The geometry of SEs in C. gladiata stems was not systematically studied, but an analysis of the micrographs available showed that SE diameters ranged from 9 µm to a rarely observed maximum of 17 µm. Thus, geometric data acquired from isolated Canavalia forisomes would appear to suggest efficient and possibly complete SE occlusion by forisomes in this species, in contrast to Vicia (Peters et al., 2006). This difference would appear to be due to the 9-fold Ca2+-dependent volume increase in Canavalia, which significantly exceeds that reported from Vicia (about 3-fold; Knoblauch et al., 2003).
ACKNOWLEDGEMENTS
A.Q.S. acknowledges support by the National Science Foundation's Sensors and Sensor Networks program (grant no. 0510941).
APPENDIX
DERIVED PARAMETERS OF FORISOME GEOMETRY
In addition to forisome length (L), forisome main body central diameter (D), and tip diameter (d) which were measured directly on micrographs, a number of useful geometric parameters such as forisome volume and greatest cross-sectional area were derived mathematically from the values measured. In doing so, it was assumed that forisome main bodies were symmetric with respect to their equatorial plane, i.e. D was actually measured in the middle of the forisome equidistant from the tips, and that the diameters d at the two tips were identical.
In estimating the volume of the main bodies of Canavalia forisomes, the fact was utilized that if the cross-sectional area of a body as measured in planes perpendicular to an axis x is known as a continuous function of x called A(x), then the volume V of the body between two of these planes defined by the points x1 and x2 is given by the integral
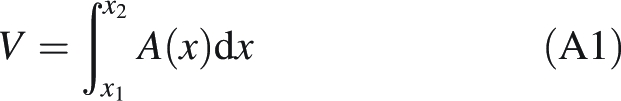 |
A1 |
Corroborating previous ultrastructural studies, it had been found that the forisomes used in this study are more or less square in cross-section. We assume that when we measured their diameter M, we always measured it parallel to a longitudinal surface since the forisomes probably lay on one of these surfaces after sedimentation onto the microscope slide. Thus, the cross sectional area normal to the forisome's longitudinal axis may be estimated to be M2 (shown as a square in Fig. A1). This, however, probably overestimates the cross-sectional area because the longitudinal surfaces in all specimens examined were slightly convex (compare C and D in Fig. 1). To obtain a more realistic estimate of cross-sectional area, a correction factor c should be introduced which in effect subtracts the areas shaded grey in Fig. A1 from M2 so that the area shown in white remains. For simplicity, the outlines of the convex surfaces are approximated as arcs of a circle. Furthermore, on the basis of available data it appears a fair guess that the distance between two corners of a forisome, EG in Fig. A1, is 0·9M (for clarity, co-ordinates on the figures are presented in bold). Consequently, the distance marked m equals (M – EG)/2 = 0·05M. To determine radius r of the circular arc spanning from E to G, the triangle CFG is considered, and it is seen that its sides are CF = (r − m) = (r − 0·05M), FG = EG/2 = 0·45M and CG = r. These three expressions containing only r (which is sought) and/or M (which is measured) as variables are put into Pythagoras's theorem (r − 0·05M)2 + (0·45M)2 = r2, which is resolved for r yielding r = 2·05M. Knowing the lengths of the sides of the triangle CFG also allows angle α to be determined as α = 2 arcsin(FG/r) = 2 arcsin(0·45/2·05) = 25·36°. This information, together with standard formulae of circle geometry, permits the area of the circle segment hatched in Fig. A1 to be determined as (πr2α/360) − (CF × EG/2) = π(2·05M)2α/360 − (2·05M − 0·05M)0·45M/2 = 0·03M2. Further, it follows that the complete white area equals (0·9 M)2 + 4 (0·03M2) = 0·93M2, which provides the sought for correction factor for cross-sectional area, c = 0·93. Similarly, the arc length of the hatched area is found to be 2·05Mπα/180 = 0·907M, providing a correction factor, g, for equatorial circumference which is given by 4gM. The factor g will be useful also in calculating the surface area of the forisome.
Fig. A1.
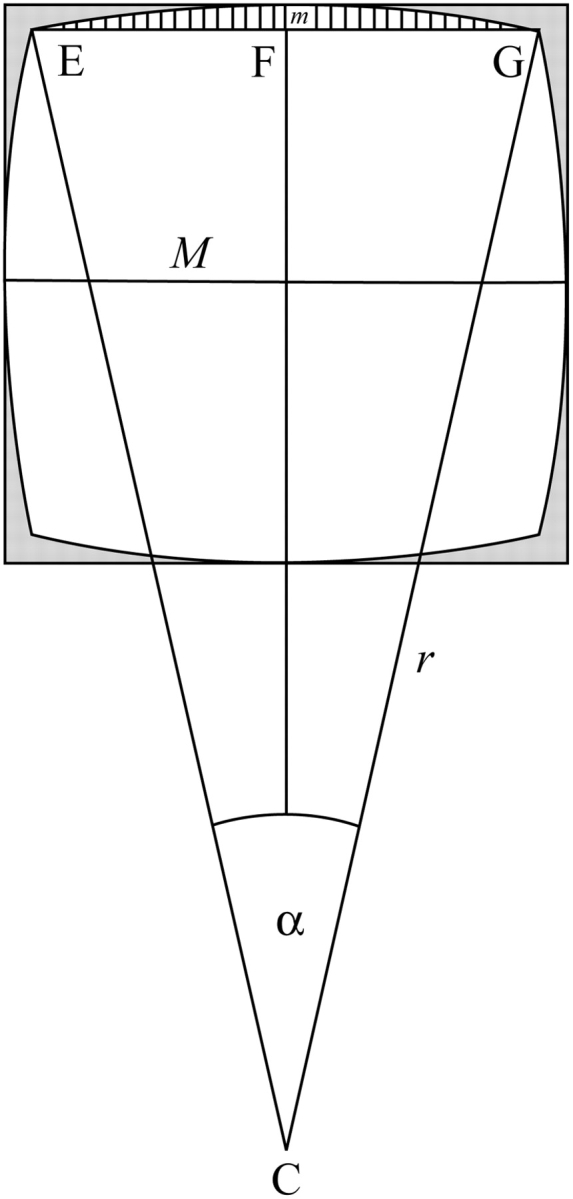
Schematic cross-section of a forisome. Forisomes of the species examined in the present study appear square in cross-section, with slightly convex surfaces. The diameter measured most likely corresponds to the central diameter marked M, since forisomes will probably lie on one of their sides after sedimentation to the microscope slide, so that the direction of observation will be more or less parallel with two of the surfaces. The present observations suggest that the distance from one edge to a neighbouring one, EG, is about 0·9 M in the forisomes studied. From these facts it can be derived that the cross-sectional surface area of a forisome, corresponding to the white area in the figure, is about the measured diameter M squared (equivalent to the outer square including the grey zones) multiplied by 0·93 (cross-sectional correction factor, c), and that the length of one of the four arcs that form the convex surfaces of the forisome equals M multiplied by 0·907 (equatorial circumferential correction factor, g).
To compute forisome volume, a forisome oriented with its centre located at the origin of a Cartesian co-ordinate system so that its longitudinal axis corresponds to x, and the y- and z-axes protrude through the centres of the longitudinal surfaces (corresponding to the orientation of the axis M in Fig. A1), is imagined. A representation of this description is given in Fig. A2 where only one-quarter of the medial longitudinal cross-section of the forisome is shown shaded grey; the other three-quarters as well as axis z can be safely ignored in the following considerations, as they are assumed to be symmetric with the quarter shown and the y-axis, respectively. The parameters actually measured (L, D, d) are indicated as they relate to the partial model (Fig. A2).
Fig. A2.
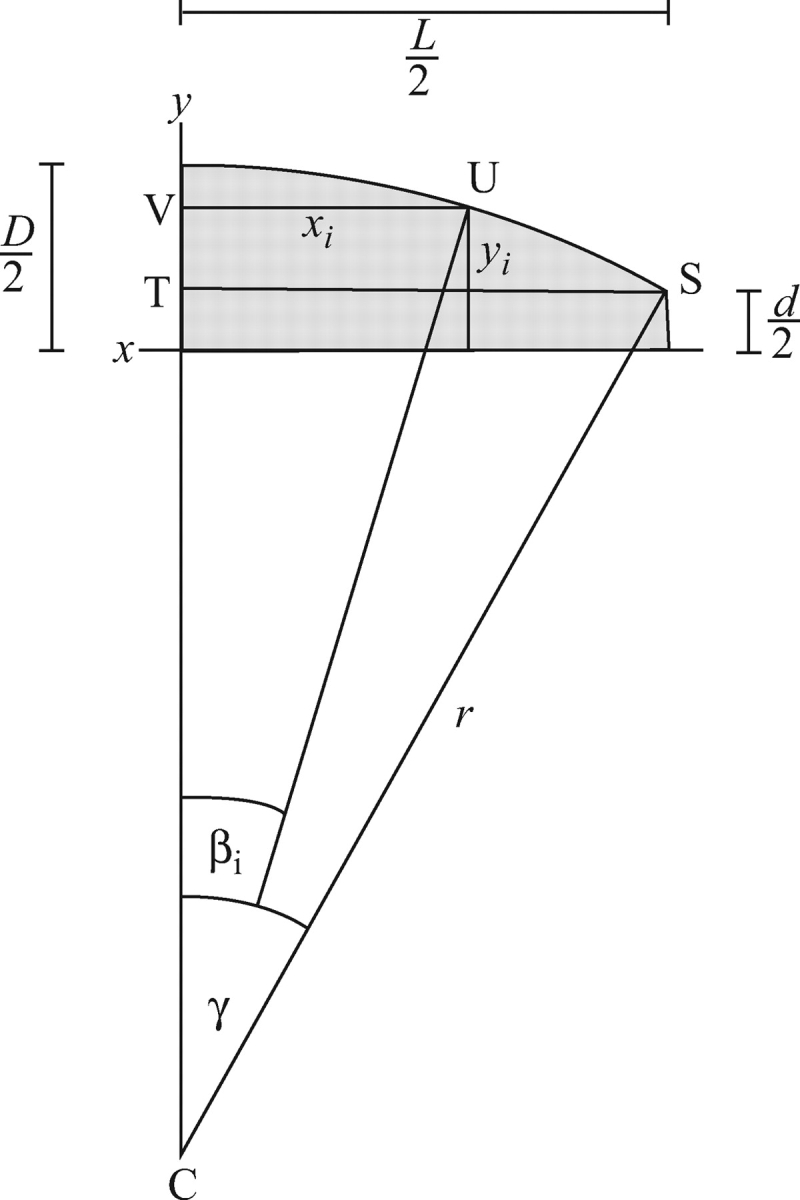
Geometric basis of forisome volume estimation. One-quarter of a median longitudinal cross-section of an idealized forisome the centre of which is located at the origin of the x-y co-ordinate system, is shown in grey; the x-axis corresponds to the longitudinal axis of the forisome. Measured parameters D (central diameter), d (tip diameter) and L (length) are indicated. The outer forisome surface is assumed to be an arc of a circle of radius r = CS. The curved surface between x = 0 and x = L/2 is generated as the angle β runs from 0 to its maximum value,γ. yi is half of the diameter of the forisome at position xi, corresponding to βi. See text for details.
The outer surface of the forisome is assumed to be an arc of a circle with radius r, corresponding to an angle γ. Every point on this arc is defined by its x and y values, and corresponds to angle β; the whole arc is produced as β runs from 0 to γ. Aiming to express the parameters required to define the arc in terms of parameters that can be actually measured, we consider triangle CTS where CS equals r, and note that
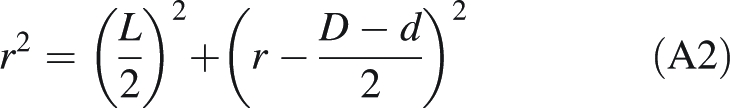 |
A2 |
hence
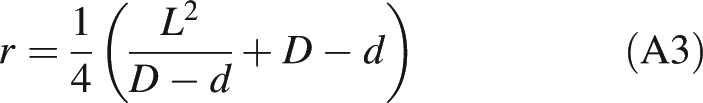 |
A3 |
From triangle CVU, it is concluded that the distance CVi for a given xi is
 |
A4 |
which helps us to express yi in terms of known parameters and the variable x only:
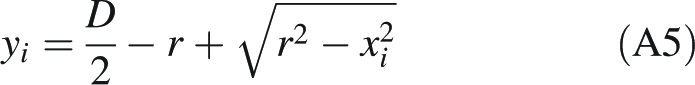 |
A5 |
As y corresponds to the forisome's half diameter measured perpendicularly to the longitudinal axis from the midline of one of its sides to the opposite one (M in Fig. A1), the cross-sectional area A of the forisome now can be described as a function of x:
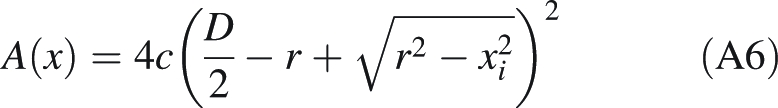 |
A6 |
With this information, eqn A1 can be evaluated analytically for the interval from x1 = 0 to x2 = L/2; note that the result needs to be multiplied by 2 to give the volume of the complete forisome, V:
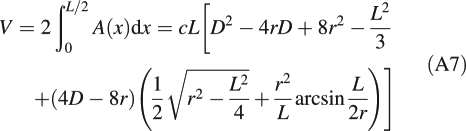 |
A7 |
It may be noted that the term, arcsin (L/2r), is an expression for angle γ using parameters readily measured on micrographs. It is helpful also in calculating the length of the lateral surface of the forisome main body, given by 2r arcsin(L/2r). Accordingly, the polar circumference of the main body is found as 2[2r arcsin(L/2r) + d].
Forisome surface area is estimated in a similar manner. Since it is assumed that the distance from one edge of the forisome main body to the next measured along the surface at constant distance from the yz-plane is 0·907 M (where 0·907 is the equatorial circumferential correction factor g), eqn A5 can be used to express the length of the surface line between two edges of the forisome body (i.e. the length of one of the arcs shown in Fig. A1) as a function of x:
 |
A8 |
The integral of this function in the interval from x1 = 0 to x2 = L/2 gives us half the surface area of one of the four long sides of the forisome main body:
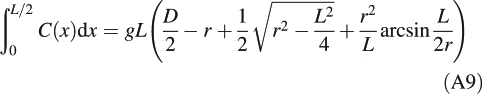 |
A9 |
To obtain the complete surface area of the forisome main body, S, this integral is multiplied by 8, and the 2-fold of the area of the tip plane, cd2, minus the cross-sectional areas of the tails, πT2/4 (where T is the tail diameter at the tail bases, which can be measured), has to be added:
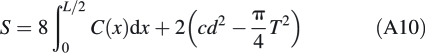 |
A10 |
LITERATURE CITED
- Bacarini P. Intorno ad una particolarita dei vasi cribosi nelle Papilionacee. Malpighia. 1892;6:53–57. [Google Scholar]
- Behnke HD. Nondispersive protein bodies in sieve elements: a survey and review of their origin, distribution and taxonomic significance. IAWA Bulletin. 1991;12:143–175. [Google Scholar]
- Behnke HD, Sjolund RD. Sieve elements. Berlin: Springer; 1990. [Google Scholar]
- van Bel AJE, Ehlers K, Knoblauch M. Sieve elements caught in the act. Trends in Plant Science. 2002;7:126–132. doi: 10.1016/s1360-1385(01)02225-7. [DOI] [PubMed] [Google Scholar]
- Cronshaw J, Sabnis DD. Phloem proteins. In: Behnke HD, Sjolund RD, editors. Sieve elements. Berlin: Springer; 1990. pp. 257–283. [Google Scholar]
- Doyle JJ, Luckow MA. The rest of the iceberg: legume diversity and evolution in a phylogenetic context. Plant Physiology. 2003;131:900–910. doi: 10.1104/pp.102.018150. [DOI] [PMC free article] [PubMed] [Google Scholar]
- Evert RF. Sieve-tube structure in relation to function. Bio-Science. 1982;32:789–795. [Google Scholar]
- Gould N, Thorpe MR, Koroleva O, Minchin PEH. Phloem hydrostatic pressure relates to solute loading rate: a direct test of the Münch hypothesis. Functional Plant Biology. 2005;32:1019–1026. doi: 10.1071/FP05036. [DOI] [PubMed] [Google Scholar]
- Knoblauch M, Peters WS. Forisomes, a novel type of Ca2+-dependent protein motor. Cell Motility and the Cytoskeleton. 2004a;58:137–142. doi: 10.1002/cm.20006. [DOI] [PubMed] [Google Scholar]
- Knoblauch M, Peters WS. Biomimetic actuators: where technology and cell biology merge. Cellular and Molecular Life Sciences. 2004b;61:2497–2509. doi: 10.1007/s00018-004-4158-0. [DOI] [PubMed] [Google Scholar]
- Knoblauch M, Peters WS, Ehlers K, van Bel AJE. Reversible calcium-regulated stopcocks in legume sieve tubes. The Plant Cell. 2001;13:1221–1230. doi: 10.1105/tpc.13.5.1221. [DOI] [PMC free article] [PubMed] [Google Scholar]
- Knoblauch M, Noll GA, Müller T, Prüfer D, Schneider-Hüther I, Scharner D, et al. ATP-independent contractile proteins from plants. Nature Materials. 2003;2:600–603. doi: 10.1038/nmat960. [DOI] [PubMed] [Google Scholar]
- Laflèche D. Ultrastucture et cytochimie des inclusions flagellées des cellules criblées de Phaseolus vulgaris. Journal de Microscopie. 1966;5:493–510. [Google Scholar]
- Lang A, Minchin PEH. Phylogenetic distribution and mechanism of translocation inhibition by chilling. Journal of Experimental Botany. 1986;37:389–398. [Google Scholar]
- Lawton DM. Ultrastructural comparison of the tailed and tailless P-protein crystals respectively of runner bean (Phaseolus multiflorus) and garden pea (Pisum sativum) with tilting stage electron microscopy. Protoplasma. 1978a;97:1–11. [Google Scholar]
- Lawton DM. P-protein crystals do not disperse in uninjured sieve elements of roots in runner bean (Phaseolus multiflorus) fixed with glutaraldehyde. Annals of Botany. 1978b;42:353–361. [Google Scholar]
- Lewis G, Schrire B, Mackinder B, Lock M. Legumes of the world. London: Royal Botanical Gardens, Kew; 2005. [Google Scholar]
- Mavroidis C, Dubey A. From pulses to motors. Nature Materials. 2003;2:573–574. doi: 10.1038/nmat973. [DOI] [PubMed] [Google Scholar]
- Mrazek A. Über geformte eiweißartige Inhaltskörper bei den Leguminosen. Österreichische Botanische Zeitschrift. 1910;60:198–201. [Google Scholar]
- Palevitz BA, Newcomb EH. The ultrastructure and development of tubular and crystalline P-protein in the sieve elements of certain papilionaceous legumes. Protoplasma. 1971;72:399–425. [Google Scholar]
- Peters WS, van Bel AJE, Knoblauch M. The geometry of the forisome/sieve element/sieve plate complex in the phloem of Vicia faba L. leaflets. Journal of Experimental Botany. 2006;57:3091–3098. doi: 10.1093/jxb/erl072. [DOI] [PubMed] [Google Scholar]
- Peters WS, Schnetter R, Knoblauch M. Reversible birefringence suggests a role for molecular self-assembly in forisome contractility. Functional Plant Biology. 2007;34:302–306. doi: 10.1071/FP06281. [DOI] [PubMed] [Google Scholar]
- Pickard WF, Minchin PE. The transient inhibition of phloem translocation in Phaseolus vulgaris by abrupt temperature drops, vibration, and electric shock. Journal of Experimental Botany. 1990;41:1361–1369. [Google Scholar]
- Pickard WF, Minchin PE. The nature of the short-term inhibition of stem translocation produced by abrupt stimuli. Australian Journal of Plant Physiology. 1992;19:471–480. [Google Scholar]
- Pickard WF, Knoblauch M, Peters WS, Shen AQ. Prospective energy densities in the forisome, a new smart material. Materials Sciences & Engineering C. 2006;26:104–112. [Google Scholar]
- Sabnis DD, Sabnis HM. Phloem proteins: structure, biochemistry and function. In: Iqbal M, editor. The cambial derivatives (Encyclopedia of Plant Anatomy, Vol 9) Berlin: Borntraeger; 1995. pp. 271–292. [Google Scholar]
- Shen AQ, Hamlington BD, Knoblauch M, Peters WS, Pickard WF. Forisome-based biomimetic smart materials. Smart Structures and Systems. 2006;2:225–236. [Google Scholar]
- Sjolund RD. The phloem sieve element: a river runs through it. The Plant Cell. 1997;9:1137–1146. doi: 10.1105/tpc.9.7.1137. [DOI] [PMC free article] [PubMed] [Google Scholar]
- Straßburger E. Über den Bau und die Verrichtungen der Leitungs-bahnen in den Pflanzen (Histologische Beiträge 3) Jena: Fischer; 1892. [Google Scholar]
- Wergin WP, Newcomb EH. Formation and dispersal of crystalline P-protein in sieve elements of soybean (Glycine max L.) Protoplasma. 1970;71:365–388. [Google Scholar]