

Abstract
Background and Aims
Selenium (Se) and sulfur (S) exhibit similar chemical properties. In flowering plants (angiosperms) selenate and sulfate are acquired and assimilated by common transport and metabolic pathways. It is hypothesized that most angiosperm species show little or no discrimination in the accumulation of Se and S in leaves when their roots are supplied a mixture of selenate and sulfate, but some, termed Se-accumulator plants, selectively accumulate Se in preference to S under these conditions.
Methods
This paper surveys Se and S accumulation in leaves of 39 angiosperm species, chosen to represent the range of plant Se accumulation phenotypes, grown hydroponically under identical conditions.
Results
The data show that, when supplied a mixture of selenate and sulfate: (1) plant species differ in both their leaf Se ([Se]leaf) and leaf S ([S]leaf) concentrations; (2) most angiosperms show little discrimination for the accumulation of Se and S in their leaves and, in non-accumulator plants, [Se]leaf and [S]leaf are highly correlated; (3) [Se]leaf in Se-accumulator plants is significantly greater than in other angiosperms, but [S]leaf, although high, is within the range expected for angiosperms in general; and (4) the Se/S quotient in leaves of Se-accumulator plants is significantly higher than in leaves of other angiosperms.
Conclusion
The traits of extraordinarily high [Se]leaf and leaf Se/S quotients define the distinct elemental composition of Se-accumulator plants.
Key words: Angiosperm, Astragalus, Brassica, leaf, mineralogy, selenium, sulfur
INTRODUCTION
Sulfur (S) and selenium (Se) are both naturally occurring Group VIA elements and exhibit similar chemical properties (Dhillon and Dhillon, 2003; Sors et al., 2005b; Broadley et al., 2006; White et al., 2007). Although S is an essential element for plant nutrition (Mengel and Kirkby, 2001), Se does not appear to be required for plant growth or reproduction, and excessive Se concentrations can be toxic (Dhillon and Dhillon, 2003; White et al., 2004, 2007; Broadley et al., 2006).
Species of flowering plants (angiosperms) differ in their abilities to accumulate S (Hurd-Karrer, 1937; Willey and Wilkins, 2006) and Se (Rosenfeld and Beath, 1964; Brown and Shrift, 1982; Dhillon and Dhillon, 2003; White et al., 2004). For example, brassicas and alliums accumulate unique organo-S compounds in their tissues and, consequently, have higher tissue S concentrations than many other plants grown under the same conditions (Mengel and Kirkby, 2001; Willey and Wilkins, 2006). Similarly, although there is little variation in shoot Se concentrations ([Se]shoot) between angiosperm orders, there is considerable variation in [Se]shoot between plant species within orders (White et al., 2004). Indeed, angiosperms have been divided into three ecological types of ‘non-accumulator’, ‘Se-indicator’ and ‘Se-accumulator’ plants (Rosenfeld and Beath, 1964; Shrift, 1969; Brown and Shrift, 1982; Dhillon and Dhillon, 2003; White et al., 2004). Non-accumulator plants are unable to grow on seleniferous soils and Se is toxic at tissue concentrations as low as 10–100 µg Se g−1 dry matter (Rosenfeld and Beath, 1964; White et al., 2004), whereas Se-indicator plants can colonize both non-seleniferous and seleniferous soils and tolerate tissue Se concentrations approaching 1000 µg Se g−1 dry matter (Rosenfeld and Beath, 1964; Moreno Rodriguez et al., 2005). The distribution of Se-accumulator plants is generally restricted to seleniferous soils, where their shoots can contain up to 20–40 mg Se g−1 dry matter (Rosenfeld and Beath, 1964; Brown and Shrift, 1982). However, this ecological classification confounds the traits of Se accumulation and Se tolerance. A recent meta-analysis of literature data (White et al., 2004) suggests that [Se]shoot exhibits a continuous distribution among angiosperm species and, although Se-accumulator plants generally have a higher [Se]shoot than other angiosperm species, it is unclear whether they form a discrete subset of angiosperm [Se]shoot consistent with the epithet ‘Se-accumulator plants’.
Plants acquire Se primarily as selenate (SeO42−), which enters root cells through high-affinity sulfate transporters (HASTs) in their plasma membrane (Terry et al., 2000; White et al., 2004, 2007; Sors et al., 2005b). The genome of the model plant Arabidopsis thaliana contains 14 genes encoding sulfate transporters, and a similar number are present in the genomes of other plant species (Hawkesford, 2005; Hawkesford and De Kok, 2006). Several sulfate transporters appear to contribute to selenate uptake and accumulation. Circumstantial evidence suggests that these sulfate transporters differ in their selectivity between selenate and sulfate. Not only do different plant species (Rosenfeld and Beath, 1964; Bell et al., 1992; Galeas et al., 2007) and ecotypes of plant species (Feist and Parker, 2001) have contrasting shoot Se/S quotients when grown under the same conditions, but also the shoot Se/S quotients of a single plant genotype, such as Arabidopsis thaliana accession Col-5 gl1, change with its complement of root HASTs (White et al., 2004). It is thought that Se-accumulator plants, such as Astragalus bisulcatus and Stanleya pinnata, always have shoot Se/S quotients greater than those in the rhizosphere solution (Bell et al., 1992; Feist and Parker, 2001; Ellis and Salt, 2003; Galeas et al., 2007), whereas all other angiosperms have similar or lower shoot Se/S quotients than those of the rhizosphere solution (Hurd-Karrer, 1937; Bell et al., 1992; Barak and Goldman, 1997; Kopsell and Randle, 1997, 1999; Feist and Parker, 2001; Grieve et al., 2001; Suarez et al., 2003; White et al., 2004; Galeas et al., 2007). It is, therefore, hypothesized that the dominant HASTs of Se-accumulator plants are selective for selenate, whereas those in other angiosperm species are selective for sulfate (White et al., 2004; Sors et al., 2005b; Broadley et al., 2006). These distinct phenotypes have been reported for only a limited number of plant species, but, if the observation and hypothesis are correct, then the protein structure of the HASTs from Se-accumulator plants could be used to identify the elusive molecular determinant for the anionic selectivity of sulfate transporters.
In the present study, 39 plant species chosen to represent the range and distribution of [Se]shoot estimated for 185 angiosperm species in a previous literature survey (White et al., 2004) were grown hydroponically in a glasshouse in a solution with a complete mineral complement containing 910 µm sulfate and 0·63 µm selenate. Preliminary experiments suggested that this selenate concentration was unlikely to result in toxic tissue Se concentrations. Leaf Se concentrations ([Se]leaf) were determined to test whether the [Se]leaf of Se-accumulator plants was distinct from the [Se]leaf of other angiosperms, and leaf S concentrations ([S]leaf) were determined to assess whether [S]leaf or leaf Se/S quotients differed between Se-accumulator plants and other angiosperms. From these new analyses, it was concluded that, when grown hydroponically at low, non-toxic Se concentrations: (1) [Se]leaf was significantly greater in Se-accumulator plants than in other angiosperms; (2) [S]leaf, although high in Se-accumulator plants, is within the range expected for angiosperms in general; and (3) the leaf Se/S quotient had a discontinuous distribution among angiosperm species, with the Se/S quotients in leaves of Se-accumulator plants being significantly greater than those in other angiosperms. This last, discrete compositional trait could be used to identify Se-accumulator species for subsequent molecular studies.
MATERIALS AND METHODS
Thirty-nine plant species were grown in this study (Table 1). These were chosen to represent the range and distribution of relative shoot Se concentrations ([Se]shoot) estimated for 185 angiosperm species in a previous literature survey (White et al., 2004). Seeds of Astragalus glycyphyllos and Astragalus racemosus were obtained from B and T World Seeds (Paguignan, France). Seeds of Atriplex hortensis, Beta vulgaris, Bouteloua gracilis, Cucumis sativa, Helianthus annuus, Linum usitatissimum, Oryza sativa, Oryzopsis hymenoides, Raphanus sativa, Solanum melongena, Sporobolus airoides, Trifolium pratense and Trifolium repens were obtained from Chiltern Seeds (Ulverston, UK). Seeds of Agrostis stolonifera, Brassica arvense, Brassica juncea, Brassica nigra, Bromopsis inermis, Cynodon dactylon, Dactylis glomerata, Holcus lanatus, Lolium multiflorum, Medicago lupulina, Medicago sativa, Panicum miliaceum, Sinapis alba, Sorghum bicolor and Trifolium subterraneum were obtained from Herbiseed (Twyford, UK). Solanum tuberosum was obtained from Higgins Agriculture (Doncaster, UK). Seeds of Brassica carinata, Brassica oleracea, Hordeum vulgare and Lycopersicon pennellii were obtained from Horticulture Research International (Wellesbourne, UK). Seeds of Machaeranthera bigelovii were obtained from Rocky Mountain Rare Plants (Franktown, CO, USA). Seeds of Astragalus sinicus were obtained from Sheffield's Seed Company (Locke, NY, USA). Seeds of Machaeranthera tanacetifolia and Stanleya pinnata were obtained from Western Native Seed (Coaldale, CO, USA). Seeds were germinated, seedlings were weaned and plants were grown in a hydroponic system using a nutrient film technique essentially as described by Broadley et al. (2003, 2004). The experiment was performed between July and August, 2004. All seeds were germinated in the dark on filter paper moistened with deionized water at either 25 or 4 °C. Once a radicle was observed, individual seedlings were transplanted to rockwool plugs (2·5 × 2·5 × 4 cm; Grodan, Hedehusene, Denmark), which were placed in plastic trays containing tap water in a weaning room at 25 °C. Three to 5 d after transplanting, rockwool plugs containing individual plants were transferred to a hydroponic system in a glasshouse at Wellesbourne, UK. The hydroponic system comprised six covered gullies (5·15 m length × 0·11 m width × 0·05 m depth) constructed from flat-bottomed PVC guttering. The gullies were spaced 0·26 m apart (centre-to-centre). Circular holes were cut with equal spacing in the covers of the gulleys and two rockwool plugs, containing plants of the same species, were placed in each hole such that their bases rested directly on the bottom of the gully. The statistical design allocated all 39 species to each gulley in a random order. A nutrient solution made up in deionized water and containing 2 mm Ca(NO3)2, 2 mm NH4NO3, 0·75 mm MgSO4, 0·5 mm KOH, 0·25 mm KH2PO4, 0·1 mm FeNaEDTA, 30 µm H3BO3, 0·03 mm CaCl2, 10 µm MnSO4, 3 µm CuSO4, 1 µm ZnSO4, 0·5 µm Na2MoO4 and 0·63 µm Na2SeO4 (0·05 mg Se L−1), adjusted daily to pH 6–6·4 using H2SO4, was circulated through the gulleys from a 200-L tank. The total sulfate concentration in the nutrient solution was approx. 910 µm (29·18 mg S L−1). Solutions were replaced weekly. Analysis of fresh and spent nutrient solutions indicated that there were no significant reductions in Se or S concentrations during the experiment. The glasshouse was set to maintain temperatures of 25 °C by day and 15 °C at night using automatic vents and supplementary heating. Plant shoots from the 39 plant species were harvested during vegetative growth. Plant material from the same hole was bulked. Shoots were separated into leaves and stems, where possible, and the fresh weight (f. wt) of each was recorded. Samples were dried in paper bags for 72 h in a fan-assisted oven set to 80 °C. The dry weight (d. wt) of leaves and stems was measured and dry leaf tissue was subsequently milled to a powder. Powdered samples (0·3–1·0 g d. wt) were digested with nitric acid in closed vessels using a microwave digester. Total Se and S contents of dry leaf tissue were determined using inductively coupled plasma emission spectrophotometry (JY24, Jobin-Yvon ISA, Longjumeau, France). Plant material was analysed in batches and, in each batch, a sample spiked with 1 mg Se kg−1 d. wt of a calibration standard Se solution (Fisher Scientific, Loughborough, UK) served as an internal control for the analytical protocol. The recovery of exogenous Se was 103 ± 1 % (mean ± s.e., n = 30 samples). A preliminary examination of the data suggested that the mean values of leaf Se/S quotients were approximately normally distributed, whereas those of [Se]leaf and [S]leaf were approximately log-normally distributed. The appropriate distributions were fitted using GenStat Version 8 (VSN International Ltd, Oxford, UK) with parameter estimates of mean and standard deviation (s.d.). The log-normal transformations were done to the base e. The goodness of fit was tested using a quantile–quantile plot with simultaneous 95 % confidence bands using the statistic given by Michael (1983). The expectation is that if the experimental data truly fit the distribution then all the data in 95 % of such plots will fall entirely within the confidence bands. In all cases there were significant deviations from the ideal when all plant species were included in the analysis. The species with the highest values were sequentially removed from all three distributions until there were no significant improvements in the goodness of fit.
Table 1.
Phylogenetic classification, durations of growth in hydroponics prior to harvest, dry weights (d. wt) of leaf tissue at harvest, dry weight/fresh weight (d. wt/f. wt) quotients of harvested leaves, leaf selenium concentrations, leaf sulfur concentrations and leaf Se/S quotients (expressed as mg Se g−1 S) of 39 angiosperm species supplied with a complete mineral nutrient solution containing 910 µm sulfate and 0·63 µm selenate
| Leaf d. wt (g) |
Leaf d. wt/f. wt (%) |
Leaf Se (mg kg−1 d. wt) |
Leaf S (g kg−1 d. wt) |
Se/S (mg Se g−1 S) |
||||||||||
|---|---|---|---|---|---|---|---|---|---|---|---|---|---|---|
| Rank | Species | Order | Growth period (d) | Mean | s.e. | Mean | s.e. | Mean | s.e. | Mean | s.e. | Mean | s.e. | n |
| 1 | Sorghum bicolor | Poales | 24 | 1·47 | 0·16 | 9·71 | 0·30 | 7·1 | 0·53 | 4·2 | 0·08 | 1·67 | 0·10 | 6 |
| 5 | Bromopsis inermis | Poales | 35 | 1·48 | 13·49 | 12·7 | 6·6 | 1·91 | 1 | |||||
| 8 | Panicum miliaceum | Poales | 28 | 1·85 | 0·25 | 8·48 | 0·12 | 11·9 | 0·23 | 5·4 | 0·18 | 2·21 | 0·10 | 6 |
| 14 | Atriplex hortensis | Caryophyllales | 27 | 0·96 | 0·37 | 8·69 | 0·08 | 6·5 | 0·28 | 4·6 | 0·07 | 1·41 | 0·08 | 3 |
| 19 | Trifolium subterraneum | Fabales | 27 | 0·36 | 0·03 | 17·25 | 0·53 | 14·6 | 0·33 | 8·3 | 0·12 | 1·76 | 0·05 | 6 |
| 23 | Lolium multiflorum | Poales | 28 | 1·85 | 0·11 | 12·75 | 0·16 | 7·5 | 0·28 | 4·5 | 0·11 | 1·65 | 0·03 | 6 |
| 30 | Dactylis glomerata | Poales | 28 | 0·86 | 0·19 | 16·18 | 1·12 | 7·1 | 0·50 | 3·9 | 0·12 | 1·80 | 0·09 | 6 |
| 34 | Lycopersicon pennellii | Solanales | 28 | 0·45 | 0·13 | 12·32 | 0·19 | 21·2 | 0·72 | 12·0 | 0·44 | 1·77 | 0·03 | 6 |
| 40 | Medicago sativa | Fabales | 27 | 0·50 | 0·08 | 16·81 | 1·28 | 6·0 | 0·60 | 4·2 | 0·23 | 1·41 | 0·07 | 6 |
| 43 | Medicago lupulina | Fabales | 27 | 0·47 | 0·04 | 16·62 | 0·86 | 5·7 | 0·30 | 3·5 | 0·06 | 1·64 | 0·07 | 6 |
| 50 | Trifolium pratense | Fabales | 27 | 0·40 | 0·05 | 14·98 | 0·59 | 6·4 | 0·34 | 4·2 | 0·28 | 1·53 | 0·09 | 6 |
| 56 | Bouteloua gracilis | Poales | 57 | 0·72 | 0·21 | 25·66 | 0·71 | 6·9 | 0·64 | 3·7 | 0·17 | 1·87 | 0·10 | 6 |
| 60 | Solanum tuberosum | Solanales | 27 | 1·22 | 0·21 | 8·66 | 0·28 | 9·8 | 0·48 | 4·8 | 0·08 | 2·02 | 0·10 | 6 |
| 65 | Hordeum vulgare | Poales | 30 | 1·09 | 0·47 | 9·83 | 0·67 | 12·3 | 0·79 | 7·1 | 0·47 | 1·73 | 0·03 | 5 |
| 70 | Holcus lanatus | Poales | 28 | 0·75 | 0·11 | 13·25 | 0·29 | 8·7 | 0·54 | 5·1 | 0·32 | 1·70 | 0·06 | 6 |
| 80 | Cynodon dactylon | Poales | 35 | 2·40 | 0·28 | 13·84 | 0·21 | 14·1 | 0·54 | 7·2 | 0·39 | 1·97 | 0·05 | 4 |
| 84 | Sinapis alba | Brassicales | 27 | 2·52 | 0·62 | 11·60 | 0·18 | 21·9 | 0·67 | 12·9 | 0·36 | 1·70 | 0·03 | 6 |
| 86 | Beta vulgaris | Caryophyllales | 33 | 0·59 | 0·20 | 9·83 | 0·23 | 5·6 | 0·30 | 4·1 | 0·16 | 1·36 | 0·06 | 6 |
| 93 | Astragalus sinicus | Fabales | 35 | 0·45 | 0·29 | 14·37 | 0·05 | 6·9 | 1·00 | 4·1 | 0·30 | 1·68 | 0·12 | 2 |
| 104 | Astragalus glycyphyllos | Fabales | 26 | 0·24 | 0·17 | 18·48 | 1·22 | 7·0 | 1·47 | 6·3 | 0·26 | 1·12 | 0·24 | 6 |
| 112 | Agrostis stolonifera | Poales | 28 | 0·53 | 0·07 | 13·57 | 0·35 | 13·8 | 0·59 | 7·3 | 0·25 | 1·90 | 0·04 | 6 |
| 123 | Sporobolus airoides | Poales | 42 | 0·34 | 0·07 | 16·91 | 0·75 | 8·8 | 0·95 | 5·4 | 0·25 | 1·60 | 0·12 | 6 |
| 135 | Solanum melongena | Solanales | 35 | 2·64 | 0·20 | 9·08 | 0·25 | 5·8 | 0·08 | 3·3 | 0·06 | 1·80 | 0·05 | 6 |
| 142 | Raphanus sativa | Brassicales | 27 | 4·55 | 0·42 | 8·06 | 0·33 | 22·2 | 0·62 | 11·6 | 0·39 | 1·93 | 0·04 | 6 |
| 153 | Cucumis sativa | Cucurbitales | 23 | 3·81 | 1·07 | 10·76 | 0·44 | 10·4 | 0·49 | 6·5 | 0·31 | 1·62 | 0·03 | 6 |
| 163 | Brassica oleracea | Brassicales | 28 | 6·27 | 0·16 | 8·53 | 0·11 | 33·0 | 0·75 | 21·8 | 0·40 | 1·51 | 0·01 | 6 |
| 168 | Helianthus annuus | Asterales | 22 | 5·14 | 0·50 | 11·29 | 0·33 | 7·6 | 0·30 | 4·7 | 0·18 | 1·61 | 0·03 | 5 |
| 169 | Oryzopsis hymenoides | Poales | 52 | 0·25 | 25·41 | 5·5 | 3·6 | 1·53 | 1 | |||||
| 171 | Linum usitatissimum | Malpighiales | 27 | 1·17 | 0·04 | 14·09 | 0·37 | 13·4 | 0·92 | 7·1 | 0·45 | 1·90 | 0·02 | 6 |
| 172 | Brassica juncea | Brassicales | 30 | 0·91 | 0·19 | 11·24 | 0·73 | 21·0 | 2·68 | 13·0 | 1·75 | 1·63 | 0·03 | 3 |
| 174 | Oryza sativa | Poales | 42 | 1·60 | 18·61 | 11·3 | 5·3 | 2·12 | 1 | |||||
| 175 | Stanleya pinnata | Brassicales | 28 | 0·13 | 0·03 | 12·76 | 0·37 | 68·6 | 12·70 | 20·1 | 1·46 | 3·27 | 0·46 | 6 |
| 176 | Brassica nigra | Brassicales | 27 | 3·69 | 0·25 | 9·36 | 0·41 | 17·9 | 0·89 | 8·4 | 1·04 | 2·37 | 0·42 | 6 |
| 179 | Trifolium repens | Fabales | 27 | 0·41 | 0·08 | 11·16 | 0·47 | 7·5 | 0·48 | 4·7 | 0·23 | 1·62 | 0·07 | 6 |
| 180 | Brassica carinata | Brassicales | 27 | 6·97 | 0·85 | 9·85 | 0·19 | 17·0 | 0·29 | 9·9 | 0·14 | 1·72 | 0·02 | 6 |
| 181 | Astragalus racemosus | Fabales | 52 | 0·07 | 0·02 | 21·87 | 1·56 | 282·8 | 48·48 | 19·5 | 0·88 | 14·14 | 2·29 | 6 |
| – | Brassica arvense | Brassicales | 27 | 3·55 | 0·40 | 8·07 | 0·11 | 24·4 | 0·89 | 14·0 | 0·60 | 1·75 | 0·03 | 6 |
| – | Machaeranthera bigelovii | Asterales | 36 | 0·30 | 0·07 | 15·34 | 0·63 | 5·7 | 0·46 | 3·8 | 0·17 | 1·51 | 0·11 | 6 |
| – | Machaeranthera tanacetifolia | Asterales | 28 | 0·25 | 0·05 | 12·37 | 0·78 | 15·2 | 0·86 | 8·5 | 0·47 | 1·81 | 0·14 | 5 |
Species were ranked according to their relative shoot Se concentrations estimated from a meta-analysis of literature data (White et al., 2004). (s.e., standard error of the mean; n, number of samples). Three species with extreme shoot Se or S concentrations are indicated in bold type.
RESULTS AND DISCUSSION
Thirty-nine plant species were chosen to represent the range and distribution of relative [Se]shoot estimated for 185 angiosperm species in a previous literature survey (White et al., 2004). When these species were grown hydroponically in the same glasshouse environment, there were marked differences between plant species in their mean [Se]leaf (Table 1, Fig. 1). The mean [Se]leaf of 37 species (mg Se kg−1 d. wt) appeared to show a log-normal distribution (Fig. 2A, mean = 2·35 ± 0·08, s.d. = 0·496 ± 0·058, n = 37). There were small but significant deviations (P < 0·05) from this distribution, but further removal of species with the highest mean [Se]leaf from the analysis did not continue to improve the fit. The low probabilities of the two plant species with the highest mean [Se]leaf being part of this distribution, Astragalus racemosus (P < 0·0001) and Stanleya pinnata (P < 0·0001), suggests the occurrence of at least two distinct phenotypes for [Se]leaf. Even if these two species were to be included in the fitting procedure, the probabilities of observing such extreme values remain low (Astragalus racemosus, P < 0·0001; Stanleya pinnata P = 0·011). This is consistent with previous studies leading to the hypothesis that Se non-accumulator and Se-accumulator plants come from distinct populations, rather than there being a single, continuous distribution of [Se]leaf among angiosperm species.
Fig. 1.

Leaf Se concentrations of 36 angiosperm species grown hydroponically in a complete mineral nutrient solution containing 910 µm sulfate and 0·63 µm selenate, ranked according to their relative shoot Se concentrations estimated from a meta-analysis of literature data (White et al., 2004). The species numbers are: (1) Sorghum bicolor, (5) Bromopsis inermis, (8) Panicum miliaceum, (14) Atriplex hortensis, (19) Trifolium subterraneum, (23) Lolium multiflorum, (30) Dactylis glomerata, (34) Lycopersicon pennellii, (40) Medicago sativa, (43) Medicago lupulina, (50) Trifolium pratense, (56) Bouteloua gracilis, (60) Solanum tuberosum, (65) Hordeum vulgare, (70) Holcus lanatus, (80) Cynodon dactylon, (84) Sinapis alba, (86) Beta vulgaris, (93) Astragalus sinicus, (104) Astragalus glycyphyllos, (112) Agrostis stolonifera, (123) Sporobolus airoides, (135) Solanum melongena, (142) Raphanus sativa, (153) Cucumis sativa, (163) Brassica oleracea, (168) Helianthus annuus, (169) Oryzopsis hymenoides, (171) Linum usitatissimum, (172) Brassica juncea, (174) Oryza sativa, (175) Stanleya pinnata, (176) Brassica nigra, (179) Trifolium repens, (180) Brassica carinata, (181) Astragalus racemosus.
Fig. 2.
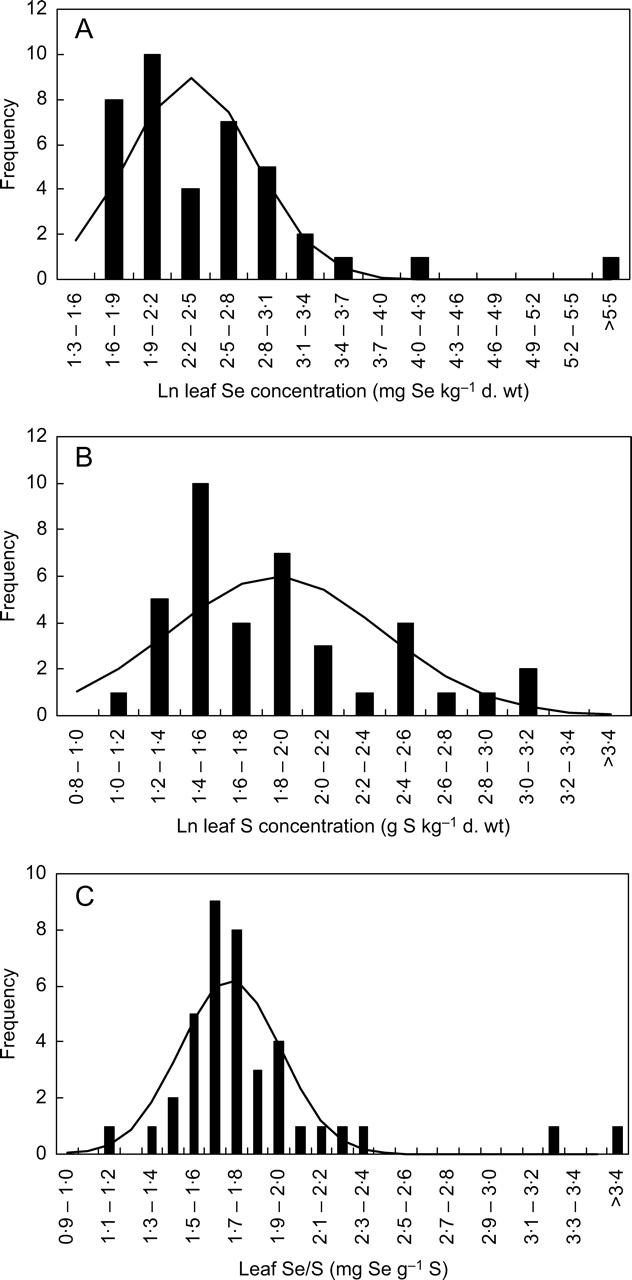
Frequency distributions of (A) the natural log of leaf Se concentrations (mg Se kg−1 d. wt), (B) the natural log of leaf S concentrations (g Se kg−1 d. wt) and (C) leaf Se/S quotients (mg Se g−1 S) in 39 angiosperm species grown hydroponically in a complete mineral nutrient solution containing 910 µm sulfate and 0·63 µm selenate. Lines indicate the log-normal (A, mean = 2·35, s.d. = 0·496, n = 37; B, mean = 1·87, s.d. = 0·520, n = 39) or normal (C, mean = 1·72, s.d. = 0·240, n = 37) distributions fitted to data from either all species or the 37 species with the lowest leaf Se concentrations.
The rank order for mean [Se]leaf of the 39 species grown hydroponically in the present study was not identical to their rank order of relative [Se]shoot estimated from a previous literature survey (Fig. 1). For both the hydroponic study and the literature survey it was assumed that selenate was the only form of Se taken up by the plant. The underlying reasons for the lack of concordance between this hydroponic experiment and the literature survey are likely to reflect the following: (1) In the present study all plant species were assayed under identical conditions, whereas the meta-analysis performed in the literature survey integrated data from many studies performed under contrasting environmental conditions (White et al., 2004). The rank order of species for [Se]shoot in the literature survey could be confounded by several factors. (a) Plant species might show different Michaelis–Menten-type relationships between selenate concentration in the rhizosphere and [Se]shoot and, if they did, the rank order of species for [Se]shoot might differ between experiments performed at contrasting rhizosphere selenate concentrations. (b) The uptake of selenate by different plant species might show contrasting sensitivities to environmental factors such as temperature, pH and redox conditions of the rhizosphere or the presence of competing anions such as sulfate and phosphate, and, if this were true, the rank order of species for [Se]shoot could be influenced by growth substrate and/or composition of the rhizosphere solution. (c) In some experimental systems, Se might be present in chemical forms other than selenate, such as selenite and/or organoselenium compounds that are taken up by roots by transport proteins other than HASTs, and the rank order of species for [Se]shoot might then reflect the complement of these transport proteins in different plant species. (2) When Se is supplied as selenate, there is considerable variation in [Se]shoot between ecotypes of wild plants (Davis, 1972; Feist and Parker, 2001; Zhang et al., 2006a, b) and varieties of crop plants (Bañuelos et al., 1997, 2003; Kopsell and Randle, 1997; Pezzarossa et al., 1999; Lyons et al., 2005). Nevertheless, in both the hydroponic study reported here and in the literature survey, Stanleya pinnata and Astragalus racemosus were consistently observed to have extremely high mean [Se]leaf. Intriguingly, the lack of concordance of the rank order of angiosperm species for [Se]shoot in the hydroponic study and the literature survey reported here contrasts sharply with a similar comparison of the rank order of angiosperm species for [Ca]shoot between a hydroponic study and a literature survey (Broadley et al., 2003), which might reflect (a) the quasi-linear increase of [Ca]shoot with increasing rhizosphere Ca2 + (White, 2001) and (b) the likelihood that Ca is taken up by plants solely as Ca2 + (White and Broadley, 2003).
Significant differences in mean [S]leaf were observed among plant species grown hydroponically in the same glasshouse environment (Table 1). The mean [S]leaf (g S kg−1 d. wt) of the 39 species studied here appeared to show a log-normal distribution (Fig. 2B, mean = 1·87 ± 0·08, s.d. = 0·52 ± 0·06, n = 39). This is consistent with the distribution of relative [S]shoot in 121 angiosperm species obtained in a recent literature survey (Willey and Wilkins, 2006). Although not as extreme as for [Se]leaf, there were significant deviations from the log-normal distribution (P < 0·01). The two species with the highest mean [Se]leaf, Astragalus racemosus and Stanleya pinnata, also had the third and second highest mean [S]leaf, respectively. Brassica oleracea had the highest mean [S]leaf. Exclusion of these three species from the fitting resulted in a log-normal distribution with no significant deviations (mean = 1·78 ± 0·07, s.d. = 0·41 ± 0·05, n = 36). Based on this distribution, the probabilities of observing the three highest mean [S]leaf were P = 0·008, 0·0015 and 0·0019 respectively. In general, plant species with greater mean [Se]leaf also had greater mean [S]leaf, and the leaf Se/S quotient for most plant species was similar (Fig. 3C). However, although Se-accumulator plants had extraordinarily high mean [Se]leaf, this was not reflected in their mean [S]leaf and there appeared to be a limit to [S]leaf of about 20 mg g−1 d. wt (Fig. 3). This is consistent with the observations of Hurd-Karrer (1937) and Rosenfeld and Beath (1964). Consequently, the leaf Se/S quotients (mg Se g−1 S) in Se-accumulator species were greater than those of other angiosperm species (Fig. 3), and there was little probability that the Se/S quotients of Stanleya pinnata (P < 0·0001) or Astragalus racemosus (P < 0·0001) leaves belonged to the normal distribution of leaf Se/S quotients shown by the other 37 angiosperm species studied (Fig. 2; mean = 1·72 ± 0·04, s.d. = 0·237 ± 0·028, n = 37). These observations are consistent not only with the strong correlation between shoot Se and S concentrations amongst angiosperm species grown under the same conditions when the analysis is restricted to Se-non-accumulator crop plants (e.g. Hurd-Karrer, 1937; Bañuelos et al., 2005) but also with the lack of correlation between shoot Se and S concentrations when the analysis is broadened to include Se-accumulator plants (Rosenfeld and Beath, 1964; Feist and Parker, 2001). They indicate the occurrence of at least two distinct phenotypes for leaf Se/S quotient within the angiosperms. Interestingly, the mean leaf Se/S quotient for the 37 non-accumulator plants (1·72 mg Se g−1 S) approximated the Se/S quotient in the mineral nutrient solution (1·71 mg Se g−1 S), suggesting no selectivity in the accumulation of S over Se in leaves of most angiosperm species.
Fig. 3.
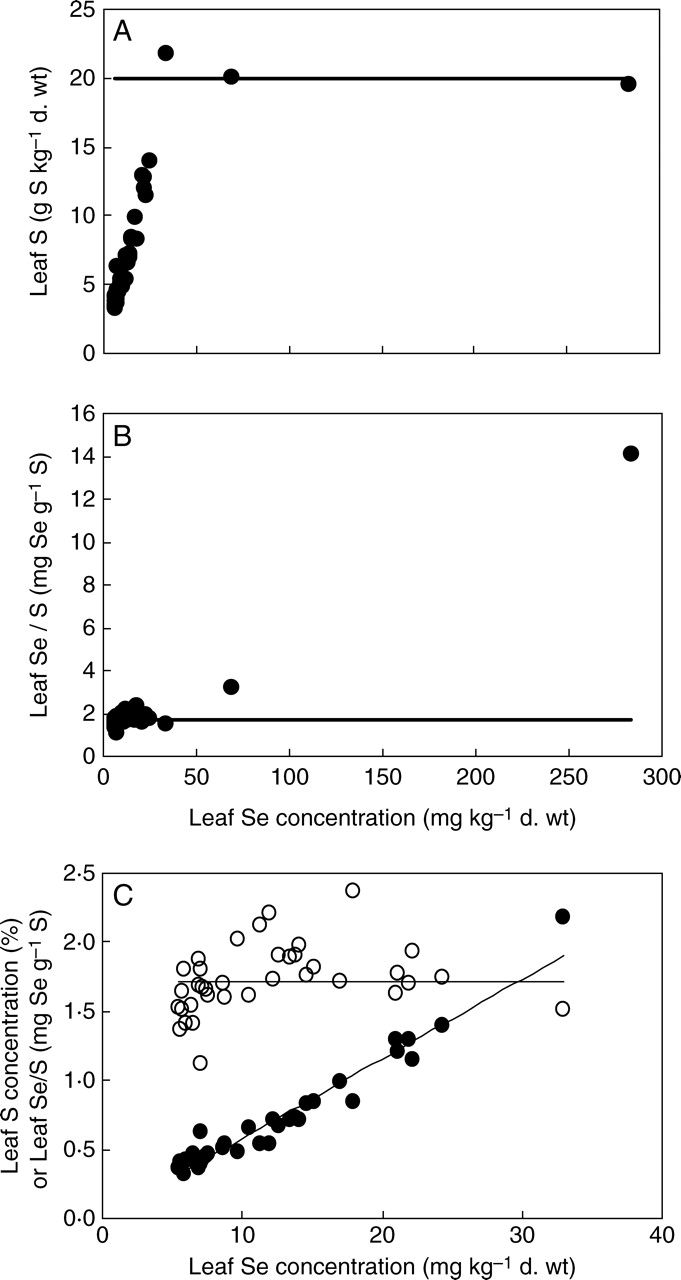
(A) The relationship between leaf Se concentration and leaf S concentration in 39 angiosperm species, including two species with extreme leaf Se concentration, grown hydroponically in a complete mineral nutrient solution containing 910 µm sulfate and 0·63 µm selenate. The line indicates a leaf S concentration of 20 g kg−1 d. wt. (B) The relationship between leaf Se concentration and leaf Se/S quotient in these 39 angiosperm species. The line indicates the Se/S in the nutrient solution supplied to the plants (1·71 mg S g−1 Se). (C) The relationships between leaf Se concentration and leaf S concentration (closed circles) or leaf Se/S quotient (open circles) in a subset of 37 of these species. The horizontal line indicates the Se/S quotient in the nutrient solution supplied to the plants. The sloping line indicates the regression between leaf Se concentration (mg kg−1 d. wt) and leaf S concentration (% d. wt) in these 37 species (y = 0·0567x + 0·053, R2 = 0·946).
It is noteworthy that all Brassicales species had high mean [Se]leaf and mean [S]leaf (Table 1), which is consistent with their unique S metabolism (Mengel and Kirkby, 2001; Willey and Wilkins, 2006) and extensive screens of angiosperms for phytoremediation of Se-laden soils, which have identified various Brassica species, such as Indian mustard (Brassica juncea), canola (B. napus) and broccoli (B. oleracea), as being particularly useful (Bañuelos et al., 1997, 2003, 2005; Terry et al., 2000; Wu, 2004; Bañuelos, 2002, 2006; Bañuelos and Lin, 2005). These species not only tolerate high tissue Se concentrations and accumulate biomass rapidly, but can also volatilize Se (Zayed et al., 1998; Terry et al., 2000; Bañuelos et al., 2005).
Ecological studies suggest that Se-accumulator plants include members of the Brassicaceae (Stanleya pinnata), Fabaceae (Astragalus bisulcatus, A. racemosus) and Asteraceae (Aster occidentalis, Machaeranthera ramosa). In the present study, Stanleya pinnata and Astragalus racemosus had significantly greater mean [Se]leaf, mean [S]leaf and leaf Se/S quotients than other angiosperms (Table 1). The mean [Se]leaf and leaf Se/S quotient were lower in Stanleya pinnata than in Astragalus racemosus, which is consistent with studies comparing the [Se]leaf of Stanleya pinnata with Astragalus species that hyperaccumulate Se (Goodson et al., 2003; Freeman et al., 2006; Galeas et al., 2007). Among the other Brassicaceae assayed, only Brassica oleracea had an abnormally high mean [Se]leaf and mean [S]leaf, but this species had a leaf Se/S quotient similar to that of other angiosperms (1·51 ± 0·014 mg Se g−1 S, n = 6). These traits are shared with other members of the Brassica genus that can accumulate high [Se]leaf and [S]leaf, but generally have leaf Se/S quotients lower than those in the rhizosphere solution (Bell et al., 1992; Feist and Parker, 2001; Ellis and Salt, 2003). This suggests that the trait of a high leaf Se/S quotient evolved within the Brassicaceae family. Neither Astragalus glycyphyllos nor A. sinicus had greater mean [Se]leaf, mean [S]leaf or leaf Se/S quotients than other angiosperms (Table 1). These observations are consistent with previous studies of Se accumulation in Astragalus species (Rosenfeld and Beath, 1964; Shrift, 1969; Davis, 1972, 1986; Sors et al., 2005a) and suggest that the trait of Se accumulation evolved independently within this genus also. Neither Aster occidentalis nor Machaeranthera ramosa were assayed in the present study, but neither Machaeranthera bigelovii nor Machaeranthera tanacetifolia showed abnormally high mean [Se]leaf, mean [S]leaf or leaf Se/S quotients. This suggests that the trait of Se accumulation evolved within the Machaeranthera genus and is consistent with previous observations (Rosenfeld and Beath, 1964). Taken together, these data support the hypothesis that the trait of Se accumulation evolved by convergent evolution of appropriate biochemical pathways in disparate angiosperm clades (Brown and Shrift, 1982).
It is most likely that the distinct leaf Se/S quotients found in Se-accumulator and non-accumulator plants result from differences in the selectivity of Se and S delivery to the xylem in the root (White et al., 2004; Sors et al., 2005b; Broadley et al., 2006), although selective redistribution of organic Se and S compounds from the shoot to the root via the phloem might also be envisaged (Bell et al., 1992). It is unlikely that the distinct leaf Se/S quotients of Se-accumulator and non-accumulator plants result from differences in Se volatilization given that, although species differ in their ability to volatilize both Se and S (Zayed et al., 1998; Terry et al., 2000; Bañuelos et al., 2005), even Indian mustard, which volatilizes more Se than most plants, volatilizes amounts equivalent to only about 2 % of the Se accumulated in shoots when grown hydroponically in a solution containing 20 µm Se (Terry et al., 2000). Assuming that Se and S move symplastically across the root and that selenate and sulfate are loaded into the xylem, then the leaf Se/S quotient can be influenced by the following processes of root cells: (1) selective uptake of selenate or sulfate across the plasma membrane, (2) selective metabolism of selenate or sulfate into other chemical forms, (3) selective sequestration of Se or S metabolites in the vacuole or (4) selective efflux of selenate or sulfate across the plasma membrane into the xylem. These processes can be differentiated on the basis of their predicted effects on root Se and S accumulation. Assuming that there is fixed Se:S stoichiometry for uptake across the plasma membrane, which reflects the Se/S quotient in the rhizosphere solution, an abnormally high Se/S quotient in roots of Se-accumulator plants would indicate that the selective uptake of selenate across the plasma membrane of root cells determined their high leaf Se/S quotient, whereas, if the Se/S quotient in roots of Se-accumulator plants was abnormally low, then the process impacting most on leaf Se/S quotient would not be the selective uptake of selenate by root cells. As the Se/S quotients in roots of Se-accumulator plants are not abnormally low, and the percentage translocation of Se and S from roots to shoots appears to be similar across taxa (Bell et al., 1992), it can be concluded that differences in the selectivity of uptake of selenate and sulfate underlie differences in the leaf Se/S quotient of Se-accumulator and non-accumulator plants. This conclusion is consistent with the hypothesis that the dominant HASTs of Se-accumulator plants are selective for selenate, whereas those in other angiosperm species are selective for sulfate (White et al., 2004; Sors et al., 2005b; Broadley et al., 2006). A comparison of the protein structure of HASTs present in the plasma membrane of epidermal and/or cortical root cells of Se-accumulator and non-accumulator plants would allow the molecular basis of anion selectivity of HASTs to be determined. Thereafter, appropriate allelic variation in the domain(s) conferring selenate/sulfate selectivity, combined with transcriptional control of HAST expression, could be used to produce crops with increased [Se]shoot and leaf Se/S quotients through either conventional or genetic modification approaches.
ACKNOWLEDGEMENTS
This work was supported by the UK Biotechnology and Biological Sciences Research Council (BBSRC), the Scottish Executive Environment and Rural Affairs Department (SEERAD) and Yara (UK).
LITERATURE CITED
- Bañuelos GS. Bioremediation and biodegradation. Journal of Environmental Quality. 2002;31:1802–1808. doi: 10.2134/jeq2002.1802. [DOI] [PubMed] [Google Scholar]
- Bañuelos GS. Phyto-products may be essential for sustainability and implementation of phytoremediation. Environmental Pollution. 2006;144:19–23. doi: 10.1016/j.envpol.2006.01.015. [DOI] [PubMed] [Google Scholar]
- Bañuelos GS, Lin ZQ. Phytoremediation management of selenium-laden drainage sediments in the San Luis Drain: a greenhouse feasibility study. Ecotoxicology and Environmental Safety. 2005;62:309–316. doi: 10.1016/j.ecoenv.2004.10.013. [DOI] [PubMed] [Google Scholar]
- Bañuelos GS, Ajwa HA, Wu L, Guo X, Akohoue S, Zambrzuski S. Selenium-induced growth reduction in Brassica land races considered for phytoremediation. Ecotoxicology and Environmental Safety. 1997;36:282–287. doi: 10.1006/eesa.1996.1517. [DOI] [PubMed] [Google Scholar]
- Bañuelos GS, Pasakdee S, Finley JW. Growth response and selenium and boron distribution in broccoli varieties irrigated with poor quality water. Journal of Plant Nutrition. 2003;26:2537–2549. [Google Scholar]
- Bañuelos GS, Lin ZQ, Arroyo I, Terry N. Selenium volatilization in vegetated agricultural drainage sediment from the San Luis Drain, Central California. Chemosphere. 2005;60:1203–1213. doi: 10.1016/j.chemosphere.2005.02.033. [DOI] [PubMed] [Google Scholar]
- Barak P, Goldman IL. Antagonistic relationship between selenate and sulfate uptake in onion (Allium cepa): implications for the production of organosulfur and organoselenium compounds in plants. Journal of Agricultural and Food Chemistry. 1997;45:1290–1294. [Google Scholar]
- Bell PF, Parker DR, Page AL. Contrasting selenate–sulfate interactions in selenium-accumulating and nonaccumulating plant species. Soil Science Society of America Journal. 1992;56:1818–1824. [Google Scholar]
- Broadley MR, Bowen HC, Cotterill HL, Hammond JP, Meacham MC, Mead A, White PJ. Variation in the shoot calcium content of angiosperms. Journal of Experimental Botany. 2003;54:1431–1446. doi: 10.1093/jxb/erg143. [DOI] [PubMed] [Google Scholar]
- Broadley MR, Bowen HC, Cotterill HL, Hammond JP, Meacham MC, Mead A, White PJ. Phylogenetic variation in the shoot mineral concentration of angiosperms. Journal of Experimental Botany. 2004;55:321–336. doi: 10.1093/jxb/erh002. [DOI] [PubMed] [Google Scholar]
- Broadley MR, White PJ, Bryson RJ, Meacham MC, Bowen HC, Johnson SE, et al. Biofortification of UK food crops with selenium. Proceedings of the Nutrition Society. 2006;65:169–181. doi: 10.1079/pns2006490. [DOI] [PubMed] [Google Scholar]
- Brown TA, Shrift A. Selenium: toxicity and tolerance in higher plants. Biological Reviews. 1982;57:59–84. [Google Scholar]
- Davis AM. Selenium accumulation in Astragalus species. Agronomy Journal. 1972;64:751–754. [Google Scholar]
- Davis AM. Selenium uptake in Astragalus and Lupinus species. Agronomy Journal. 1986;78:727–729. [Google Scholar]
- Dhillon KS, Dhillon SK. Distribution and management of seleniferous soils. Advances in Agronomy. 2003;79:119–184. [Google Scholar]
- Ellis DR, Salt DE. Plants, selenium and human health. Current Opinion in Plant Biology. 2003;6:273–279. doi: 10.1016/s1369-5266(03)00030-x. [DOI] [PubMed] [Google Scholar]
- Feist LJ, Parker DR. Ecotypic variation in selenium accumulation among populations of Stanleya pinnata. New Phytologist. 2001;149:61–69. doi: 10.1046/j.1469-8137.2001.00004.x. [DOI] [PubMed] [Google Scholar]
- Freeman JL, Zhang LH, Marcus MA, Fakra S, McGrath SP, Pilon-Smits EAH. Spatial imaging, speciation, and quantification of selenium in the hyperaccumulator plants Astragalus bisulcatus and Stanleya pinnata. Plant Physiology. 2006;142:124–134. doi: 10.1104/pp.106.081158. [DOI] [PMC free article] [PubMed] [Google Scholar]
- Galeas ML, Zhang LH, Freeman JL, Wegner M, Pilon-Smits EAH. Seasonal fluctuations of selenium and sulfur accumulation in selenium hyperaccumulators and related nonaccumulators. New Phytologist. 2007;173:517–525. doi: 10.1111/j.1469-8137.2006.01943.x. [DOI] [PubMed] [Google Scholar]
- Goodson CC, Parker DR, Amrhein C, Zhang Y. Soil selenium uptake and root system development in plant taxa differing in Se-accumulating capability. New Phytologist. 2003;159:391–401. doi: 10.1046/j.1469-8137.2003.00781.x. [DOI] [PubMed] [Google Scholar]
- Grieve CM, Poss JA, Suarez DL, Dierig DA. Lesquerella growth and selenium uptake affected by saline irrigation water composition. Industrial Crops and Products. 2001;13:57–65. [Google Scholar]
- Hawkesford MJ. Sulphur. In: Broadley MR, White PJ, editors. Plant nutritional genomics. Oxford: Blackwell; 2005. pp. 87–111. [Google Scholar]
- Hawkesford MJ, De Kok LJ. Managing sulphur metabolism in plants. Plant Cell and Environment. 2006;29:382–395. doi: 10.1111/j.1365-3040.2005.01470.x. [DOI] [PubMed] [Google Scholar]
- Hurd-Karrer AM. Selenium absorption by crop plants as related to their sulphur requirement. Journal of Agricultural Research. 1937;54:601–608. [Google Scholar]
- Kopsell DA, Randle WM. Short-day onion cultivars differ in bulb selenium and sulfur accumulation which can affect bulb pungency. Euphytica. 1997;96:385–390. [Google Scholar]
- Kopsell DA, Randle WM. Selenium accumulation in a rapid-cycling Brassica oleracea population responds to increasing sodium selenate concentrations. Journal of Plant Nutrition. 1999;22:927–937. [Google Scholar]
- Lyons G, Ortiz-Monasterio I, Stangoulis J, Graham R. Selenium concentration in wheat grain: is there sufficient genotypic variation to use in breeding? Plant and Soil. 2005;269:269–380. [Google Scholar]
- Mengel K, Kirkby EA. Principles of plant nutrition. 5th edn. Dordrecht: Kluwer; 2001. [Google Scholar]
- Michael JR. The stabilized probability plot. Biometrika. 1983;70:11–17. [Google Scholar]
- Moreno Rodriguez MJ, Cala Rivero V, Jiménez Ballesta R. Selenium distribution in topsoils and plants of a semi-arid Mediterranean environment. Environmental Geochemistry and Health. 2005;27:513–519. doi: 10.1007/s10653-005-8625-9. [DOI] [PubMed] [Google Scholar]
- Pezzarossa B, Piccotino D, Shennan C, Malorgio F. Uptake and distribution of selenium in tomato plants as affected by genotype and sulphate supply. Journal of Plant Nutrition. 1999;22:1613–1635. [Google Scholar]
- Rosenfeld I, Beath OA. Selenium: geobotany, biochemistry, toxicity, and nutrition. New York: Academic Press; 1964. [Google Scholar]
- Shrift A. Aspects of selenium metabolism in higher plants. Annual Review of Plant Physiology. 1969;20:475–494. [Google Scholar]
- Sors TG, Ellis DR, Na GN, Lahner B, Lee S, Leustek T, et al. Analysis of sulfur and selenium assimilation in Astragalus plants with varying capacities to accumulate selenium. Plant Journal. 2005a;42:785–797. doi: 10.1111/j.1365-313X.2005.02413.x. [DOI] [PubMed] [Google Scholar]
- Sors TG, Ellis DR, Salt DE. Selenium uptake, translocation, assimilation and metabolic fate in plants. Photosynthesis Research. 2005b;86:373–389. doi: 10.1007/s11120-005-5222-9. [DOI] [PubMed] [Google Scholar]
- Suarez DL, Grieve CM, Poss JA. Irrigation method affects selenium accumulation in forage Brassica species. Journal of Plant Nutrition. 2003;26:191–201. [Google Scholar]
- Terry N, Zayed AM, de Souza MP, Tarun AS. Selenium in higher plants. Annual Review of Plant Physiology and Plant Molecular Biology. 2000;51:401–432. doi: 10.1146/annurev.arplant.51.1.401. [DOI] [PubMed] [Google Scholar]
- White PJ. The pathways of calcium movement to the xylem. Journal of Experimental Botany. 2001;52:891–899. doi: 10.1093/jexbot/52.358.891. [DOI] [PubMed] [Google Scholar]
- White PJ, Broadley MR. Calcium in plants. Annals of Botany. 2003;92:487–511. doi: 10.1093/aob/mcg164. [DOI] [PMC free article] [PubMed] [Google Scholar]
- White PJ, Bowen HC, Parmaguru P, Fritz M, Spracklen WP, Spiby RE, et al. Interactions between selenium and sulphur nutrition in Arabidopsis thaliana. Journal of Experimental Botany. 2004;55:1927–1937. doi: 10.1093/jxb/erh192. [DOI] [PubMed] [Google Scholar]
- White PJ, Broadley MR, Bowen HC, Johnson SE. Selenium and its relationship with sulfur. In: Hawkesford MJ, de Kok LJ, editors. Sulfur in plants – an ecological perspective. Dordrecht: Springer; 2007. pp. 225–252. [Google Scholar]
- Willey N, Wilkins J. An analysis of intertaxa differences in sulfur concentration in angiosperms. Journal of Plant Nutrition and Soil Science. 2006;169:717–727. [Google Scholar]
- Wu L. Review of 15 years of research on ecotoxicology and remediation of land contaminated by agricultural drainage sediment rich in selenium. Ecotoxicology and Environmental Safety. 2004;57:257–269. doi: 10.1016/S0147-6513(03)00064-2. [DOI] [PubMed] [Google Scholar]
- Zayed A, Lytle CM, Terry N. Accumulation and volatilization of different chemical species of selenium by plants. Planta. 1998;206:284–292. [Google Scholar]
- Zhang LH, Abdel-Ghany SE, Freeman JL, Ackley AR, Schiavon M, Pilon-Smits EAH. Investigation of selenium tolerance mechanisms in Arabidopsis thaliana. Physiologia Plantarum. 2006a;128:212–223. [Google Scholar]
- Zhang LH, Byrne PF, Pilon-Smits EAH. Mapping quantitative trait loci associated with selenate tolerance in Arabidopsis thaliana. New Phytologist. 2006b;170:33–42. doi: 10.1111/j.1469-8137.2006.01635.x. [DOI] [PubMed] [Google Scholar]