Abstract
Purpose: To determine the neuropathologic correlates of antemortem hydrogen 1 (1H) magnetic resonance (MR) spectroscopy metabolite measurements in subjects with Alzheimer disease (AD)-type pathology.
Materials and Methods: This study was approved by the institutional review board and was compliant with HIPAA regulations. Informed consent was obtained from each subject. The authors identified 54 subjects who underwent antemortem 1H MR spectroscopy and were clinically healthy or had AD-type pathology with low to high likelihood of AD according to National Institute on Aging–Reagan neuropathologic criteria at autopsy. They investigated the associations between 1H MR spectroscopy metabolite measurements and Braak neurofibrillary tangle stage (Braak stage), neuritic plaque score, and AD likelihood, with adjustments for subject age, subject sex, and time between 1H MR spectroscopy and death.
Results: Decreases in N-acetylaspartate–to-creatine ratio, an index of neuronal integrity, and increases in myo-inositol–to-creatine ratio were associated with higher Braak stage, higher neuritic plaque score, and greater likelihood of AD. The N-acetylaspartate–to–myo-inositol ratio proved to be the strongest predictor of the pathologic likelihood of AD. The strongest association observed was that between N-acetylaspartate–to–myo-inositol ratio and Braak stage (RN2 = 0.47, P < .001).
Conclusion: Antemortem 1H MR spectroscopy metabolite changes correlated with AD-type pathology seen at autopsy. The study findings validated 1H MR spectroscopy metabolite measurements against the neuropathologic criteria for AD, and when combined with prior longitudinal 1H MR spectroscopy findings, indicate that these measurements could be used as biomarkers for disease progression in clinical trials.
© RSNA, 2008
Keywords: AD = Alzheimer disease, CERAD = Consortium to Establish a Registry of AD, Cho = choline, CI = confidence interval, Cr = creatine, MCI = mild cognitive impairment, mI = myo-inositol, NAA = N-acetylaspartate, NFT = neurofibrillary tangle, NIA = National Institute on Aging
Current research momentum to develop treatments for the abnormalities associated with Alzheimer disease (AD) has prompted the need for noninvasive biologic markers that reflect therapeutic effectiveness. Neuropsychologic measures of cognitive function are used to monitor symptomatic progression, yet monitoring of biologic progression is possible only with use of those markers closely related to the AD-type pathology. For this reason, histopathologic findings are considered the reference standard for validating the imaging markers used to diagnose and monitor disease progression in AD (1).
Hydrogen 1 (1H) magnetic resonance (MR) spectroscopy is a quantitative biochemical imaging technique and follows structural MR imaging as one of the most extensively investigated MR modalities used to assess AD (2). 1H MR spectroscopy has revealed that the concentration of the neuronal metabolite N-acetylaspartate (NAA) and the ratio of NAA to the reference metabolite creatine (Cr) are decreased and that the metabolite myo-inositol (mI) and the mI/Cr ratio are increased in patients who have AD and mild cognitive impairment (MCI), many of whom have prodromal AD (3–15). Among these measurements, the NAA/mI ratio has enabled the differentiation of patients with AD from cognitively healthy individuals with the highest sensitivity (82%–83%) and specificity (80%–95%) based on the clinical diagnosis (16,17).
In longitudinal cohort studies, decreases in NAA levels and NAA/Cr ratios have predicted future progression to AD in patients with amnestic MCI (18–23). For this reason, 1H MR spectroscopy findings have been promising imaging markers for early diagnosis, monitoring of disease progression, and assessing treatment response in therapeutic trials. In a study by Klunk and co-workers (4), postmortem 1H MR spectroscopy analyses of perchloric acid extracts from the brains of individuals with AD revealed correlations between 1H MR spectroscopy metabolites and the density of neurofibrillary tangles (NFTs) and senile plaques in the tissues. Investigations of in vivo 1H MR spectroscopy findings as markers of the severity and progression of AD, however, have been limited to clinically confirmed cohort studies and have not yet been subjected to pathologic validation.
We monitored the findings in a cohort of elderly subjects with a status of cognitively healthy, amnestic MCI, or dementia who underwent 1H MR spectroscopy and agreed to have their body examined at autopsy. The objective of our study was to determine the neuropathologic correlates of antemortem 1H MR spectroscopy metabolite measurements in subjects with AD-type pathology.
MATERIALS AND METHODS
Clinical Evaluation and Inclusion and Exclusion Criteria
This study was approved by the institutional review board of Mayo Clinic and was compliant with Health Insurance Portability and Accountability Act regulations. Informed consent was obtained from each subject. The included subjects were recruited from the Mayo Clinic XX AD Research Center (dementia clinic cohort) and the Mayo Clinic AD Patient Registry (community clinic cohort). We identified 54 subjects whose bodies were examined at autopsy, with the final neuropathologic diagnoses ranging from cognitively normal to high likelihood of AD, and who had undergone 1H MR spectroscopy up to 48.8 months before death. Individuals who participate in the XX AD Research Center and AD Patient Registry studies undergo clinical examination, brain MR, 1H MR spectroscopy, routine laboratory tests, and a battery of neuropsychologic tests approximately once annually (24).
To be included in this study, the subjects could have a range of AD-type pathologies but no other substantial disease process. Subjects with structural abnormalities that could produce dementia, such as cortical infarction, tumor, or subdural hematoma, or who had undergone treatment or had a concurrent illness other than dementia that interfered with cognitive function at the time of 1H MR spectroscopy were excluded. The presence of Lewy bodies was not an exclusion criterion when the primary pathologic diagnosis was AD (25), because Lewy bodies are common in individuals with AD (26) and we believed that excluding these subjects probably would affect the representativeness of the AD subject sample. We also included patients with leukoaraiosis and lacunar infarction. All subjects who met these criteria were included in the study.
The subjects' apolipoprotein E genotype was determined by using established polymerase chain reaction techniques. Participants with apolipoprotein E genotypes ε2ε4, ε3ε4, and ε4ε4 were assigned to the ε4+ group; the others were assigned to the ε4− group. The clinical diagnosis of AD was made during a consensus conference involving neurologists (D.S.K., B.F.B., R.C.P., K.A.J.), neuropsychologists, nurses, and a geriatrician according to the criteria for dementia cited in the revised third edition of the Diagnostic and Statistical Manual of Mental Disorders (27) and the criteria for AD of the National Institute of Neurological and Communicative Disorders and the Stroke/Alzheimer Disease and Related Disorders Association (28). The clinical diagnosis of amnestic MCI was made according to the criteria of Petersen (29). It is important to note that clinical criteria were not used to include or exclude subjects in this study. Subject inclusion and exclusion were based solely on the pathologic findings outlined earlier.
MR Imaging and 1H MR Spectroscopy Examinations
All subjects underwent MR imaging and 1H MR spectroscopy within 90 days (before or after) of the clinical evaluation. The median time from 1H MR spectroscopy to death was 24 months (range, 1.0–48.8 months) before autopsy. MR imaging and single-voxel 1H MR spectroscopy were performed by using a 1.5-T MR unit (Signa; GE Medical Systems, Milwaukee, Wis). Sagittal T1-weighted MR images were obtained to localize the 1H MR spectroscopy voxel. The 1H MR spectroscopy examinations were performed by using an automated single-voxel MR spectroscopy package (Proton Brain Examination/Single Voxel; GE Medical Systems) (30). A point-resolved spectroscopy pulse sequence (2000/30 [repetition time msec/echo time msec], 2048 data points, 128 signals acquired) was used to perform these examinations.
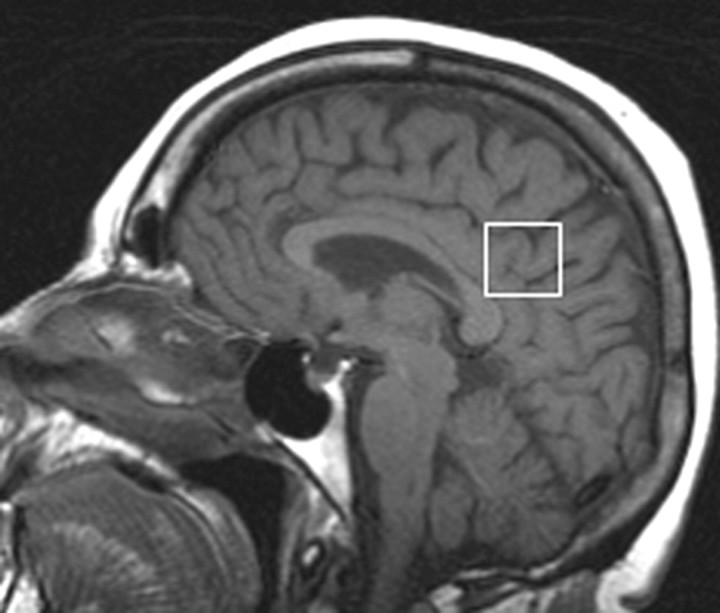
An 8-cm3 (2 × 2 × 2 cm) voxel prescribed on a midsagittal T1-weighted image included the right and left posterior cingulate gyri and the inferior precuneate gyri (Fig 1). This voxel location was chosen for biologic and technical reasons: From a biologic standpoint, there is evidence from MR imaging, fluorine 18 (18F) fluorodeoxyglucose positron emission tomography (PET), amyloid ligand PET, and functional MR imaging studies that this region is involved in atrophy, decreased metabolism, amyloid deposition, and deactivation early in the course of AD (31–34). From a technical standpoint, the quality and reliability of 1H MR spectra from this voxel location are superior to those of spectra from the medial temporal lobe owing to the close proximity of the medial temporal lobe to the magnetic susceptibility artifacts at the skull base.
Figure 1:
Location of 1H MR spectroscopy voxel. The 1H MR spectroscopy voxel was placed on a midsagittal T1-weighted localizer image (700/14). The anterior border of the splenium, superior border of the corpus callosum, and cingulate sulcus were the anatomic landmarks used to define the anteroinferior and anterosuperior borders of the 8-cm3 voxel. This voxel partially included the right and left posterior cingulate gyri and the inferior precuneate gyri (portions of Brodmann areas 23 and 31) in both hemispheres.
Because brain Cr levels are repeatedly found to be normal in patients with AD (7,8,16,35–38), Cr concentration has been the internal standard of choice in clinical 1H MR spectroscopy studies of AD. We analyzed the metabolite intensity ratios, which were calculated at the end of each 1H spectroscopy brain examination by using Cr concentration as the internal reference metabolite. The analyses of the 1H MR spectra were fully automated and did not require manual input.
Autopsy Procedure and Neuropathologic Assessment
The brains were processed at autopsy according to the protocol of the XX AD Research Center Neuropathology Core. After external examination of the fresh brain specimen, the brain was divided by means of a sagittal cut that divided the right and left brain hemispheres. One hemisphere—usually the left—was fixed in 10%–15% buffered formalin for 7–10 days, coronally sliced into 1-cm sections, and then photographed. Sampling was performed according to the Consortium to Establish a Registry of AD (CERAD) protocol (39). Pathologic diagnoses were made by one or both neuropathologists (J.E.P., D.W.D.), who were blinded to the clinical and imaging data.
Each subject was assigned a Braak NFT stage (40): At stage I the NFT was confined to the transentorhinal cortex (layer 4), at stage II the NFT was in the entorhinal cortex (layer 2), at stage III the NFT was in the hippocampus (cornu ammonis and subiculum), at stage IV the NFT was in the temporal lobe association neocortex, at stage V the NFT was in the temporal, frontal, or parietal association neocortex, and at stage VI the NFT was in the primary visual cortex. The Braak stage was determined on the basis of any evidence of NFTs in a given area, which indicated the earliest and most minimal involvement.
Each subject was also assigned a neuritic plaque score according to the CERAD protocol on the basis of the most affected region (39). Neuritic plaques were identified according to the presence of dystrophic neurites arranged radially to form a discrete spherical lesion with an average diameter of approximately 30 μm. To ensure uniformity in estimates between the evaluators, the following guidelines were applied: Neuritic plaques were considered to be sparse when one to five plaques per ×100 magnetic field were seen, moderate when six to 19 plaques per ×100 field were seen, and frequent when 20 or more plaques per ×100 field were seen.
The pathologic diagnosis of AD was made according to the National Institute on Aging (NIA)-Reagan Institute Working Group criteria (41). On the basis of the topographic distribution of NFTs (ie, Braak NFT stage) and the density of the neuritic plaques (ie, CERAD neuritic plaque score), the likelihood of the subject having AD was judged to be low, intermediate, or high. The presence of Lewy bodies in the brainstem, limbic cortex, and/or neocortex was assessed with α-synuclein immunostaining according to criteria established by the Consortium for Dementia with Lewy Bodies (42).
Statistical Analyses
The subjects were grouped according to the pathologic diagnosis based on the NIA-Reagan criteria, Braak NFT stage, and CERAD neuritic plaque score. We compared groups according to categorical patient characteristics by using the Fisher exact test. We used Kruskal-Wallis tests to compare groups according to education level and cognitive test results because of the skewness of these variables. One-way analysis of variance was used to test for group differences in age at MR spectroscopy and in time from MR spectroscopy to death. We used two complementary approaches to analyze the metabolite ratio data. With the first approach, we estimated differences in metabolite ratios according to neuropathology classification by using analysis of covariance (ANCOVA), in which metabolite ratio was the response, neuropathology group was the predictor, and age at imaging, subject sex, and time from imaging examination to death were adjustment covariates. Pairwise comparisons between neuropathology groups were performed by using contrasts from the ANCOVA models using t tests.
With the second approach, we used the proportional odds ordinal logistic regression model (Appendix) to estimate the effect of metabolite ratio on the odds of the subject having a more advanced abnormality. In this model, the dependent variable was neuropathology group and the predictors were metabolite ratio, age at imaging, sex, and time from imaging examination to death. We did not adjust for multiple comparisons because the described statistical tests address issues of distinct—albeit related—clinical interest. However, we report P values to several significant digits so that the reader can perform a Bonferroni-type adjustment if he or she wishes (43,44). R, version 2.5.1, software (R Foundation for Statistical Computing, Vienna, Austria) was used to perform all statistical analyses.
RESULTS
1H MR Spectroscopy Metabolites and Likelihood of AD
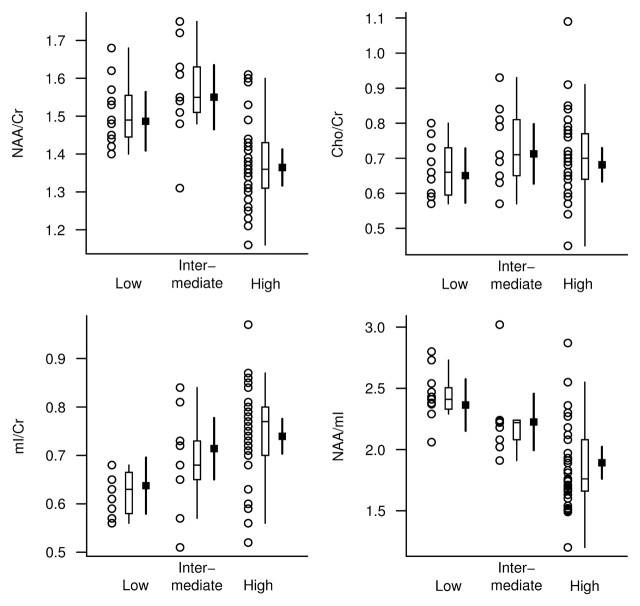
The NAA/Cr, mI/Cr, and NAA/mI metabolite ratios differed between the low-, intermediate-, and high-likelihood groups based on NIA-Reagan criteria after we adjusted the data for age, sex, and time from MR spectroscopy to death. Choline (Cho)-to-Cr ratios were not significantly different between the groups (Table 1). At pairwise t testing based on ANCOVA models, we observed significant differences in the NAA/Cr, mI/Cr, and NAA/mI ratios between the high- and low-likelihood groups (P < .002). Although NAA/Cr and NAA/mI ratios in the intermediate- and low-likelihood groups were similar, they were different between the intermediate- and high-likelihood groups (P < .01). On the other hand, the mI/Cr ratios in the intermediate- and high-likelihood groups were similar, but they were different between the intermediate- and low-likelihood groups (P = .05) (Fig 2).
Table 1.
Clinical, MR Spectroscopy, and Demographic Characteristics in AD Likelihood Groups
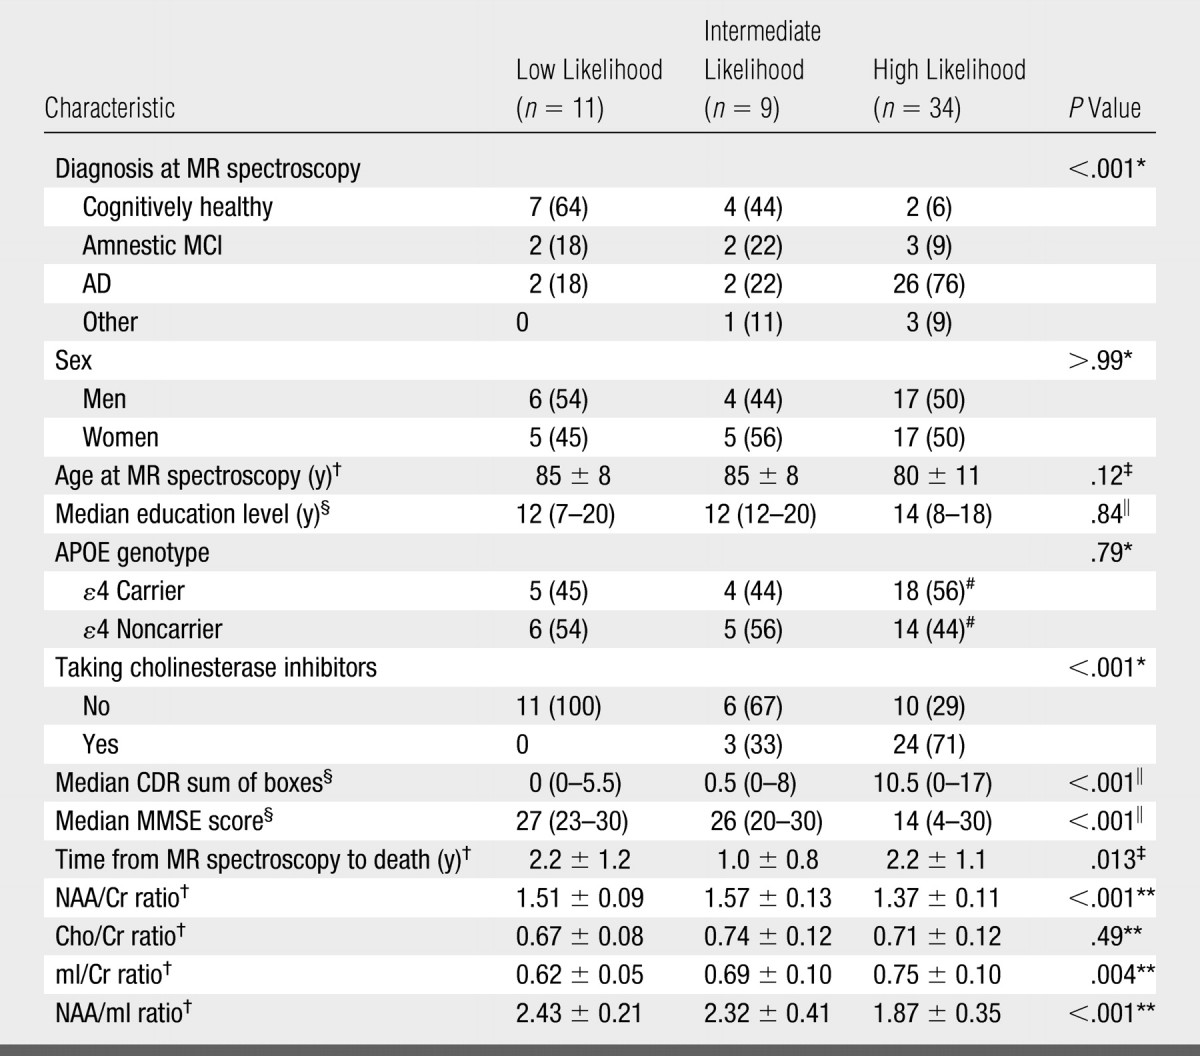
Note.—Unless otherwise noted, data are numbers of patients grouped according to low, intermediate, or high likelihood of AD based on NIA-Reagan criteria, with percentages in parentheses. APOE = apolipoprotein E, CDR = clinical dementia rating, MMSE = Mini-Mental State Examination.
Calculated by using Fisher exact test.
Mean value ± standard deviation.
Calculated by using one-way analysis of variance.
Median value, with range in parentheses.
Calculated by using Kruskal-Wallis test.
Percentages are based on group total of 32 patients.
Calculated by using ANCOVA.
Figure 2:
1H MR spectroscopic metabolite ratios plotted according to pathologic diagnosis of AD likelihood (horizontal axis) based on NIA-Reagan criteria. For each AD likelihood diagnosis, individual values, a box plot of the distribution, and the estimated mean and 95% confidence interval (CI, darker lines) for the mean are shown. The mean and CI were derived from ANCOVA models and are assumed for a 78-year-old woman in whom the interval from 1H MR spectroscopy to death is 2 years.
Because eight of the 34 subjects with a high likelihood of AD also had Lewy bodies, we compared the metabolite ratios between patients who had coexisting Lewy body disease and those who had purely AD-type pathology. We observed no significant difference in metabolite ratios (P > .1, Wilcoxon rank sum tests), which indicated that the presence of Lewy body disease does not have a significant effect on metabolite measurements in patients with AD.
After adjusting the data for age, sex, and time from 1H MR spectroscopy to death, we observed a significant association between pathologic likelihood of AD and the NAA/Cr, mI/Cr, and NAA/mI ratios. The strongest association was that between pathologic likelihood of AD and NAA/mI ratio (RN2 = 0.40). With a decrease in NAA/mI ratio from the 75th to 25th percentile of the distribution, the relative ratio for the odds of having a higher pathologic likelihood of AD was 8.63 (95% CI: 2.54, 29.30) (Table 2).
Table 2.
Effect of Metabolite Ratios on Odds of Subject Having More versus Less Advanced Abnormality
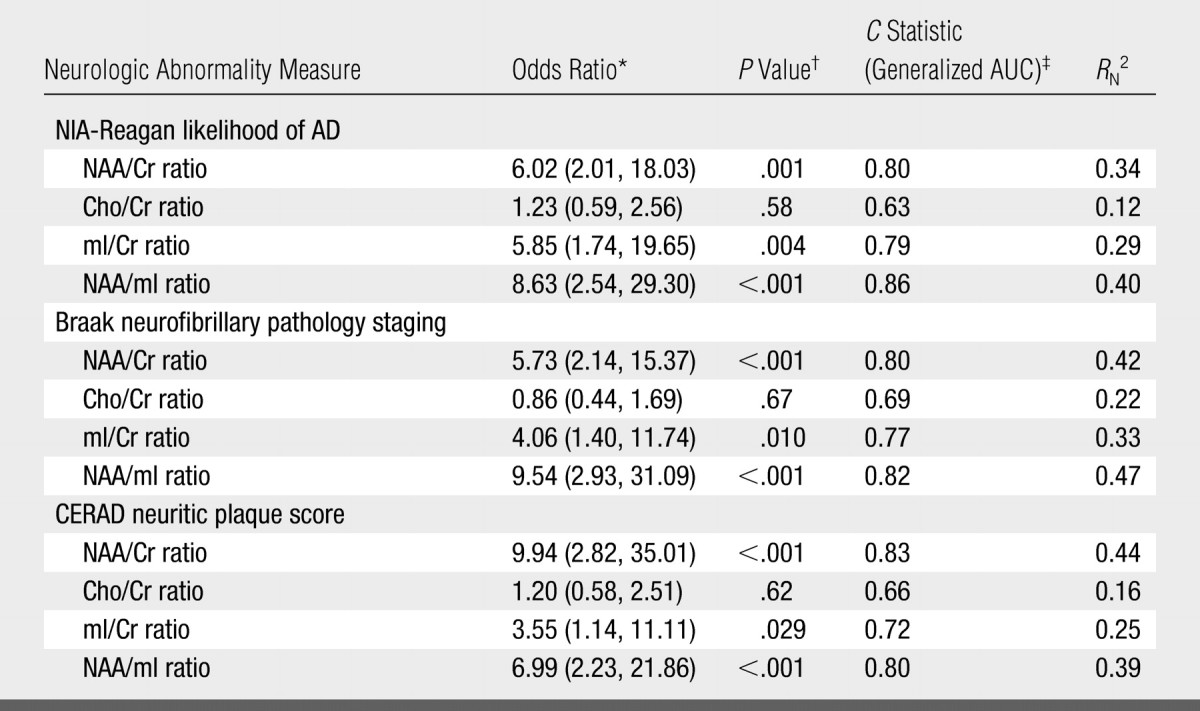
Note.— Data are values for the associations of the four metabolite ratios with NIA-Reagan–based likelihood of AD, Braak NFT stage, and CERAD-based neuritic plaque score.
NAA/Cr and NAA/mI comparisons are for persons at the 25th versus 75th percentile of the MR spectroscopy measure. Cho/Cr and mI/Cr comparisons are for persons at the 75th versus 25th percentile of the MR spectroscopy measure. Numbers in parentheses are 95% CIs.
P values calculated by using Wald test.
AUC = area under receiver operating characteristic curve.
1H MR Spectroscopy Metabolites and NFTs
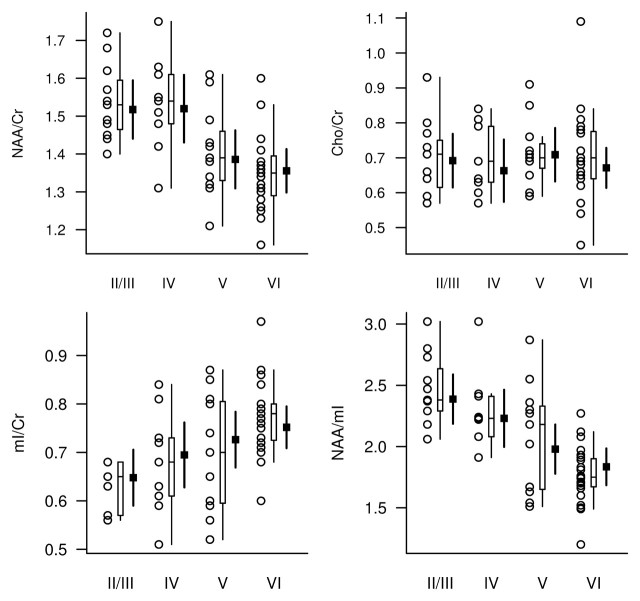
Because only two subjects had Braak NFT stage II abnormalities, for analysis these individuals were grouped with subjects who had stage III abnormalities. The NAA/Cr, mI/Cr, and NAA/mI metabolite ratios differed between Braak NFT stages, while Cho/Cr ratios were not significantly different between stages after adjustments for age, sex, and time from MR spectroscopy to death (Table 3, Fig 3).
Table 3.
Clinical, MR Spectroscopy, and Demographic Characteristics in NFT Stage Groups
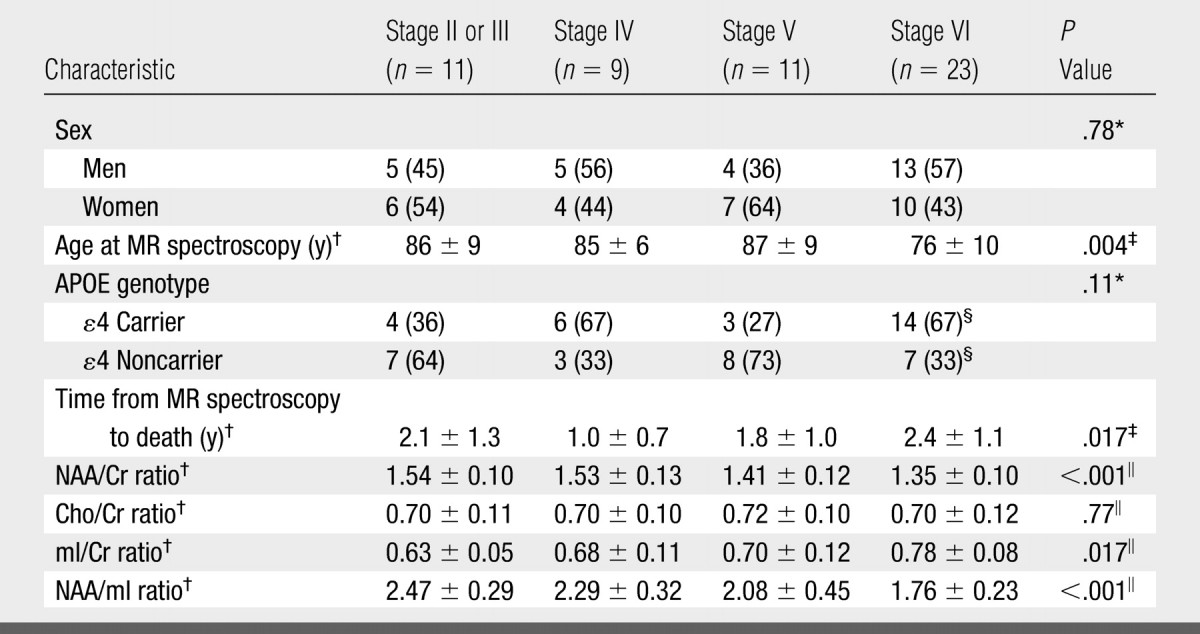
Note.—Unless otherwise noted, data are numbers of patients grouped according to Braak NFT stage, with percentages in parentheses. APOE = apolipoprotein E.
Calculated by using Fisher exact test.
Mean value ± standard deviation.
Calculated by using one-way analysis of variance.
Percentages are based on group total of 21 patients.
Calculated by using ANCOVA.
Figure 3:
1H MR spectroscopic metabolite ratios plotted according to Braak NFT stage (horizontal axis). For each Braak NFT stage diagnosis, individual values, a box plot of the distribution, and the estimated mean and 95% CI (darker lines) for the mean are shown. The mean and CI were derived from ANCOVA models and are assumed for a 78-year-old woman in whom the interval from 1H MR spectroscopy to death is 2 years.
After adjusting the data for age, sex, and time from 1H MR spectroscopy to death, we observed a significant association between Braak NFT stage and the NAA/Cr, mI/Cr, and NAA/mI ratios. The strongest association was that between Braak NFT stage and NAA/mI ratio (RN2 = 0.47). With a decrease in NAA/mI ratio from the 75th to 25th percentile of the distribution, the relative ratio for the odds of having a higher Braak NFT stage was 9.54 (95% CI: 2.93, 31.09) (Table 2).
1H MR Spectroscopy Metabolites and Neuritic Plaques
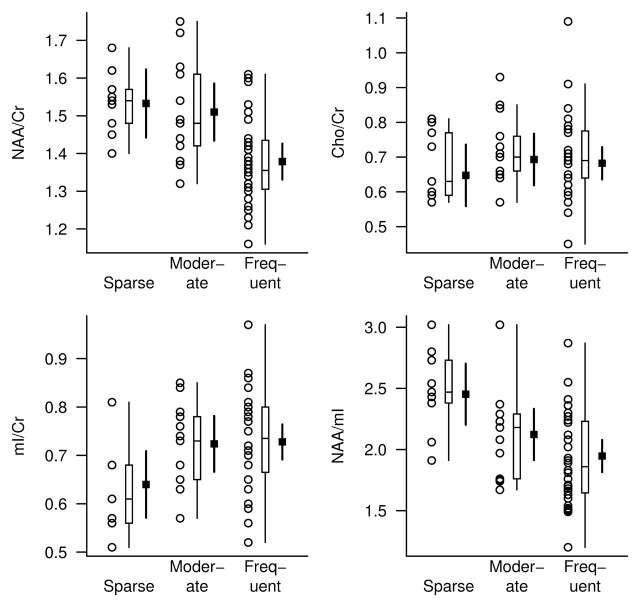
The NAA/Cr, mI/Cr, and NAA/mI metabolite ratios differed between the neuritic plaque groups, but Cho/Cr ratios were not significantly different after adjustments for age, sex, and time from MR spectroscopy to death (Table 4). At pairwise t testing based on ANCOVA models, we observed significant differences in the NAA/Cr, mI/Cr, and NAA/mI ratios between the subjects with frequent plaques and those with sparse plaques (P < .01), as well as differences in NAA/Cr ratio between the subjects with frequent plaques and those with moderate plaques (P = .001). Although mI/Cr and NAA/mI ratios were different between the moderate and sparse plaque groups (P < .03), NAA/Cr ratios were not (Fig 4).
Table 4.
Clinical, MR Spectroscopy, and Demographic Characteristics in CERAD-based Neuritic Plaque Groups
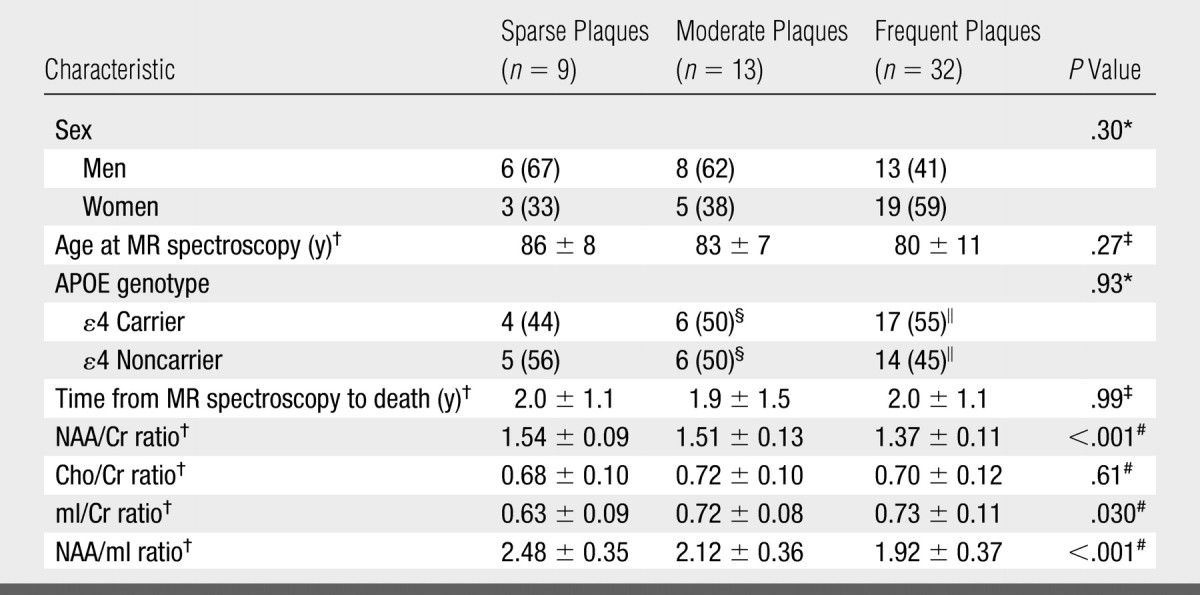
Note.—Unless otherwise noted, data are numbers of patients grouped according to neuritic plaque density, with percentages in parentheses. APOE = apolipoprotein E.
Calculated by using Fisher exact test.
Mean value ± standard deviation.
Calculated by using one-way analysis of variance.
Percentages are based on group total of 12 patients.
Percentages are based on group total of 31 patients.
Calculated by using ANCOVA.
Figure 4:
1H MR spectroscopic metabolite ratios plotted according to CERAD-based neuritic plaque score (horizontal axis). For each neuritic plaque score diagnosis, individual values, a box plot of the distribution, and the estimated mean and 95% CI (darker lines) for the mean are shown. The mean and CI were derived from ANCOVA models and are assumed for a 78-year-old woman in whom the interval from 1H MR spectroscopy to death is 2 years.
After adjusting the data for age, sex, and time from 1H MR spectroscopy to death, we observed a significant association between neuritic plaque score and the NAA/Cr, mI/Cr, and NAA/mI ratios. The strongest association was that observed between neuritic plaque score and NAA/Cr ratio (RN2 = 0.44). With a decrease in NAA/Cr ratio from the 75th to 25th percentile of the distribution, the relative ratio for the odds of having a higher neuritic plaque score was 9.94 (95% CI: 2.82, 35.01) (Table 2).
DISCUSSION
For more than a decade, the results of in vivo 1H MR spectroscopy studies have consistently indicated that NAA concentrations decrease and mI concentrations increase in patients with amnestic MCI and AD based on the clinical diagnosis (45). The present study results validate these findings by showing that NAA/Cr ratios decrease and mI/Cr ratios increase with increasing severity of AD-type pathology seen at autopsy. The strongest association between MR spectroscopy and pathologic measures was observed when two metabolite ratios were combined to yield the NAA/mI ratio; this result suggests that NAA and mI have complementary roles in predicting the AD pathology.
In the brain, NAA is located primarily in neuron bodies, axons, and dendrites and is thus a sensitive marker for neuronal density or viability. On the basis of the correlation between mitochondrial adenosine triphosphate production and NAA level, the production of NAA in the neuron is thought to be related to mitochondrial function (46). Decreased NAA levels, however, may normalize after either recovery from head trauma (47) or the cessation of seizures after surgery for epilepsy (48). NAA levels may also return to normal within the first 6 weeks of treatment with donepezil for AD (49). The normalization of NAA levels after therapy for neurologic disorders implies that NAA is also a marker for neuronal function and possibly for neuronal mitochondrial function. As expected, the majority of subjects in our study who had a pathologically high likelihood of AD were taking cholinesterase inhibitors at the time of 1H MR spectroscopy. If cholinesterase inhibitor treatment had this level of an effect on our 1H MR spectroscopy measurements, then it weakened the associations between the NAA ratios and the pathologic indexes of AD.
Because NAA is a neuronal metabolite, the reduction of NAA levels in patients with AD is the result of loss of neuronal components, neuronal function disruption, or both; these phenomena are strongly associated with increasing neurofibrillary degeneration. We hypothesized that NAA/Cr ratio would correlate with neurofibrillary abnormality on the basis of findings in a previous study, in which regional decreases in NAA/Cr ratio had the same topographic distribution as the progression of neurofibrillary abnormality in patients with AD (10). In the present study, the 1H MR spectroscopy voxel included the medioparietal paralimbic and association neocortices—regions that are involved in the neurofibrillary abnormality with AD at around Braak NFT stage IV (40). As expected, the NAA/Cr ratios in our study subjects decreased significantly at Braak NFT stages higher than stage IV, which correspond to the operational definition of Braak NFT stage IV. Pathologic validation studies involving specifically this voxel location may help to further clarify the relationship between NAA/Cr ratio and neurofibrillary abnormality.
The importance of increased mI/Cr ratio is less clear. The peak mI concentration is thought to contain glial metabolites, which are responsible for osmoregulation (50,51), and mI levels correlate with gliosis in inflammatory central nervous system demyelination (52). For this reason, elevation of the mI peak is thought to be related to gliosis in patients with AD (10,35,52,53). In patients with amnestic MCI, mI/Cr ratios are elevated, but NAA/Cr ratios are only mildly decreased; these findings suggest that the increase in mI/Cr ratio occurs earlier than does the decrease in NAA/Cr ratio during the progression of AD (10,11). A similar temporal course of changes in these metabolites is seen with mild AD (53) and during the predementia phase of Down syndrome (54,55). The present study results support the hypothesis that the increase in mI/Cr ratio precedes the decrease in NAA/Cr ratio. Although the subjects with a low likelihood of AD and sparse neuritic plaques had higher mI/Cr ratios than the subjects with an intermediate likelihood of AD and moderate neuritic plaques, the NAA/Cr ratios in these two groups were similar and thus suggest that the mI/Cr ratio may be more sensitive to early pathologic changes than the NAA/Cr ratio.
There have been conflicting reports regarding Cho levels and Cho/Cr ratios in patients with AD. Some study investigators have reported elevated Cho levels and/or Cho/Cr ratios (6,10) with AD, while others have not (7,8,37). The largest amount of Cho in the brain is found in the Cho-bound membrane phospholipids, and Cho levels may change with cell signaling activity. Cho/Cr ratios decrease with cholinergic agonist treatment in patients with AD (56); this finding suggests that the down regulation of Cho acetyltransferase activity may be responsible for the elevation in Cho. In a recent serial 1H MR spectroscopy study, Cho/Cr ratios longitudinally increased in patients with amnestic MCI that progressed to AD (21). In contrast, Cho/Cr ratios decreased in the patients with amnestic MCI who remained stable. These findings suggest a possible relationship between the compensatory cholinergic mechanisms of amnestic MCI and decreased Cho/Cr ratios (57). The fact that we identified no associations between Cho/Cr ratio and indexes of AD-type pathology suggests that the cross-sectional or longitudinal Cho/Cr changes observed with amnestic MCI and AD may be related to functional mechanisms that are independent of the neurofibrillary abnormality, such as alterations in cholinergic transmission (57).
We included subjects who had coexisting Lewy bodies in this study because Lewy body disease is seen in many individuals with AD and excluding these subjects would have limited our ability to generalize findings to clinical cohorts since it is not yet possible to detect Lewy body disease in vivo (26). In our subject sample, we observed no difference in 1H MR spectroscopy metabolite ratios between the subjects who had AD with Lewy body disease and those who had AD without it. This finding is consistent with the findings in a group of patients who received a clinical diagnosis of dementia with Lewy bodies: Their Cho/Cr ratios were found to be elevated, similar to those in patients with AD, but their NAA/Cr and mI/Cr ratios were normal (58).
The varying times between 1H MR spectroscopy and death among the subjects represented a limitation of our study. Ideally, all subjects would have undergone 1H MR spectroscopy at a similar time before death; however, this variable is logistically difficult to control in longitudinal studies. We accounted for this variability by adjusting the data for time from 1H MR spectroscopy to death during the statistical analysis. Another limitation stemmed from the fact that in the gray matter, NAA, Cr, and mI concentrations are, on average, 30% higher and Cho concentrations are, on average, 29% lower compared with these metabolite concentrations in the white matter (59). A wider interhemispheric fissure in the subjects with atrophy may have increased the gray matter content and decreased the white matter content in the voxel. This may be one reason for the lack of a correlation between Cho/Cr ratios and likelihood of AD.
Our goal was to assess the degree to which 1H MR spectroscopy metabolite measurements correlate with severity of AD-type pathology. For this reason, our subject cohort included individuals who had not received a pathologic diagnosis—other than AD—that would affect 1H MR spectroscopy metabolite measurements. We cannot make inferences regarding the clinical usefulness or the diagnostic sensitivity and specificity of 1H MR spectroscopy in the diagnosis of AD in this cohort. We noted, however, that the NAA/mI ratios in the subjects with a pathologically low likelihood of AD were above the upper quartile of those in the subjects with a pathologically high likelihood of AD. On the other hand, the metabolite ratios in the intermediate-likelihood group overlapped with those in the high- and low-likelihood groups.
Future studies are needed to investigate the usefulness of MR spectroscopy in the differential diagnosis of AD and other degenerative disorders that affect the elderly. However, given the complexity of the abnormalities that underlie dementia in elderly individuals (eg, AD-type, cerebrovascular, and Lewy body pathologies), it is clear why a single imaging marker is not sufficient for the early diagnosis of dementia (60,61). Combining the information gleaned from different quantitative MR examinations such as volumetric MR imaging, 1H MR spectroscopy, and diffusion MR imaging or other imaging modalities such as 18F fluorodeoxyglucose PET and amyloid ligand PET may further improve the diagnostic value of imaging for the early diagnosis of dementia (62,63).
We conclude that decreases in NAA/mI ratio are associated with the ongoing neurodegenerative process in AD. Our findings, considered in combination with the results of prior longitudinal MR spectroscopy studies on AD, indicate that 1H MR spectroscopy measurements are potential noninvasive imaging markers for AD-type pathology involvement in longitudinal studies and therapeutic trials.
APPENDIX
The proportional odds ordinal logistic regression model was derived by assuming that the neuropathology group was an ordinal representation of an underlying continuous abnormality measurement. With this model, the effect of metabolite ratio on the odds of the given subject having a more severe neurologic abnormality could be estimated by using a single parameter. We summarized how well the model predicted abnormality by using the C statistic, which is a generalization of the area under the receiver operating characteristics curve, and RN2, a generalization of the coefficient of determination from a linear regression model (64). The C statistic can be interpreted as the proportion of times a pair of randomly selected subjects can be correctly assigned to an abnormality group by using only the predictors in the model. The RN2 can be interpreted as the proportion of the data log likelihood accounted for by the model relative to a “perfect fitting” or saturated model, with the complexity of the model taken into account.
ADVANCES IN KNOWLEDGE
-
•.
For more than a decade, in vivo 1H MR spectroscopy studies have consistently indicated that the N-acetylaspartate (NAA) concentration is decreased and the myo-inositol (mI) concentration is increased in patients with amnestic mild cognitive impairment and Alzheimer disease (AD) based on the clinical diagnosis.
-
•.
The present study results validate these findings by showing that NAA-to-creatine (Cr) ratios decrease and mI/Cr ratios increase with increasing severity of AD-type pathology seen at autopsy.
-
•.
The strongest association between 1H MR spectroscopy and pathologic measures was observed when two metabolite ratios were combined to yield the NAA/mI ratio; this finding suggests that NAA and mI have complementary roles in predicting the AD-type pathology.
IMPLICATION FOR PATIENT CARE
-
•.
Our study findings demonstrate that decreased NAA/Cr ratios and decreased mI/Cr ratios measured in vivo can be used to detect the extent of disease involvement in subjects with AD.
The present study results validate these findings by showing that N-acetylaspartate–to-creatine (Cr) ratios decrease and myo-inositol–to-Cr ratios increase with increasing severity of Alzheimer disease–type pathology seen at autopsy.
Footnotes
Author contributions: Guarantor of integrity of entire study, K.K.; study concepts/study design or data acquisition or data analysis/interpretation, all authors; manuscript drafting or manuscript revision for important intellectual content, all authors; manuscript final version approval, all authors; literature research, K.K.; clinical studies, K.K., D.W.D., J.E.P., J.L.W., K.A.J., B.F.B., R.C.P., C.R.J.; experimental studies, K.K., D.W.D., C.R.J.; statistical analysis, K.K., S.D.W.; and manuscript editing, K.K., D.S.K., D.W.D., S.D.W., K.A.J., B.F.B., R.C.P., C.R.J.
Authors stated no financial relationship to disclose.
References
- 1.Growdon JH Biomarkers of Alzheimer disease. Arch Neurol 1999;56:281–283. [DOI] [PubMed] [Google Scholar]
- 2.Kantarci K, Jack CR Jr. Neuroimaging in Alzheimer disease: an evidence-based review. Neuroimaging Clin N Am 2003;13:197–209. [DOI] [PubMed] [Google Scholar]
- 3.Kantarci K, Jack CR Jr. Quantitative magnetic resonance techniques as surrogate markers of Alzheimer's disease. NeuroRx 2004;1:196–205. [DOI] [PMC free article] [PubMed] [Google Scholar]
- 4.Klunk WE, Panchalingam K, Moossy J, McClure RJ, Pettegrew JW. N-acetyl-L-aspartate and other amino acid metabolites in Alzheimer's disease brain: a preliminary proton nuclear magnetic resonance study. Neurology 1992;42:1578–1585. [DOI] [PubMed] [Google Scholar]
- 5.Miller BL, Moats RA, Shonk T, Ernst T, Woolley S, Ross BD. Alzheimer disease: depiction of increased cerebral myo-inositol with proton MR spectroscopy. Radiology 1993;187:433–437. [DOI] [PubMed] [Google Scholar]
- 6.Meyerhoff DJ, MacKay S, Constans JM, et al. Axonal injury and membrane alterations in Alzheimer's disease suggested by in vivo proton magnetic resonance spectroscopic imaging. Ann Neurol 1994;36:40–47. [DOI] [PubMed] [Google Scholar]
- 7.Parnetti L, Tarducci R, Presciutti O, et al. Proton magnetic resonance spectroscopy can differentiate Alzheimer's disease from normal aging. Mech Ageing Dev 1997;97:9–14. [DOI] [PubMed] [Google Scholar]
- 8.Schuff N, Amend D, Ezekiel F, et al. Changes of hippocampal N-acetyl aspartate and volume in Alzheimer's disease: a proton MR spectroscopic imaging and MRI study. Neurology 1997;49:1513–1521. [DOI] [PubMed] [Google Scholar]
- 9.Jessen F, Block W, Traber F, et al. Proton MR spectroscopy detects a relative decrease of N-acetylaspartate in the medial temporal lobe of patients with AD. Neurology 2000;55:684–688. [DOI] [PubMed] [Google Scholar]
- 10.Kantarci K, Jack CR Jr, Xu YC, et al. Regional metabolic patterns in mild cognitive impairment and Alzheimer's disease: a 1H MRS study. Neurology 2000;55:210–217. [DOI] [PMC free article] [PubMed] [Google Scholar]
- 11.Catani M, Cherubini A, Howard R, et al. (1)H-MR spectroscopy differentiates mild cognitive impairment from normal brain aging. Neuroreport 2001;12:2315–2317. [DOI] [PubMed] [Google Scholar]
- 12.Chantal S, Braun CM, Bouchard RW, Labelle M, Boulanger Y. Similar 1H magnetic resonance spectroscopic metabolic pattern in the medial temporal lobes of patients with mild cognitive impairment and Alzheimer disease. Brain Res 2004;1003:26–35. [DOI] [PubMed] [Google Scholar]
- 13.Garrard P, Schott JM, MacManus DG, Hodges JR, Fox NC, Waldman AD. Posterior cingulate neurometabolite profiles and clinical phenotype in frontotemporal dementia. Cogn Behav Neurol 2006;19:185–189. [DOI] [PubMed] [Google Scholar]
- 14.Engelhardt E, Moreira DM, Laks J, Cavalcanti JL. Alzheimer's disease and proton magnetic resonance spectroscopy of limbic regions: a suggestion of a clinical-spectroscopic staging. Arq Neuropsiquiatr 2005;63:195–200. [DOI] [PubMed] [Google Scholar]
- 15.Rami L, Gomez-Anson B, Bosch B, et al. Cortical brain metabolism as measured by proton spectroscopy is related to memory performance in patients with amnestic mild cognitive impairment and Alzheimer's disease. Dement Geriatr Cogn Disord 2007;24:274–279. [DOI] [PubMed] [Google Scholar]
- 16.Shonk TK, Moats RA, Gifford P, et al. Probable Alzheimer disease: diagnosis with proton MR spectroscopy. Radiology 1995;195:65–72. [DOI] [PubMed] [Google Scholar]
- 17.Kantarci K, Xu Y, Shiung MM, et al. Comparative diagnostic utility of different MR modalities in mild cognitive impairment and Alzheimer's disease. Dement Geriatr Cogn Disord 2002;14:198–207. [DOI] [PMC free article] [PubMed] [Google Scholar]
- 18.Adalsteinsson E, Sullivan EV, Kleinhans N, Spielman DM, Pfefferbaum A. Longitudinal decline of the neuronal marker N-acetyl aspartate in Alzheimer's disease. Lancet 2000;355:1696–1697. [DOI] [PubMed] [Google Scholar]
- 19.Chao LL, Schuff N, Kramer JH, et al. Reduced medial temporal lobe N-acetylaspartate in cognitively impaired but nondemented patients. Neurology 2005;64:282–289. [DOI] [PMC free article] [PubMed] [Google Scholar]
- 20.Jessen F, Block W, Traber F, et al. Decrease of N-acetylaspartate in the MTL correlates with cognitive decline of AD patients. Neurology 2001;57:930–932. [DOI] [PubMed] [Google Scholar]
- 21.Kantarci K, Weigand SD, Petersen RC, et al. Longitudinal (1)H MRS changes in mild cognitive impairment and Alzheimer's disease. Neurobiol Aging 2007;28:1330–1339. [DOI] [PMC free article] [PubMed] [Google Scholar]
- 22.Metastasio A, Rinaldi P, Tarducci R, et al. Conversion of MCI to dementia: role of proton magnetic resonance spectroscopy. Neurobiol Aging 2006;27:926–932. [DOI] [PubMed] [Google Scholar]
- 23.Modrego PJ, Fayed N, Pina MA. Conversion from mild cognitive impairment to probable Alzheimer's disease predicted by brain magnetic resonance spectroscopy. Am J Psychiatry 2005;162:667–675. [DOI] [PubMed] [Google Scholar]
- 24.Petersen RC, Kokmen E, Tangalos E, Ivnik RJ, Kurland LT. Mayo Clinic Alzheimer's Disease Patient Registry. Aging (Milano) 1990;2:408–415. [DOI] [PubMed] [Google Scholar]
- 25.Uchikado H, Lin WL, DeLucia MW, Dickson DW. Alzheimer disease with amygdala Lewy bodies: a distinct form of alpha-synucleinopathy. J Neuropathol Exp Neurol 2006;65:685–697. [DOI] [PMC free article] [PubMed] [Google Scholar]
- 26.Hamilton RL Lewy bodies in Alzheimer's disease: a neuropathological review of 145 cases using alpha-synuclein immunohistochemistry. Brain Pathol 2000;10:378–384. [DOI] [PMC free article] [PubMed] [Google Scholar]
- 27.American Psychiatric Association. Diagnostic and statistical manual of mental disorders. 3rd ed. Washington, DC: American Psychiatric Association, 1987.
- 28.McKhann G, Drachman D, Folstein M, Katzman R, Price D, Stadlan EM. Clinical diagnosis of Alzheimer's disease: report of the NINCDS-ADRDA Work Group under the auspices of Department of Health and Human Services Task Force on Alzheimer's Disease. Neurology 1984;34:939–944. [DOI] [PubMed] [Google Scholar]
- 29.Petersen RC Mild cognitive impairment as a diagnostic entity. J Intern Med 2004;256:183–194. [DOI] [PubMed] [Google Scholar]
- 30.Webb PG, Sailasuta N, Kohler SJ, Raidy T, Moats RA, Hurd RE. Automated single-voxel proton MRS: technical development and multisite verification. Magn Reson Med 1994;31:365–373. [DOI] [PubMed] [Google Scholar]
- 31.Whitwell JL, Petersen RC, Negash S, et al. Patterns of atrophy differ among specific subtypes of mild cognitive impairment. Arch Neurol 2007;64:1130–1138. [DOI] [PMC free article] [PubMed] [Google Scholar]
- 32.Petrella JR, Wang L, Krishnan S, et al. Cortical deactivation in mild cognitive impairment: high-field-strength functional MR imaging. Radiology 2007;245:224–235. [DOI] [PubMed] [Google Scholar]
- 33.Chetelat G, Desgranges B, de la Sayette V, Viader F, Eustache F, Baron JC. Mild cognitive impairment: can FDG-PET predict who is to rapidly convert to Alzheimer's disease? Neurology 2003;60:1374–1377. [DOI] [PubMed] [Google Scholar]
- 34.Jack CR Jr, Lowe VJ, Senjem ML, et al. 11C PiB and structural MRI provide complementary information in imaging of Alzheimer's disease and amnestic mild cognitive impairment. Brain 2008;131(pt 3):665–680. [DOI] [PMC free article] [PubMed] [Google Scholar]
- 35.Ernst T, Chang L, Melchor R, Mehringer CM. Frontotemporal dementia and early Alzheimer disease: differentiation with frontal lobe H-1 MR spectroscopy. Radiology 1997;203:829–836. [DOI] [PubMed] [Google Scholar]
- 36.Schuff N, Capizzano AA, Du AT, et al. Selective reduction of N-acetylaspartate in medial temporal and parietal lobes in AD. Neurology 2002;58:928–935. [DOI] [PMC free article] [PubMed] [Google Scholar]
- 37.Moats RA, Ernst T, Shonk TK, Ross BD. Abnormal cerebral metabolite concentrations in patients with probable Alzheimer disease. Magn Reson Med 1994;32:110–115. [DOI] [PubMed] [Google Scholar]
- 38.Mohanakrishnan P, Fowler AH, Vonsattel JP, et al. Regional metabolic alterations in Alzheimer's disease: an in vitro 1H NMR study of the hippocampus and cerebellum. J Gerontol A Biol Sci Med Sci 1997;52:B111–B117. [DOI] [PubMed] [Google Scholar]
- 39.Mirra SS, Heyman A, McKeel D, et al. The Consortium to Establish a Registry for Alzheimer's Disease (CERAD). II. Standardization of the neuropathologic assessment of Alzheimer's disease. Neurology 1991;41:479–486. [DOI] [PubMed] [Google Scholar]
- 40.Braak H, Braak E. Neuropathological stageing of Alzheimer-related changes. Acta Neuropathol 1991;82:239–259. [DOI] [PubMed] [Google Scholar]
- 41.Hyman BT, Trojanowski JQ. Consensus recommendations for the postmortem diagnosis of Alzheimer disease from the National Institute on Aging and the Reagan Institute Working Group on diagnostic criteria for the neuropathological assessment of Alzheimer disease. J Neuropathol Exp Neurol 1997;56:1095–1097. [DOI] [PubMed] [Google Scholar]
- 42.McKeith IG, Dickson DW, Lowe J, et al. Diagnosis and management of dementia with Lewy bodies: third report of the DLB Consortium. Neurology 2005;65:1863–1872. [DOI] [PubMed] [Google Scholar]
- 43.Perneger TV What's wrong with Bonferroni adjustments? BMJ 1998;316:1236–1238. [DOI] [PMC free article] [PubMed] [Google Scholar]
- 44.O'Brien PC The appropriateness of analysis of variance and multiple-comparison procedures. Biometrics 1983;39:787–794. [PubMed] [Google Scholar]
- 45.Valenzuela MJ, Sachdev P. Magnetic resonance spectroscopy in AD. Neurology 2001;56:592–598. [DOI] [PubMed] [Google Scholar]
- 46.Bates TE, Strangward M, Keelan J, Davey GP, Munro PM, Clark JB. Inhibition of N-acetylaspartate production: implications for 1H MRS studies in vivo. Neuroreport 1996;7:1397–1400. [PubMed] [Google Scholar]
- 47.Brooks WM, Stidley CA, Petropoulos H, et al. Metabolic and cognitive response to human traumatic brain injury: a quantitative proton magnetic resonance study. J Neurotrauma 2000;17:629–640. [DOI] [PubMed] [Google Scholar]
- 48.Hugg JW, Kuzniecky RI, Gilliam FG, Morawetz RB, Fraught RE, Hetherington HP. Normalization of contralateral metabolic function following temporal lobectomy demonstrated by 1H magnetic resonance spectroscopic imaging. Ann Neurol 1996;40:236–239. [DOI] [PubMed] [Google Scholar]
- 49.Krishnan KR, Charles HC, Doraiswamy PM, et al. Randomized, placebo-controlled trial of the effects of donepezil on neuronal markers and hippocampal volumes in Alzheimer's disease. Am J Psychiatry 2003;160:2003–2011. [DOI] [PubMed] [Google Scholar]
- 50.Urenjak J, Williams SR, Gadian DG, Noble M. Proton nuclear magnetic resonance spectroscopy unambiguously identifies different neural cell types. J Neurosci 1993;13:981–989. [DOI] [PMC free article] [PubMed] [Google Scholar]
- 51.Brand A, Richter-Landsberg C, Leibfritz D. Multinuclear NMR studies on the energy metabolism of glial and neuronal cells. Dev Neurosci 1993;15:289–298. [DOI] [PubMed] [Google Scholar]
- 52.Bitsch A, Bruhn H, Vougioukas V, et al. Inflammatory CNS demyelination: histopathologic correlation with in vivo quantitative proton MR spectroscopy. AJNR Am J Neuroradiol 1999;20:1619–1627. [PMC free article] [PubMed] [Google Scholar]
- 53.Huang W, Alexander GE, Chang L, et al. Brain metabolite concentration and dementia severity in Alzheimer's disease: a (1)H MRS study. Neurology 2001;57:626–632. [DOI] [PubMed] [Google Scholar]
- 54.Huang W, Alexander GE, Daly EM, et al. High brain myo-inositol levels in the predementia phase of Alzheimer's disease in adults with Down's syndrome: a 1H MRS study. Am J Psychiatry 1999;156:1879–1886. [DOI] [PubMed] [Google Scholar]
- 55.Shonk T, Ross BD. Role of increased cerebral myo-inositol in the dementia of Down syndrome. Magn Reson Med 1995;33:858–861. [DOI] [PubMed] [Google Scholar]
- 56.Satlin A, Bodick N, Offen WW, Renshaw PF. Brain proton magnetic resonance spectroscopy (1H-MRS) in Alzheimer's disease: changes after treatment with xanomeline, an M1 selective cholinergic agonist. Am J Psychiatry 1997;154:1459–1461. [DOI] [PubMed] [Google Scholar]
- 57.DeKosky ST, Ikonomovic MD, Styren SD, et al. Upregulation of choline acetyltransferase activity in hippocampus and frontal cortex of elderly subjects with mild cognitive impairment. Ann Neurol 2002;51:145–155. [DOI] [PubMed] [Google Scholar]
- 58.Kantarci K, Petersen RC, Boeve BF, et al. 1H MR spectroscopy in common dementias. Neurology 2004;63:1393–1398. [DOI] [PMC free article] [PubMed] [Google Scholar]
- 59.Michaelis T, Merboldt KD, Bruhn H, Hanicke W, Frahm J. Absolute concentrations of metabolites in the adult human brain in vivo: quantification of localized proton MR spectra. Radiology 1993;187:219–227. [DOI] [PubMed] [Google Scholar]
- 60.Schneider JA, Arvanitakis Z, Bang W, Bennett DA. Mixed brain pathologies account for most dementia cases in community-dwelling older persons. Neurology 2007;69:2197–2204. [DOI] [PubMed] [Google Scholar]
- 61.Lippa CF, Knopman DS. Dementia: many roads, but not built in a day. Neurology 2007;69:2193–2194. [DOI] [PubMed] [Google Scholar]
- 62.Whitwell JL, Jack CR Jr, Parisi JE, et al. Rates of cerebral atrophy differ in different degenerative pathologies. Brain 2007;130:1148–1158. [DOI] [PMC free article] [PubMed] [Google Scholar]
- 63.Jack CR Jr, Dickson DW, Parisi JE, et al. Antemortem MRI findings correlate with hippocampal neuropathology in typical aging and dementia. Neurology 2002;58:750–757. [DOI] [PMC free article] [PubMed] [Google Scholar]
- 64.Harrell FE Jr Ordinal logistic regression. In: Harrell FE Jr, ed. Regression modeling strategies. New York, NY: Springer-Verlag, 2001; 331–337.


