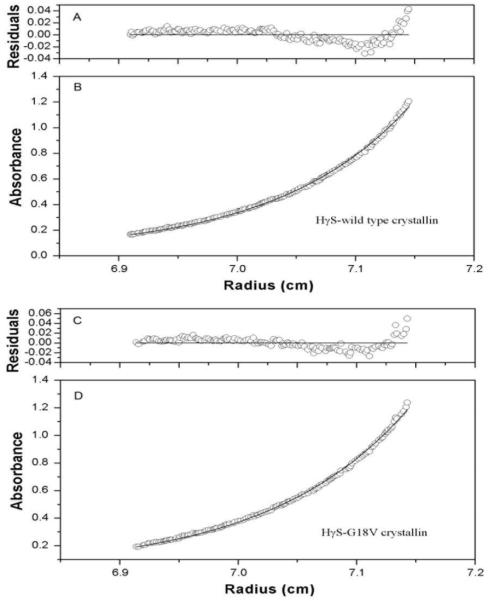
Figure 1.
sedimentation equilibrium data obtained for wild type and mutant HγS-crystallins at 20°C. Absorbance (B, D) and residuals (A,C) ploted for wild type and mutant HγS-crystallins. Opened circles showed the protein concentration profile represented by the UV absorbance gradients in the centrifuge cell at 280 nm. The solid lines indicated the calculated fit for monomer.

