Abstract
The E. coli small (30S) ribosomal subunit is a particularly well-characterized model system for studying in vitro self-assembly. A previously developed pulse-chase monitored by quantitative mass spectrometry (PC/QMS) approach to measuring kinetics of in vitro 30S assembly suffered from poor signal-to-noise and was unable to observe some ribosomal proteins. We have developed an improved LC-MS based method using quantitative ESI-TOF analysis of isotope-labeled tryptic peptides. Binding rates for 18 of the 20 ribosomal proteins are reported, and exchange of proteins S2 and S21 between bound and unbound states prevented measurement of their binding kinetics. Multiphasic kinetics of 3' domain proteins S7 and S9 are reported, which support an assembly mechanism that utilizes multiple parallel pathways. This quantitative ESI-TOF approach should be widely applicable to study the assembly of other macromolecular complexes, and to quantitative proteomics experiments in general.
Introduction
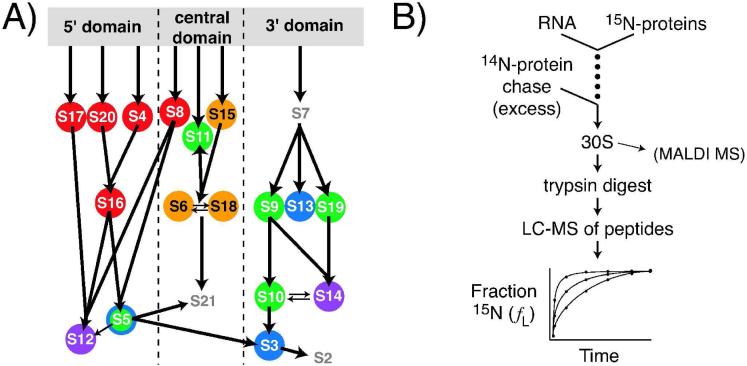
Self-assembling ribonucleoprotein complexes (RNPs) are involved in many essential cellular processes such as transcription, mRNA splicing, post-transcriptional regulation, and translation. The E. coli small (30S) ribosomal subunit is a particularly well-characterized RNP model system for studying self-assembly.1 The 30S subunit, which is made up of 20 ribosomal proteins (r-proteins) and a single 16S ribosomal RNA (rRNA),2 self-assembles in vitro3 through a series of hierarchical RNA folding and protein binding events.4 The Nomura assembly map4,5 (Figure 1A) describes protein binding under equilibrium conditions, based on experiments using different combinations of ribosomal proteins in partial reconstitutions. The order of protein binding suggested by these thermodynamic dependencies is consistent with kinetic data since primary binding proteins, those that bind directly to the RNA, tend to bind faster than secondary and tertiary proteins, which depend on other proteins in order to bind at equilibrium.6 The 30S subunit is organized into three domains that can be reconstituted independently: the 5' domain, the central domain, and the 3' domain.7,8,9 In vitro assembly is faster closer to the 5' end of the RNA,6 paralleling the co-transcriptional protein binding that likely occurs in vivo.10 The mechanism of in vitro assembly involves multiple parallel pathways rather than a single defined order of protein binding.11,12 Additional kinetic data will provide further insights into the mechanism of in vitro 30S ribosomal subunit assembly.
Figure 1. Pulse-Chase Monitored by Quantitative Mass Spectrometry.
A) Equilibrium assembly map of the 30S ribosomal subunit. Arrows represent protein-binding dependencies at equilibrium.4, 5 Circle colors refer to apparent protein binding rates previously measured using MALDI-MS under standard reconstitution conditions.11 Red, 20 to 30 min-1; orange, 8.1 - 15 min-1; green, 1.2 - 2.2 min-1; blue, 0.38 - 0.73 min-1; purple, 0.18 - 0.26 min-1. S5 is shown in green and blue to represent the binding rates of the unacetylated and acetylated forms, respectively. Positions of the protein symbols along the grey bar correspond to the protein's approximate binding site on the 16S rRNA. Binding rates for S2 and S7 were not determined because those proteins were not visible in the MALDI spectra. B) Experimental scheme for PC/QMS 30S subunit reconstitution. The previous scheme for PC/QMS involved MALDI-MS of intact ribosomal proteins, whereas the presently described method involves ESI-TOF analysis of tryptic ribosomal peptides.
Traditional methods of monitoring in vitro complex formation often require the use of fluorescent or radioactive tags that can be difficult to attach and can necessitate additional control experiments. Mass spectrometry can directly detect most biological molecules without the use of such tags. Mass spectrometry of stable-isotope labeled proteins and peptides has become a widespread technique for measuring relative protein levels between samples.13,14 Two main challenges in mass spectrometry of stable-isotope labeled proteins and peptides are quantitation and identification. One of the most common methods for quantitating pairs of labeled and unlabeled isotopomers in liquid chromatography coupled mass spectrometry (LCMS) data uses extracted ion chromatograms (EICs) of the labeled and unlabeled monoisotopic peaks.15, 16 Although this method accounts for the whole width of the monoisotopic peak in the time dimension, it does not account for the intensities of heavier isotopomers in the isotope distribution of either species. Tandem mass spectrometry (MS/MS) is a powerful and widely used method for identifying peptides17 using accurate mass and time tags.18,19 However, this approach is not optimal for quantitative analysis of stable-isotope labeled samples because the same MS/MS data used for identification cannot easily be used for relative quantitation. This approach also limits the number of peptides that can be identified in routine samples to the set that have already been observed in MS/MS experiments.
Previous work in our laboratory used isotopically labeled r-proteins to perform quantitative in vitro studies of 30S ribosomal subunit assembly using MALDI of intact proteins.11 These pulse-chase experiments monitored by quantitative mass spectrometry (PC/QMS) were initiated by mixing 15N labeled r-proteins with 16S rRNA (Figure 1B). The assembly reaction was then chased with excess unlabeled proteins at various time points and 30S formation was allowed to proceed to completion. In the resultant 30S subunits, the fraction of 15N protein was equal to the fraction of that protein bound to the rRNA before the chase was added. The relative amounts of 14N and 15N protein were then quantitated using MALDI-MS of the protein mixtures extracted from the 30S subunits. The r-protein binding rates obtained using MALDI-PC/QMS analysis of intact proteins11 (Figure 1A) were consistent with previous qualitative kinetic data based on chemical probing.6
The MALDI data from intact r-proteins suffered from poor signal-to-noise, especially for the larger proteins, and proteins S2 and S7 were not visible at all in the MALDI spectra. As an alternative, we have developed an improved LC-MS based approach for monitoring 30S assembly kinetics using electrospray ionization with time-of-flight (ESI-TOF) analysis of isotope-labeled tryptic peptides. Peptides are both identified and quantitated using the primary LC-MS data, avoiding some of the limitations of the accurate mass time tag MS/MS methods. An alternative quantitation method based on Fourier Transform Convolution is applied, that allows accurate quantitation of the signal contribution from every isotopomer in the isotope distribution.20 The identification strategy takes advantage of the limited set of proteins in the 30S ribosome samples and the nitrogen content information encoded in the 15N-labeled proteins. Other advantages of this approach include high mass accuracy and dynamic range,21 efficient ionization, and multiple independent measurements from different peptides for every protein, including S2 and S7. Here, the accuracy and precision of this quantitation method is described, and the method is used for improved measurement of the binding kinetics of r-proteins during in vitro assembly.
Materials and Methods
Native 30S subunits were prepared from E. coli MRE600 as described previously,22 except that a Bead Beater (BioSpec) was used to lyse the cells. R-proteins and 16S rRNA were prepared from native 30S subunits, and pulse-chase analysis was performed as previously described11 with minor adjustments. Briefly, 16S RNA was prepared by resuspension in TKM buffer (25 mM Tris-Cl pH 7.5, 30 mM KCl, 20 mM MgCl2) at 3-5 μM, heating to 42°C for 5 min, and slow cooling by dialysis against room temperature TKM buffer at 4°C for at least 2 hours. The r-proteins were thawed on ice and diluted into either TKMD buffer (25 mM Tris-Cl pH 7.5, 1 M KCl, 20 mM MgCl2) for the pulse, or RB buffer (25 mM Tris-HCl pH 7.5, 330 mM KCl, 20 mM MgCl2) for the chase. Samples were pre-heated to 40°C before beginning the pulse. The pulse was performed with 0.3 μM 16S RNA, 0.45 μM15N r-proteins in a volume of 600μl for 0-40 min. A chase of 225 μl of 6 μM 14N r-proteins was added after the pulse, so that the final ratio of 14N:15N protein was 5:1. After the chase was added, the reconstitution was incubated at 40°C for 40 min. The reconstitutions for the standard curve were performed in a similar fashion, except that pre-formed mixtures of 14N and 15N r-proteins were used for the pulse, the scale was 165 pmol RNA, the samples were incubated at 40°C for 1 hr, and the chase step was omitted.
The 30S subunits from reconstitution reactions were cooled to 4°C and purified on 10-40% sucrose gradients by ultracentrifugation at 26,000 rpm in a Beckman SW-28 rotor in RB buffer, including 0.5 M NH4Cl to remove non-specifically bound excess protein. The gradients were fractionated at 1 ml/min and monitored at 254 nm, and the 30S peak was collected. The proteins and RNA were precipitated with 13% TCA on ice overnight, and were pelleted at 14,000 g for 25 min. The pellets were washed once with cold 10% TCA followed by cold acetone and dried at room temperature. The pellets were partially resuspended with 10 μl of 100mM ammonium bicarbonate. To further dissolve the pellets, they were heated to 65°C for 2 min, and sonicated for 10 min in a room temperature water bath. The r-proteins were reduced with DTT and then alkylated with 40mM iodoacetamide for 60 min at 37°C. The r-proteins were then digested with 15-30 ng/μl of sequencing grade modified porcine trypsin (Promega) at 37°C overnight, and the digestion reaction was halted with the addition of formic acid to 0.1%. The samples were centrifuged in a microcentrifuge at 16,000g for 10 min to remove precipitate before LC/MS analysis.
LC-MS analysis was conducted using an Agilent 1100 Series HPLC coupled to an Agilent ESI-TOF mass spectrometer with capillary flow electrospray. The digested r-proteins (5-8 μl) were injected onto an Agilent Zorbax SB C18 150 mm × 0.5 mm column. The mobile phases used were Buffer A (H2O, 0.1% formic acid) and Buffer B (acetonitrile, 0.1% formic acid). A gradient was applied to separate the peptides: 5% to 15% Buffer B over 10 min, 15% to 47% Buffer B over 48 min, 47% to 95% Buffer B over 4 min at a flow rate of 7μl/min. Data were collected for the m/z range of 100-1300. A separate electrospray probe with a direct infusion of reference ions was used for some samples, which resulted in greater mass accuracy but slightly lower intensity.
Results and Discussion
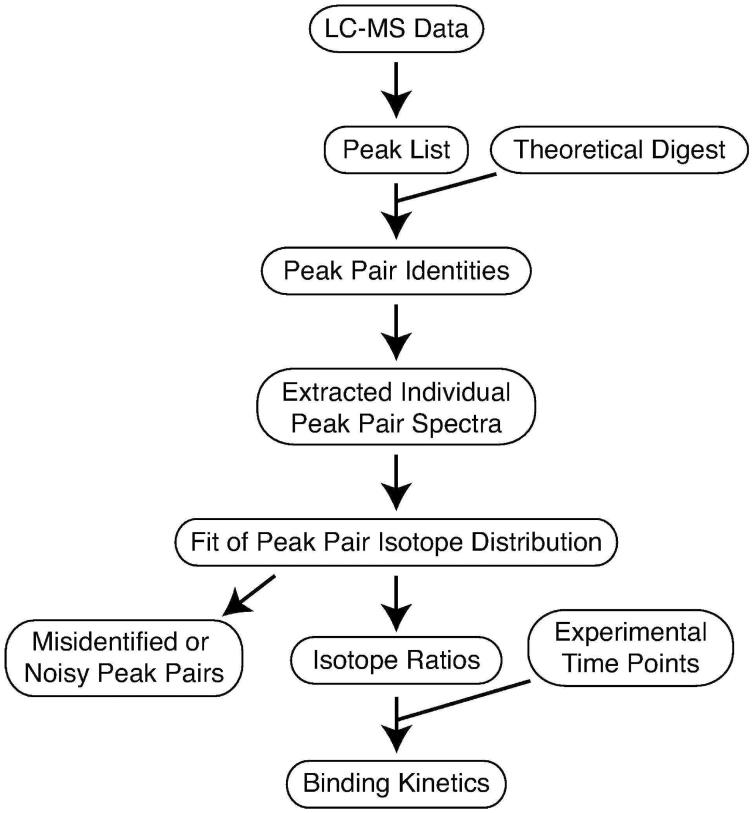
The steps for data analysis required for obtaining kinetic r-protein binding curves using PC/QMS with LC-MS of isotopically labeled tryptic peptides are shown in Figure 2. First, a list of experimental peaks is compared to a theoretical digest in order to obtain identities for the 14N/15N peptide peak pairs. Then, individual peak pair spectra are fit to a theoretical isotope distribution to obtain the amplitudes of the labeled and unlabeled peaks. Finally, the fraction of labeled intensity as compared to total intensity is plotted against the experimental time points to produce a protein binding progress curve.
Figure 2. Data analysis flow chart.
Peak pairs are identified by comparison with a theoretical digest. Individual peak pair spectra are extracted from the dataset, and fit using LS-FTC20 to obtain isotope ratios.
A representative LC-MS dataset from a sample containing 14N and 15N 30S ribosomal peptides is shown in Figure 3A as a grayscale plot. The retention times for the 14N and 15N versions of the peptides are essentially identical, with differences typically less than two seconds23,24 and many pairs of 14N/15N isotopomers are visible as pairs of dark spots. A typical trypsin digest of 30S r-proteins gives rise to several thousand mass peaks, from which ~100-300 14N-15N peak pairs can be confidently identified and quantitated. Based on nearly a hundred LC-MS data sets, different subsets of peptides are observed and identified in each ribosomal peptide sample (Figure S1).
Figure 3. LC-MS Data and Peptide Identification.
A) Image plot showing a typical LC-MS run in low resolution. Intensity is shown in greyscale. Vertical lines at 322, 622 m/z are reference ions. B) Representative peaks showing isotope distribution. The precursor mass is obtained from the charge state and the m/z value of the ion. C) Identification of peaks in B. Several possible identities are listed, with 15N labeled and unlabeled m/z, number of nitrogens, charge state (z), protein, and peptide sequence. The correct identity is boxed. The 15N peaks exhibit a small M-1 peak due to the small amount of residual 14N in the commercially available 15N ammonium salt.
Peak Identification
The first step in identifying the peak pairs is to generate a list of experimental peaks. This list is generated from the LC-MS data using the Agilent programs MassHunter and MassProfiler, which report the retention time, the m/z of the monoisotopic peak, and the charge state. A theoretical trypsin digest of the set of twenty 30S r-proteins was performed using the UCSF MS-Digest program (http://prospector.ucsf.edu) to generate possible 14N m/z values for the 30S ribosomal subproteome, and the m/z values were calculated for the corresponding 15N peptides based on their molecular formula. The experimental peak list is then compared to the peak list from the theoretical digest of 30S r-proteins to identify the peaks.
The limited set of proteins in the purified 30S subunit samples simplifies the identification process. However, even for a mixture of peptides from 20 small proteins, the high-resolution precursor mass alone is insufficient to unambiguously identify many peaks due to the complexity of the theoretical digest. Ambiguous identities are greatly reduced by including the nitrogen content as an additional criterion for identification.23,25 Features from the experimental peak list are matched as candidate 14N-15N peaks pairs, which have very similar retention times, identical charge states, and m/z values that are similar within a few percent. The number of nitrogens in the peptide can be deduced from the experimental difference in m/z between the 14N peak and the 15N peak, as shown in Figure 3B. An example comparison between theoretical and experimental peaks is shown in Figure 3C. There is a single possible peptide identity that has the correct mass, charge state, and nitrogen content, indicated by a box. Using this strategy, confident identifications can be made for the vast majority of the observed peak pairs. Any peak pairs with ambiguous identities are eliminated from consideration for the quantitative analysis.
A plot of the frequency of ambiguous peak identifications in the 30S protein theoretical digest is shown in Figure 4 as a function of the experimental mass accuracy. Many of the theoretical peaks have similar m/z values, but most of those entries arise from peptides with different numbers of nitrogens. The Agilent ESI-TOF instrument routinely gives a mass accuracy of < 20 ppm, which permits unambiguous identification of 96.4% of theoretical peak pairs in the theoretical digest of the 30S ribosomal subunit. For relatively simple peptide mixtures such as the set of 30S ribosomal tryptic peptides, further analysis such as MS/MS is unnecessary for confident identification. Nevertheless, to verify the identities of the peptides observed using ESI-TOF, an unlabeled sample of ribosomal peptides was analyzed both on a Finnigan LTQ Ion Trap by data-dependent LC-MS/MS and on the Agilent ESI-TOF. Fewer peptides were identified using LC-MS/MS analysis compared to ESI-TOF. Several non-ribosomal proteins were also observed in the MS/MS run. Of the 129 peptides observed in both LC-MS/MS and ESI-TOF analysis, 123 of the identities from the ESI-TOF data were confirmed with the MS/MS data. In typical experimental samples, ~98.5% of peaks can be confidently identified. This limited quantity of mis-identified peaks does not have a significant impact on the data because the quantitated values from several independent measurements from different peptides are averaged for every protein. In a typical dataset from a single timepoint, between 5 and 19 individual peaks derived from 3 to 11 unique peptides are observed and quantitated per protein.
Figure 4. Ambiguity in mass-based peak identification.
A theoretical digest (n ~ 10,000) was searched for peptides with unique identities using two criteria based on varied expectations of mass accuracy. The dashed curve shows the level of ambiguity using only the monoisotopic mass for identification, the solid curve using the monoisotopic mass and the number of nitrogens deduced from a 14N-15N peak pair. For the theoretical digest, peptides with up to 3 missed cleavages were considered, with monoisotopic masses of 200-6000 Da, and charge states z = 1-4. Both unmodified cysteines and carbamidomethylated cysteines were included in the theoretical digest, as well as known modifications.32 The gray area represents the maximum errors (10-20 ppm) obtained in a typical ESI-TOF dataset.
Isotope Ratio Quantitation
After isotope peak pairs have been assigned an identity, they must be quantitated to obtain isotope ratios and protein binding progress curves for each r-protein. The subspectra of individual peak pairs are extracted from the larger dataset prior to quantitation by summing consecutive scans over ~0.2 minutes in the region of interest. The amplitudes of the peak pairs for the 14N and 15N isotopomer of each peptide are obtained using Least-Squares Fourier Transform Convolution (LC-FTC), as described in detail elsewhere.20 Quantitation using LS-FTC to integrate the peak areas is performed on the entire isotope distribution. All of the data points in the peak profile contribute to the integrated intensity, which improves the accuracy of the quantitation. Heavier isotopomers can represent a significant fraction of the total intensity of the peak for larger peptides. The peak fitting procedure provides AU, the amplitude of the unlabeled peak, and AL, the amplitude of the 15N-labeled peak. The fraction of 15N protein is given by fL = AL /(AL + AU).
Briefly, the FTC method of generating theoretical isotope distributions was developed by Rockwood26, and was recently adapted for quantitation using least-squares fitting in our laboratory.20 Based on the molecular formula of the peptide and the isotope abundances, the theoretical spectrum is first calculated as a conjugate Fourier representation in the frequency domain, then inverse Fourier transformed for comparison to the experimental data. The formulas for calculating these spectra allow for variations in the baseline, peak width, mass accuracy, and amplitude of experimental peaks. The enrichment of 15N in the labeled peptides is held fixed during the fitting at 99.3%, which was the empirically observed 15N enrichment in the samples, although this quantitation approach can be applied to peptides labeled in any proportion. An example extracted individual peak-pair spectrum with the least-squares fit is shown in Figure 5A.
Figure 5. Standard Curve Demonstrating Quantitation.
A) Example LC-MS peak pair showing data (circles) and least squares fit (line). B) Known mixtures of 14N and 15N r-proteins were used in a 30S reconstitution. Peptides from all proteins were pooled to calculate standard deviations and linear fit. C) Fraction 15N, fL = AL / (AU + AL), of r-proteins from 10 sec time point from a standard condition reconstitution experiment. Individual peptide measurements are shown as red dashes, and the resulting average fL values are shown with open circles. Error bars are ± one standard deviation. The average number of observed peaks is 16 ± 7.
For large datasets of several hundred peaks, an automated fitting procedure is applied to the set of extracted individual peak pair spectra. Although the fitting procedure is robust, the fits for ~15-25% of extracted spectra fail to converge due to noisy data or overlapping peaks interfering with the fit. These unconverged fits are recognized by their nonsensical parameters and the corresponding extracted spectra are automatically eliminated from further consideration. The fitted spectra are visually inspected, and peak pairs that are overlapped or incorrectly paired are also eliminated from the analysis. The fraction labeled (fL) values for each protein are obtained by averaging the values from the set of peptides observed, and the standard deviation of each set is used as an estimate of the quantitation error for each protein.
In order to demonstrate the accuracy of the quantitation procedure, 30S reconstitutions were performed with mixtures of 14N and 15N r-proteins in five known proportions. The fraction 15N data are shown in Figure 5B for each dataset, plotted against input 15N fraction. The correlation between observed fraction 15N signal intensity and input fraction 15N protein is excellent. The standard deviations for the measured fraction labeled values are all less than 0.02, which is an improvement over errors of 0.03-0.04, which were seen with similar experiments with MALDI of whole proteins.11
A typical time point from a pulse-chase experiment with proteins bound to varying extents is shown in Figure 5C. The small errors in this experimental data illustrate both the precision of the quantitation and the accuracy of the identification strategy. Since peptides from different proteins have different isotope ratios due to their different binding kinetics, inaccurately identified peptides would increase the errors in fraction labeled values. Occasional outliers are usually due to mis-identified peaks and are eliminated from further analysis. This excellent quantitation strategy enables measurement of more accurate kinetic curves that better define multiphasic kinetics.
Assembly Kinetics
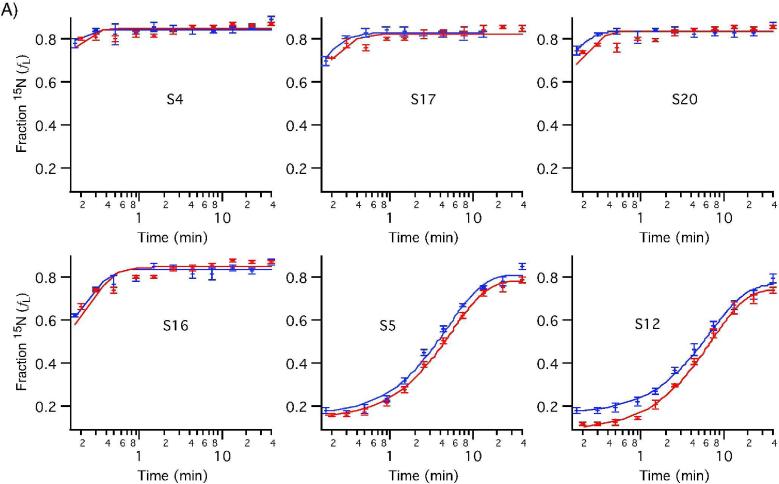
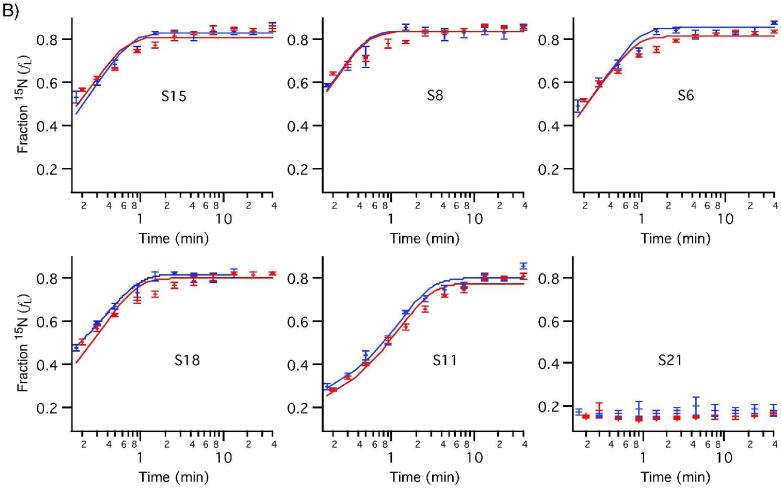
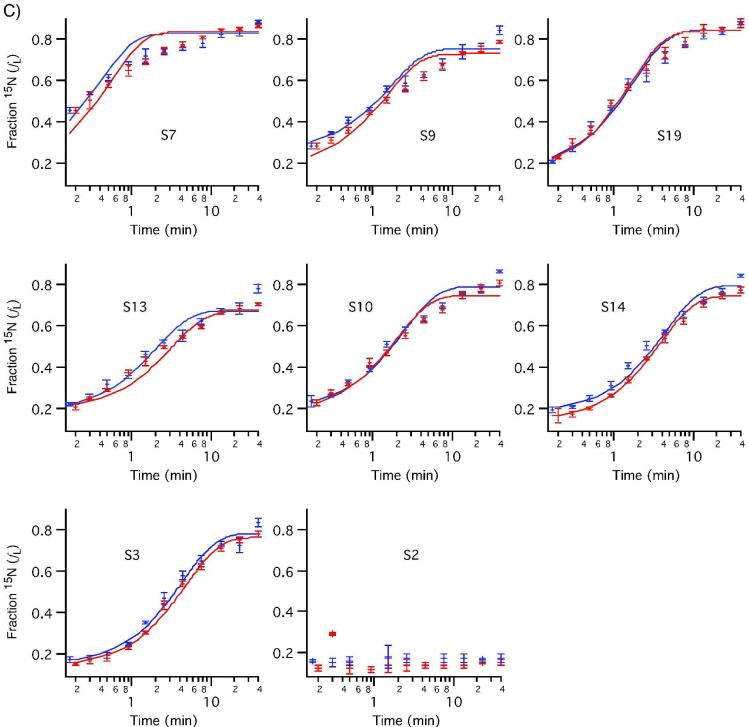
The 30S in vitro assembly kinetics were examined under standard conditions (40°C) using ESI-TOF-PC/QMS of tryptic peptides. Stable-isotope labeled proteins were incubated with 16S rRNA for varied amounts of time before the assembly reaction was chased with an excess of unlabeled protein. Peak pairs from 12 time points between 0 and 40 minutes were identified and their isotope ratios quantitated using LS-FTC. Individual peptides from the same protein have very similar binding kinetics, as shown in Figure S2. The average fraction labeled (fL) values for all peptides from each protein are plotted against experimental time points for two independent experiments to show r-protein binding progress curves in Figure 6. These progress curves were fit to a single exponential using the standard deviation of the fraction labeled for the set of peptides observed at each time point to weight the fit. The data for S7 clearly do not fit the single exponential curve, indicating multiphasic kinetics. This is the first time that data from all twenty 30S r-proteins have been recorded in a single experiment, as S7 and S2 were not observable in previous kinetic experiments using MALDI.
Figure 6. Protein binding progress curves measured by PC/QMS with LC-ESI-TOF.
Curves from two experiments are shown, with curves fit to single exponentials (red and blue). Observed binding rates are reported in Table S1. A) 5' domain proteins B) Central domain proteins C) 3' domain proteins. S7 and S9 show multiphasic binding kinetics.
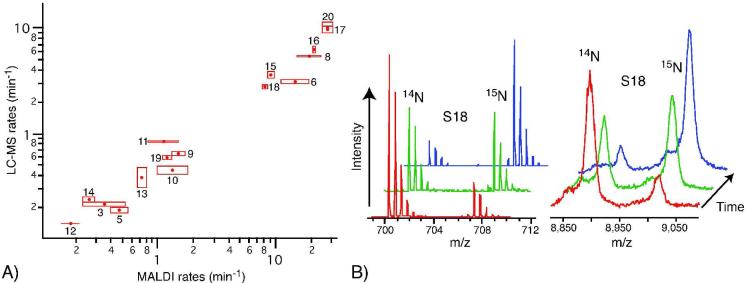
The protein-binding rates observed were generally similar to those previously reported.11 Figure 7A shows a log-log plot of the rates observed using MALDI and the rates reported here, with LC-MS. The pattern of the rates is the same between the two methods, and most LC-MS kobs values (Table S1) are within a factor of two of their counterparts in the MALDI data set. Figure 7B illustrates the difference in the primary data acquired by these two methods, where the S18 peak for several time points as observed in MALDI and an S18 peptide from similar time points observed with LC-MS are shown. There is a dramatic improvement in signal-to-noise ratio for the LC-MS method, which contributes to the superior quantitation.
Figure 7. Progress curves and comparison with MALDI method.
A) Comparison of rates obtained using MALDI and LC-MS. Boxes indicate the range of values in two experiments. S2 and S7 were not observed in MALDI spectra. S4 is not shown because the binding transition was too fast to accurately observe. B) S18 peaks from MALDI and LC-MS. Left panel shows an S18 peptide observed with LC-MS. Right panel shows protein S18 observed with MALDI.
S7 is the sole primary binding protein in the 3' domain and nucleates the 3' domain assembly,27 which is the slowest domain to assemble in vitro at all temperatures. The overall rate is reported here for the first time, and is consistent with previous qualitative findings.6 The multiphasic kinetics of S7 are likely due to the presence of several alternate pre-30S particles in different regions of the assembly landscape binding S7 at different rates. This observation is consistent with in vitro assembly proceeding through multiple parallel pathways.11,12 S9, a 3' domain protein dependent on S7 at equilibrium, also shows multiphasic kinetics (Figure S3). Multiphasic kinetics have previously been observed for S8 and S15 at 15°C conditions using MALDI-PC/QMS.11
Binding rates for proteins S2 and S21 could not be determined because those proteins exhibited low values of fL for all time points.11 The observed value of fL for S2 and S21 was approximately equal to the fraction of labeled protein in the reconstitution after the chase was added (1:5), suggesting that the proteins present in the final 30S subunits bound during the chase. However, it is unlikely that these proteins were entirely unbound during the pulse, since S2 and most other 30S r-proteins loosely associate with their binding sites very quickly, as shown by recent time-resolved hydroxyl radical footprinting experiments.28 For technical reasons, these experiments provided only limited information about the binding kinetics of S2 and S21. In our PC/QMS experiments, it is likely that S2 and S21 have a fast off-rate in reconstitution buffer, and bound protein exchanges with excess protein in solution during the chase. If these proteins did bind transiently, it might be expected that some S2 and S21 would also be lost during sucrose gradient purification under non-equilibrium conditions. The stoichiometries of S2 and S21 are somewhat less than that of other ribosomal proteins (Figure S4). We also observed S2 and S21 exchange from native 30S subunits under reconstitution conditions (Figure S5), which is consistent with previous reports suggesting exchange during or after 30S subunit purification.29,30,31 Exchange is a fundamental limitation to any pulse-chase strategy, but fortunately, the exchange rates of 18 of 20 proteins are sufficiently slow to permit measurement of their binding kinetics using PC/QMS.
Conclusions
We have developed an improved general LC-MS-based method for monitoring self-assembly in vitro. A high degree of accuracy and precision was achieved in quantitation of relative amounts of 14N and 15N peptides. This PC/QMS method could be applied to any self-assembling particle that can be reconstituted and separated from individual components. The binding rates of eighteen of the twenty 30S r-proteins have been measured for the first time in a single experiment using PC/QMS. A complete progress curve for S7 shows multiphasic kinetics, providing evidence for multiple pre-30S intermediate species assembling through different pathways.
Supplementary Material
Acknowledgements
The authors thank Dr. Michael T. Sykes and Dr. Zahra Shajani for critical comments on the manuscript. The authors also thank Dr. Michael T. Sykes for programs that assist with data analysis. This work was supported by NIH grant R37-GM53757 to J.R.W.
Footnotes
Supporting Information Available: This material is available free of charge via the internet at http://pubs.acs.org
References
- (1).Kaczanowkska M, Rydén-Aulin M. Microbiology and Molecular Biology Reviews. 2007;71:477–494. doi: 10.1128/MMBR.00013-07. [DOI] [PMC free article] [PubMed] [Google Scholar]
- (2).Hardy SJSK,CG, Voynow P, Mora G. Biochemistry. 1969;8:2897–2905. doi: 10.1021/bi00835a031. [DOI] [PubMed] [Google Scholar]
- (3).Traub P, Nomura M. Proceedings of the National Academy of Sciences. 1968;59:777–784. doi: 10.1073/pnas.59.3.777. [DOI] [PMC free article] [PubMed] [Google Scholar]
- (4).Held WA, Ballou B, Mizushima S, Nomura M. The Journal of Biological Chemistry. 1974;249:3103–3111. [PubMed] [Google Scholar]
- (5).Culver GM. Biopolymers. 2003;68:234–249. doi: 10.1002/bip.10221. [DOI] [PubMed] [Google Scholar]
- (6).Powers T, Daubresse G, Noller HF. J Mol Biol. 1993;232:362–374. doi: 10.1006/jmbi.1993.1396. [DOI] [PubMed] [Google Scholar]
- (7).Weitzmann CJ, Cunningham PR, Nurse K, Ofengand J. FASEB J. 1993;7:177–180. doi: 10.1096/fasebj.7.1.7916699. [DOI] [PubMed] [Google Scholar]
- (8).Recht MI, Williamson JR. J Mol Biol. 2004;344:395–407. doi: 10.1016/j.jmb.2004.09.009. [DOI] [PubMed] [Google Scholar]
- (9).Samaha RR, O'Brien B, O'Brien TW, Noller HF. Proc Natl Acad Sci U S A. 1994;91:7884–7888. doi: 10.1073/pnas.91.17.7884. [DOI] [PMC free article] [PubMed] [Google Scholar]
- (10).de Narvaez CC, Schaup HW. J Mol Biol. 1979;134:1–22. doi: 10.1016/0022-2836(79)90411-x. [DOI] [PubMed] [Google Scholar]
- (11).Talkington MW, Siuzdak G, Williamson JR. Nature. 2005;438:628–632. doi: 10.1038/nature04261. [DOI] [PMC free article] [PubMed] [Google Scholar]
- (12).Nomura M. Science. 1973;179:864–873. doi: 10.1126/science.179.4076.864. [DOI] [PubMed] [Google Scholar]
- (13).Bantscheff M, Schirle M, Sweetman G, Rick J, Kuster B. Anal Bioanal Chem. 2007;389:1017–1031. doi: 10.1007/s00216-007-1486-6. [DOI] [PubMed] [Google Scholar]
- (14).Smith JC, Lambert JP, Elisma F, Figeys D. Anal Chem. 2007;79:4325–4343. doi: 10.1021/ac070741j. [DOI] [PubMed] [Google Scholar]
- (15).Huttlin EL, Hegeman AD, Harms AC, Sussman MR. Mol Cell Proteomics. 2007;6:860–881. doi: 10.1074/mcp.M600347-MCP200. [DOI] [PubMed] [Google Scholar]
- (16).Snijders AP, de Koning B, Wright PC. J Proteome Res. 2007;6:97–104. doi: 10.1021/pr0602139. [DOI] [PubMed] [Google Scholar]
- (17).Aebersold R, Goodlett DR. Chem Rev. 2001;101:269–295. doi: 10.1021/cr990076h. [DOI] [PubMed] [Google Scholar]
- (18).Smith RD, Anderson GA, Lipton MS, Pasa-Tolic L, Shen Y, Conrads TP, Veenstra TD, Udseth HR. Proteomics. 2002;2:513–523. doi: 10.1002/1615-9861(200205)2:5<513::AID-PROT513>3.0.CO;2-W. [DOI] [PubMed] [Google Scholar]
- (19).Zimmer JS, Monroe ME, Qian WJ, Smith RD. Mass Spectrom Rev. 2006;25:450–482. doi: 10.1002/mas.20071. [DOI] [PMC free article] [PubMed] [Google Scholar]
- (20).Sperling E, Bunner AE, Sykes MT, Williamson JR. Analytical Chemistry. 2008;80:4906–4917. doi: 10.1021/ac800080v. [DOI] [PMC free article] [PubMed] [Google Scholar]
- (21).Domon B, Aebersold R. Science. 2006;312:212–217. doi: 10.1126/science.1124619. [DOI] [PubMed] [Google Scholar]
- (22).Staehelin TM,DR. Methods in Enzymology. 1971;20:449–456. [Google Scholar]
- (23).Snijders AP, de Vos MG, Wright PC. J Proteome Res. 2005;4:578–585. doi: 10.1021/pr0497733. [DOI] [PubMed] [Google Scholar]
- (24).Zhang R, Regnier FE. J Proteome Res. 2002;1:139–147. doi: 10.1021/pr015516b. [DOI] [PubMed] [Google Scholar]
- (25).Nelson CJ, Huttlin EL, Hegeman AD, Harms AC, Sussman MR. Proteomics. 2007;7:1279–1292. doi: 10.1002/pmic.200600832. [DOI] [PubMed] [Google Scholar]
- (26).Rockwood AL, Van Orden SL, Smith RD. Analytical Chemistry. 1995;67:2699–2704. doi: 10.1021/ac00110a027. [DOI] [PubMed] [Google Scholar]
- (27).Nowotny V, Nierhaus KH. Biochemistry. 1988;27:7051–7055. doi: 10.1021/bi00418a057. [DOI] [PubMed] [Google Scholar]
- (28).Adilakshmi T, Bellur DL, Woodson SA. Nature. 2008 doi: 10.1038/nature07298. [DOI] [PMC free article] [PubMed] [Google Scholar]
- (29).Ulbrich B, Nierhaus KH. Eur J Biochem. 1975;57:49–54. doi: 10.1111/j.1432-1033.1975.tb02275.x. [DOI] [PubMed] [Google Scholar]
- (30).Subramanian AR, van Duin J. Mol Gen Genet. 1977;158:1–9. doi: 10.1007/BF00455113. [DOI] [PubMed] [Google Scholar]
- (31).Robertson WR, Dowsett SJ, Hardy SJ. Mol Gen Genet. 1977;157:205–214. doi: 10.1007/BF00267399. [DOI] [PubMed] [Google Scholar]
- (32).Arnold RJ, Reilly JP. Anal Biochem. 1999;269:105–112. doi: 10.1006/abio.1998.3077. [DOI] [PubMed] [Google Scholar]
Associated Data
This section collects any data citations, data availability statements, or supplementary materials included in this article.


