

Abstract
Cathepsin B, a ubiquitous lysosomal cysteine protease, is involved in many biological processes related to several human diseases. Inhibitors targeting the enzyme have been investigated as possible diseases treatments. A set of 37 compounds were recently found active in a high throughput screening assay to inhibit the catalytic activity of Cathepsin B, with chemical structures and biological test results available to the public in the PubChem BioAssay Database (AID 820). In the present study, we compare these experimental activities to the results of theoretical predictions from binding affinity calculation with a LR-MM-PNSA approach based on docked complexes. Strong correlations (r2 = 0.919 and q2 = 0.887 for the best) are observed between the theoretical predictions and experimental biological activity. The models are cross-validated by four independent predictive experiments with randomly split compounds into training and test sets. Our results also show that the results based on protein dimer show better correlations with experimental activity when compared to results based on monomer in the in silico calculations.
Keywords: Cathepsin B protein, free energy of binding, virtual screening, modeling, drug design, regression, PubChem
Introduction
Cathepsins such as cathepsin B, D, H, K, L, and S are responsible for intracellular proteolysis in mammalian cells and are involved in biological processes related to variant diseases and disorders.1–4 Cathepsin B, a member of the papain superfamily,3 has been found involved in biological processes related to important human diseases, including neurodegenerative disorder, cardiovascular disease, cancer, inflammation, rheumatoid arthritis, and Alzheimer s disease.5–12 As one of the most abundant proteases found in mammalian cells, the enzyme was found to facilitate cell migration, thus to promote tumor metastasis and angiogenesis by mediating the dissolution of extracellular barriers.13–15 Researchers also found that the proteolysis function of the enzyme is essential to the entry and replication of several viruses such as Ebola and SARS.16 For these reasons cathepsin B has been selected as an important molecular target in drug development,17–19 and some inhibitors have been reported to show effect in the treatment of rheumatoid arthritis in animal experiments.5–12
Biology studies have shown that most cathepsin inhibitors can bind to the target protein irreversibly, while some bind reversibly. The irreversible inhibitors include dipeptidyl nitriles20, vinyl sulfones, expoxysuccinates, acyloxymethyl ketones, hydrazides, bis-α-amidoketones and fluoromethyl ketones.21 The reversible inhibitors include some α-ketoamide and aldehyde compounds.21 Experimental structure biology studies reveal that cathepsin inhibitors react with the catalytic thiol group and form a covalent bond with the enzyme.20,22 The structure complexes of cathepsin B and several inhibitors are available in the public domain. For example, the inhibitory mechanism of the dipeptidyl nitriles to the enzymatic catalysis of cathepsin B protein has been explored by structural biology study, which provided valuable information to the inhibition of active compounds to the enzyme.23–25
An alternative way to study the binding structure of a newly identified inhibitor with its receptor is by docking simulations. This methodology has been successfully used in many applications, including the study for the cathepsin L inhibitors.26 On the other hand, the general application of binding affinity calculation still remains a challenging task after many years of development. MM-PBSA, a method for computing binding affinity based on molecular mechanics (force field) and electrostatic calculation (Poisson Boltzmann (PB) or Generalized Born (GB)), was proposed and has been successfully applied to several studies.27–30 However it does not work universally. LR-MM-PBSA was proposed to address the problem of poor correlation between calculated and observed binding activity with the realization that there is no need to pursue the calculation of absolute free energy of binding for a set of compounds in drug development. In such situation a relative binding affinity is enough to rank a given set of compounds to facilitate molecular design.27–33 Both approaches will be compared in the current work.
The NIH Molecular Libraries project was aimed to discover small chemical as molecular probe, and to make such research tool available to the scientific community for the study of cellular biological function. A number of national wide screening centers were funded to perform industrial level HTS screening experiments. The resulted biological testing results from this US government initiated effort are made available through PubChem (http://pubchem.ncbi.nlm.nih.gov), a database containing data of chemical structures and the associated biological activity information. PubChem BioAssay database now contains about 30 million biological test results for over 200 protein targets. Such information is made freely accessible to world wide research community. PubChem also links the chemical structures and biological test results to PubMed articles and protein 3D information. Altogether these information provides unprecedent challenges as well as opportunities for researchers to explore the molecular mechanism between enzymes and their small molecular inhibitors.
With the HTS screening efforts of the NIH Molecular Libraries project, several series of compounds have been identified which demonstrate various inhibitory potency against cathepsin B and other cathepsins. The availability of the molecular structures and their biological activities in the PubChem database provides a unique opportunity for researchers to conduct structure-activity study in an effort to identify the key structure features responsible for the observed biological activity, and to explore the biological mechanism of these inhibitors. Such study will doubtlessly help the discovery of new lead compounds and facilitate the development of new inhibitors for therapeutic purposes to treat diseases related cathepsin malfunctions. Several works were reported to use computational approaches, such as docking and virtual screening, to study the binding mode of cathepsin L26 and cathepsin S26 inhibitors to their receptors. Given the importance of cathepsin B in disease treatment and the availability of highly selective inhibitors, we performed docking and binding affinity studies for a set of cathepsin B inhibitors in an effort to understand the binding and interaction mechanisms of the inhibitors in the protein, and to establish a model for binding affinity evaluation to facilitate the development of novo cathepsin B inhibitors.
Materials and Methods
Molecular Coordinates and Bioactivity Information
The small molecule dataset of Cathepsin B inhibitors and their inhibition activity data were taken from the PubChem database. The biological activity of these compounds was measured based on a dose response confirmatory screening experiment (PubChem BioAssay ID: 820), where the inhibitory activity for a total of 75 compounds was tested by the Center for Molecular Discovery of University of Pennsylvania, and 37 compounds were confirmed with inhibitory activity against the catalytic activity of the human liver cathepsin B. Detailed information for the assay protocol and materials is available on the PubChem website.
The 2D structure of this set of small molecules was obtained from PubChem chemical library. 3D structures were generated and optimized using the Molecular Operating Environment (MOE) program (Chemical Computing Group, Montreal, Canada) and OPLS force field.34–37 The structure and biological activity of the 37 active compounds are listed in Table 1.
Table 1.
The calculated energies(kcal/mol) for the 34 active compounds and their observed activities IC50(micro molar).
| Compound CID | Evdw | Ecoul | Eburied | Edesolv | LiaScore | logIC50 | IC50 |
|---|---|---|---|---|---|---|---|
| 66541 | −30.697 | −14.979 | −17.015 | 26.036 | −3.167 | −7.336 | 0.046 |
| 286532 | −50.737 | −9.918 | −30.134 | 56.564 | −5.024 | −4.941 | 11.458 |
| 573353 | −41.634 | −7.670 | −27.060 | 48.462 | −5.420 | −4.470 | 33.855 |
| 646525 | −46.489 | −36.775 | −29.432 | 55.472 | −6.869 | −5.701 | 1.990 |
| 646749 | −46.871 | −7.250 | −31.063 | 36.261 | −5.372 | −4.911 | 12.265 |
| 647501 | −37.698 | −29.386 | −22.601 | 42.665 | −4.108 | −7.149 | 0.071 |
| 647599 | −44.877 | −24.352 | −28.495 | 49.597 | −6.213 | −5.899 | 1.261 |
| 648315 | −48.956 | −31.241 | −31.044 | 70.462 | −6.880 | −5.197 | 6.356 |
| 651936 | −45.502 | −28.447 | −27.055 | 73.615 | −5.286 | −5.757 | 1.749 |
| 653297 | −37.210 | −28.945 | −22.411 | 41.200 | −3.890 | −7.141 | 0.072 |
| 653316 | −46.112 | −28.645 | −27.833 | 89.102 | −5.588 | −4.351 | 44.577 |
| 653862 | −45.975 | −5.643 | −28.680 | 15.036 | −5.374 | −6.035 | 0.924 |
| 654815 | −29.000 | −31.463 | −20.876 | 73.897 | −4.062 | −5.674 | 2.120 |
| 655490 | −47.636 | −16.948 | −32.034 | 41.336 | −5.093 | −5.019 | 9.563 |
| 658111 | −45.061 | −9.738 | −30.618 | 44.900 | −4.878 | −5.173 | 6.715 |
| 658152 | −44.791 | −15.181 | −28.953 | 61.448 | −4.269 | −4.706 | 19.686 |
| 658724 | −45.966 | −15.202 | −29.141 | 51.670 | −5.497 | −5.049 | 8.927 |
| 658964 | −49.495 | −13.918 | −30.951 | 68.423 | −5.557 | −4.398 | 39.987 |
| 660829 | −46.254 | −12.867 | −30.506 | 67.014 | −4.626 | −4.415 | 38.471 |
| 665480 | −50.925 | −56.745 | −34.874 | 100.539 | −7.734 | −5.680 | 2.087 |
| 714967 | −35.345 | −16.301 | −26.498 | 53.169 | −5.351 | −4.848 | 14.196 |
| 794694 | −39.633 | −12.704 | −25.322 | 50.337 | −3.236 | −5.380 | 4.170 |
| 971438 | −42.854 | −26.730 | −27.051 | 87.288 | −4.990 | −4.430 | 37.190 |
| 1506381 | −40.062 | −28.161 | −29.316 | 57.757 | −5.075 | −4.338 | 45.971 |
| 2212050 | −40.050 | −10.095 | −26.101 | 34.337 | −4.494 | −5.148 | 7.114 |
| 2997948 | −41.040 | −25.569 | −26.094 | 31.000 | −5.413 | −5.499 | 3.171 |
| 3236798 | −48.543 | −39.531 | −27.166 | 64.312 | −7.190 | −5.926 | 1.185 |
| 3240114 | −51.963 | −17.877 | −29.886 | 46.854 | −7.284 | −6.160 | 0.692 |
| 3241895 | −45.796 | −42.088 | −29.050 | 59.580 | −7.204 | −6.362 | 0.435 |
| 3243025 | −30.213 | −10.194 | −20.357 | 31.897 | −3.141 | −6.073 | 0.845 |
| 3243128 | −46.514 | −31.889 | −27.885 | 53.859 | −7.259 | −6.608 | 0.247 |
| 3243168 | −44.340 | −69.258 | −27.633 | 127.608 | −5.920 | −5.067 | 8.563 |
| 3250046 | −57.285 | −51.821 | −35.654 | 106.354 | −7.620 | −4.736 | 18.349 |
| 5293426 | −55.310 | −52.540 | −33.611 | 85.088 | −7.898 | −5.648 | 2.247 |
● Evdw and Ecoul are the vdW and electrostatic interaction energies between ligand and receptor calculated by Liaison module of GLIDE based on OPLS force field, respectively. Eburied and Edesolv are the non-polar and polar parts of solvation energy calculated using Poisson Boltzmann method (ZAP), respectively. The unit for these energies is kcal/mol.
The three dimensional complex structure of cathepsin B with Dipeptidyl Nitrile (DPN) was obtained from the Protein Data Bank (PDB entry: 1GMY).20 To prepare for the docking experiment, the original protein coordinates were extracted from the PDB file and were submitted to Glide following the protocol for adding hydrogen atoms and assigning partial charges using the OPLS-AA force field. 34–37 A coarse energy minimization with a small number of steps was performed for the complex structure to relax amino residue side chains and the added hydrogen atoms. The ligand was used to determine the location of a docking grid box and was then removed prior to grid generation in next step.
Binding Modes by Docking Simulation
The ligand compounds were docked into the ligand binding site of the prepared protein receptor using the GLIDE program (FirstDiscovery suite)38,39 and the OPLS-AA force field34–37. Monte Carlo sampling method were used with GLIDE. Small molecules are treated flexibly by GLIDE docking through an extensive conformational search while the receptor is held fixed.
Compounds with less than 200 atoms and less than 35 rotatable bonds were docked into the binding site by GLIDE. Conformational flexibility of the ligand was considered by generation of rotamers from explicit rotation of single-bond torsion angles. All rotamers for a given ligand were docked and oriented in the site, and grid-refinement was executed for 5000 poses. The top 400 refined poses per each ligand were subjected to 100 steps of conjugate gradient energy minimization. Poses of a given compound were not saved unless they differed from those obtained previously by more than 0.5 Å rms deviations in heavy atom coordinates, or involve atomic displacements by greater than 1 Å.
Calculation of Free Energy of Binding (FEB)
The LR-MM-PBSA approach, which has been applied to the study of HIV-1 RT non-nucleoside inhibitors and heparanase inhibitors by the author31, was used to calculate the FEB based on the docked cathepsin inhibitor structure complex. This approach is based on linear response (LR) and a FEB calculation using the molecular mechanics, Poisson-Boltzmann, and solvent accessible surface area (MM-PBSA) method27–32. With this approach, the binding affinity was estimated by combining empirical MM-PBSA energy calculation with linear response optimization of coefficient against known activity.
The protein-ligand complex obtained from docking calculations was partially minimized by allowing the ligand and the side chains of the protein receptor within 7Å of the ligand atoms to move while all other atoms were held fixed. The electrostatic energy (Eele) and van der Waals (vdW) energy were calculated using molecular mechanics (MM) based on the OPLS-AA force field. The polar part of the solvation energy was calculated using the Poisson-Boltzmann method and the non-polar part of the solvation energy was estimated by the change of the solvent accessible surface area (SASA) as determined by the ZAP program.40,41 After all energies were calculated, factor analysis (FA) and multiple regression analysis (MRA) were performed to derive a LR-like equation:
| (1) |
where a, b, c, and d are the weighting factors, ΔE is the energy difference between ligand/receptor complex and the free protein plus the ligand:
| (2) |
Results and Discussion
Docking results for the original ligand in the crystal structure complex
Although numeric applications have demonstrated the success of GLIDE in docking simulations for reproducing experimental binding structures, it remains a question whether it works for the particular biological system of one s interest. In order to examine the reliability of the docking method, a series of docking simulations were carried out to dock the original DPN ligand back to the ligand binding site of the cathepsin B protein complex structure (PDB code: 1GMY). The structure data obtained from the PDB entry contains three sets of coordinates corresponding to chain A, B and C respectively. The first and the first two sets of coordinates for the protein and DPN inhibitor were extracted and used in the monomer and dimer docking simulations, respectively. Water molecules were excluded in the docking simulations.
A docking grid was generated with a geometric center at the center of the ligand. It enclosed the whole binding site region, and covered an area about 5 Å larger than the dimension of the original ligand on each side. The DPN ligand was removed prior to the grid calculation, it was then docked back into the binding pocket based on newly-generated docking grid. The same grid were used in later docking simulations for all other inhibitors. The docked results were clustered and ranked by Gscore. The 20 binding conformations were outputted for each compound. The Gscore, Emodel, and binding energy calculated through the docking simulation for the set of compounds are listed in Table S1 of the supporting material along with experimental bioactivity, molecule formula, name, docking scores and some other information. The structure superposition between the conformation from the docking simulation and that of the crystallographic structure complex is shown in Figure 1. The root-mean-square deviations (RMSDs) of all heavy atoms of DPN between the docked poses and the crystallographic coordinates range from 0.4 Å to 1.1 Å (when six carbons of the methyl-phenyl ring are not distinguished). The biggest variance is observed at the nitrile group and the methyl-benzyl group which flips over 180 degree compared to the original conformation. Apart from that, the docked pose is overall very close to the experimental structure. These results show that the docking method is able to reproduce the experimental binding structure of cathepsin B- inhibitor complex.
Figure 1.
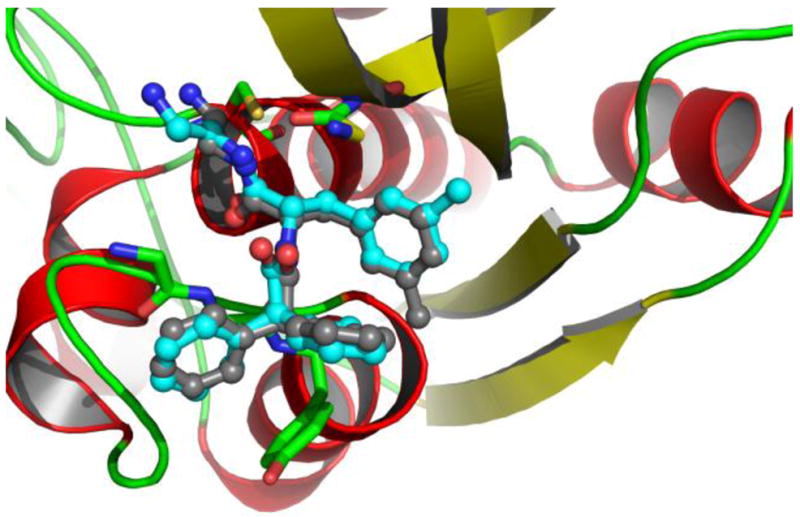
The top ranked conformation of inhibitor DPN from the docking simulation (carbon in cyan) compared with the original bound structure (carbon in grey) from crystallographic structure. The protein is shown with cartoon-ribbon and colored based on secondary structures.
Docking of other ligands from crystal complexes into the cathepsin B
The docking protocol employed in this study is further evaluated by taking the advantage of the availability of abundant cathepsin B crystal structures in complex with various ligands. 11 additional ligands taken from the crystal structures of cathepsin B complexes (PDB codes: 2DC6, 2DC7, 2DC8, 2DC9, 2DCA, 2DCB, 2DCC, 2DCD)22 were docked into the inhibitor binding site of 1GMY, the crystal structure of cathepsin B in complex with DPN(see the previous section). The availability of these experimental binding structures gives a unique opportunity to evaluate the docking protocol in the prediction of Cathepsin B-inhibitor binding structures. Prior to the comparison, all other complex structures were superimposed to the cathepsin B-DPN complex where protein alpha carbon atoms were optimally overlapped. The docking results (Figure 2) show that the docked poses of these compounds are close to their corresponding bound structures in crystallographic complexes. The RMSDs of heavy atoms between the docked and the crystallographic conformation for these ligands range from 0.5 Å to 1.2 Å. These results again indicate that the docking simulation method is able to reproduce precisely the bound structure of experimental complex for ligands from different chemical structure classes.
Figure 2.

The docked inhibitor compared with its original bound structure in crystallographic complex by superimposing the two protein coordinates together. It is seen that the docked structure is very close to the original structure even they are from different protein coordinates. A: Ligand 73V (ligand taken from cathepsin B complex 2DC6). Grey: original bound structure in crystal complex; Cyan: the docked. B: Ligand 77B (ligand taken from cathepsin B complex 2DCC). Grey: original bound structure in crystal complex; Magenta: the docked.
Docking of ligands from crystal complexes into the dimer of cathepsin B
In the experimental structure from the crystallographic study, NDP binds in between a protein dimer, where part of the binding sites of NDP consist of residues from the first protein chain, while the rest binding sites are contributed by the second protein chain. To evaluate the effect of the second protein on the docking results, further docking experiments have been conducted for the inhibitors in the known crystal structure complexes, where the dimer of the cathepsin B crystal structure was used in all simulations. The docking results reveal that these compounds bind well in the binding pocket of the dimer. By comparing the docking results of the same compound in monomer and dimer, it is noticed that docked poses overlay largely. The dominating cluster of the docked poses obtained from the dimer calculation for each ligand is similar to that from the monomer calculation. In addition, these docked poses were compared with the crystal structure by superposing the alpha carbon atoms of the proteins; again the docked poses are similar to the corresponding crystal structures and the docking simulation based on the dimer of cathepsin B protein structures reproduced the experimental binding structures for these inhibitors.
As shown in Figure 4A, the compound is properly located in the binding site interacting with the primary (in red) protein as well as with the second (in green) protein. Over ¾ part of the inhibitor directly interacts with residues from the primary protein, while less than ¼ part of the inhibitor directly contacts with the second protein. The primary protein has made major contacts with the inhibitor, meanwhile the second one also makes contributions to the binding by closing up the solvent-exposed cleft to form a hydrophobic-liked pocket in favor of a hydrophobic substituent in an inhibitor, which may benefit the overall ligand binding affinity of the inhibitor by decreasing solvent-exposed surface area.
Figure 4.

The docked inhibitors in the active site of cathepsin B protein dimer. The primary protein is colored in red and the second one is colored in green. A: The two ligands from crystal complexes (magenta: 77B and cyan: 73V) and original DPN (grey) docked in the active site. The proteins are depicted in surface mode. The ligand is depicted with stick-ball mode in blue. B: Compound 77B (magenta) and CID 3243128 (cyan) docked in the active site. C: Compound DPN (grey), CID 653297 (magenta), and CID 647501 (cyan) docked in the active site. Protein is depicted in cartoon mode in the latter two figures.
Binding modes of the 37 active inhibitors in cathepsin B
The 37 active compounds with confirmed inhibition activity identified from PubChem BioAssay database(AID:820) were docked into the cathepsin B protein structure to explore the binding modes and the interactions between the enzyme and these small molecules. The PubChem chemical structure identifier (CID), biological activity (IC50), IUPA name, molecular formula, and molecular weight of these compounds are listed in Table 1 and Table S1 in supporting materials. Some other information can be obtained from the PubChem website based on the CID and AID. The IC50 was calculated based on a dose-response experiment where 75 compounds were further verified for their biological activity for inhibiting the catalytic activity of the human liver cathepsin B. The assay was conducted by measuring the release of the fluorophore aminomethyl coumarin (AMC) from the hydrolysis of an AMC-labeled dipeptide. These 75 compounds were initially found to exhibit inhibitory activity to cathepsin B in a high throughput primary screening assay (AID: 453) out of 6332 tested compounds.
Both the monomer and dimer of the cathepsin B protein structure were used in the docking of the 37 compounds. The same docking protocol introduced in the previous experiments was used in these docking simulations. The best docked pose was picked for each compounds based on docking score (Gscore) and visual examination from the dominating cluster out of each respective docking simulation. Docked poses were visually checked to evaluate the interaction modes (Figure 3 and 4). All compounds can be docked into the binding sites and the overlap of these poses provides a general picture of the binding mode, from which it can be seen that the core of the binding site defined by original inhibitors in crystal complexes are occupied with much higher density by the compound atoms. A cluster of ligand is shown in Figure 3, where the docked poses are overlapped. These ligands occupy in the roughly same binding pocket. The overlap (Figure 3) of the 5 most active compounds shows that they were docked in a very similar pattern in which part of the molecules occupy the binding sites where the original DNP ligand is located. The second protein in the dimer (Figure 4A) shows direct interactions with all of these inhibitors and have contributed to the binding. When smaller molecules, such as CID 653297 and CID 647501, bind to the active site of the protein dimer, they have direct interactions with residues Gly27, Cys29, Gly198, Gly73, and Gly74 of the primary protein as well as with resides Gly197, Gly198, and Phe174 of the second protein (Figure 4C). For bigger molecules, such as 77B and CID 3243128, when binding in the active site (Figure 4B), additional interactions were observed between these compounds and residues His199 and Trp211 of the second protein.
Figure 3.

The cluster of the five most active inhibitors and DPN docked to Cathepsin B protein. The protein is shown in cartoon colored by secondary structure mode. The compounds are depicted in stick mode. Grey: DPN; red: CID 6654; green: CID 647501; magenta: CID 653297; cyan: CID 3243128; orange: CID 3241895.
The docking scores of these compounds are listed in Table S1 in supporting materials. The Gscore, which is used in GLIDE to evaluate the docking results, ranges from −3.44 to −7.04. The logIC50 of the 37 compounds also fall in a similar range between −4.35 to 7.34, for these compounds. However, with close examination by plotting docking scores and binding energy vs. the experimental activity data (logIC50), no apparent correlation was observed. Also there is not apparent correlation observed between Emodel, or the interaction energy (EvdW + Ecoul) from docking calculation and the experimental logIC50.
Binding affinity calculations
A number of methods and approaches have been suggested and applied to many applications for the calculation of free energy of binding (FEB). MMPBSA approach, which has approach involves calculation of several energy terms, including been applied in many studies, was elected in the work. This van de Waals(vdW) energy, electrostatic energy between the ligand and receptor, and the solvent energy upon ligand s movement from solvent to binding site. The vdW and electrostatic energies were calculated using the GLIDE program based on OPLS force field, and the solvation energy for binding was calculated using Poisson Boltzmann method of the ZAP program. The docked complex structures were used for the calculation of the free energy upon ligand-receptor binding. The complex structures were subject to a coarse minimization to optimize the binding structures prior to energy calculations. During the relaxation and the successive calculations, computations for three complexes failed due to the non-compatibility between ligands and the force field parameter. The computational results for the rest 34 ligand-receptor complexes were used in the following calculations.
Two sets of calculations were carried out based on docked structures obtained respectively from the monomer and dimer based ligand/cathepsin B docking simulations. The following energy calculations were applied to both sets of docked results. The calculated energies are listed in Table 1. The sum of these four energy terms does not have apparent correlation with the logIC50, which indicates that the MM-PBSA approach itself does not work for this system. Thus, the LR-MM-PBSA approach, a combination of MMPBSA and linear response approach, was resorted as a further step to calculate the binding affinity for this set of inhibitors. The optimized results are listed in Table 1–4.
Table 4.
The statistics information for the models built based on cathepsin B protein monomer and dimer.
| Based on monomer | Based on dimer | |||||||
|---|---|---|---|---|---|---|---|---|
| All | 4 outliers | All | 2 outliers | 4 outliers | Valid1 | Valid2 | Valid3 | |
| Training: 19 | Training: 21 | Training: 19 | ||||||
| # of inhibitors | 34 | 30 | 34 | 32 | 30 | Test: 17 | Test: 15 | Test: 17 |
| r2 | 0.555 | 0.738 | 0.791 | 0.885 | 0.919 | 0.935 | 0.913 | 0.874 |
| q2 | 0.420 | 0.632 | 0.695 | 0.839 | 0.887 | 0.886 | 0.840 | 0.766 |
| RMSE | 0.546 | 0.418 | 0.374 | 0.285 | 0.240 | 0.225 | 0.249 | 0.281 |
● r2: correlation coefficient. q2: cross validation coefficient. RMSE: root mean square error of the fitting correlation.
The correlation coefficients between the experimental logIC50 and the calculated energies for the monomer and dimer based docking models are 0.555 and 0.791 (Table 4), respectively. The calculated results show that the binding affinity calculations from the dimer based docking models produced better results comparing to those from the monomer based docking models (see supporting materials). The best models were chosen from dimer results and will be detailed in following sections. The calculated binding affinity energies for the 34 active compounds based on protein-ligand complex dimer are listed in Table 1. The van de Waals energy between the ligands and receptor ranges from −29.00 kcal/mol to 57.28 kcal/mol, while the electrostatic energy of the binding ranges from −5.64 kcal/mol to 52.54 kcal/mol. In addition, a Liaison score (LiaScore) was calculated. An examination revealed that there is no apparent correlation between this score and logIC50.
The predicted results from all compound model and the model excluding 4 outliers are listed in Table 2. The “All Compounds” column in Table 2 is for the model based on all compounds and the “4 outliers” column is for the model excluding 4 outliers as recognized in the “All Compounds” model. The predicted activity and the error (the difference between the calculated value and the observed value) for each compound in the respective models are listed in the table. The correlation coefficient between the energies and the observed logIC50 for the ”All compounds” model is 0.791 (Table 4). Leave-one-out (LOO) validation method was used to validate the model. The validated activity of each compound was calculated based on a model built excluding this inhibitor to eliminate a compound having influence on its own prediction in order to minimize the over fitting phenomenon. The plot of the linear correlation between the predicted activity and observed activity is shown in Figure 5A. It is seen that the data dots fall no far away from the perfect fitting line which indicates that the predicted activity from validation has very good correlation with the observed activity. The validation coefficient is 0.695 (Table 4), which indicates that an acceptable correlation has been reached for this set of compounds.
Table 2.
The predicted bioactivities vs. the observed activities based on the best model.
| All compounds1 | Excluding 4 outliers2 | ||||||||
|---|---|---|---|---|---|---|---|---|---|
| Compound CID | Non-validated3 |
Validated4 |
Non-validated |
Validated |
|||||
| logIC50 | Pred. | Error5 | Pred. | Error | Pred. | Error | Pred. | Error | |
| 66541 | −7.336 | −7.109 | −0.228 | −7.011 | −0.325 | −7.416 | 0.080 | −7.463 | 0.127 |
| 286532 | −4.941 | −4.895 | −0.046 | −4.885 | −0.055 | −4.912 | −0.029 | −4.905 | −0.036 |
| 573353 | −4.470 | −4.905 | 0.434 | −4.944 | 0.474 | −4.926 | 0.456 | −4.969 | 0.499 |
| 646525 | −5.701 | −6.044 | 0.343 | −6.080 | 0.379 | −6.157 | 0.456 | −6.227 | 0.526 |
| 646749 | −4.911 | −4.931 | 0.020 | −4.934 | 0.022 | −4.981 | 0.070 | −4.992 | 0.081 |
| 647501 | −7.149 | −6.736 | −0.413 | −6.675 | −0.474 | −6.956 | −0.193 | −6.921 | −0.228 |
| 647599 | −5.899 | −5.678 | −0.221 | −5.668 | −0.231 | −5.772 | −0.128 | −5.764 | −0.135 |
| 648315 | −5.197 | −5.154 | −0.043 | −5.151 | −0.045 | −5.144 | −0.053 | −5.140 | −0.056 |
| 651936 | −5.757 | −5.418 | −0.339 | −5.384 | −0.373 | −5.438 | −0.319 | −5.400 | −0.357 |
| 653297 | −7.141 | −6.760 | −0.382 | −6.701 | −0.440 | −6.985 | −0.156 | −6.956 | −0.186 |
| 653316 | −4.351 | −4.805 | 0.454 | −4.894 | 0.543 | −4.725 | 0.374 | −4.808 | 0.457 |
| 653862 | −6.035 | −5.963 | −0.071 | −5.949 | −0.086 | −6.177 | 0.143 | −6.211 | 0.176 |
| 654815 | −5.674 | −5.407 | −0.267 | −5.298 | −0.376 | −5.398 | −0.276 | −5.267 | −0.406 |
| 655490 | −5.019 | −5.111 | 0.092 | −5.125 | 0.106 | −5.161 | 0.142 | −5.191 | 0.172 |
| 658111 | −5.173 | −4.702 | −0.471 | −4.644 | −0.529 | −4.704 | −0.469 | −4.631 | −0.542 |
| 658152 | −4.706 | −4.728 | 0.022 | −4.730 | 0.024 | −4.700 | −0.006 | −4.699 | −0.006 |
| 658724 | −5.049 | −5.118 | 0.069 | −5.122 | 0.072 | −5.155 | 0.105 | −5.160 | 0.111 |
| 658964 | −4.398 | −4.428 | 0.030 | −4.433 | 0.035 | −4.360 | −0.038 | −4.354 | −0.044 |
| 660829 | −4.415 | −4.240 | −0.175 | −4.215 | −0.200 | −4.147 | −0.268 | −4.106 | −0.309 |
| 665480 | −5.680 | −4.809 | −0.872 | −4.480 | −1.201 | ||||
| 714967 | −4.848 | −4.758 | −0.090 | −4.735 | −0.113 | −4.730 | −0.118 | −4.683 | −0.165 |
| 794694 | −5.380 | −5.271 | −0.109 | −5.263 | −0.117 | −5.325 | −0.055 | −5.321 | −0.059 |
| 971438 | −4.430 | −4.653 | 0.224 | −4.693 | 0.264 | −4.556 | 0.126 | −4.579 | 0.150 |
| 1506381 | −4.338 | −5.024 | 0.686 | −5.188 | 0.851 | ||||
| 2212050 | −5.148 | −5.556 | 0.408 | −5.585 | 0.437 | −5.675 | 0.527 | −5.717 | 0.569 |
| 2997948 | −5.499 | −6.519 | 1.020 | −6.679 | 1.180 | ||||
| 3236798 | −5.926 | −6.512 | 0.585 | −6.635 | 0.709 | ||||
| 3240114 | −6.160 | −5.767 | −0.393 | −5.689 | −0.471 | −5.897 | −0.263 | −5.827 | −0.333 |
| 3241895 | −6.362 | −6.188 | −0.174 | −6.164 | −0.198 | −6.303 | −0.059 | −6.290 | −0.071 |
| 3243025 | −6.073 | −5.965 | −0.108 | −5.943 | −0.130 | −6.126 | 0.053 | −6.138 | 0.065 |
| 3243128 | −6.608 | −6.168 | −0.440 | −6.133 | −0.475 | −6.307 | −0.301 | −6.276 | −0.332 |
| 3243168 | −5.067 | −5.419 | 0.351 | −5.616 | 0.549 | −5.288 | 0.220 | −5.441 | 0.374 |
| 3250046 | −4.736 | −4.749 | 0.013 | −4.752 | 0.016 | −4.611 | −0.125 | −4.570 | −0.166 |
| 5293426 | −5.648 | −5.739 | 0.091 | −5.760 | 0.111 | −5.754 | 0.106 | −5.787 | 0.139 |
. All compounds: All compounds are included.
. Excluding 4 outliers: 4 outliers were excluded in the calculations.
. Non-validated: The activity was calculated based on non-validated fitting model.
. Validated: The activity was calculated using leave-one-out (LOO) validation method.
. The error is the difference between the observed value and the calculated value of the activity (logIC50) for each compound.
Figure 5.

The plot of predicted vs. observed bioactivity (logIC50) for the 34 active compounds based on the models. A: The predicted activity from the LOO model (Validated), in which each value was calculated based on the model which was constructed excluding this compound. B: The predicted activity from Valid1 model, where 19 randomly selected compounds were used as training set to build model, while the rest 15 compounds were used as test set to evaluate the model predictability. The diamond marks in B are for training set compounds and the solid round marks are for test set compounds.
By examining the error of the prediction, it is noticed that two compounds have prediction errors larger than 0.8 unit. When the two were treated as outliers, the model built by excluding the two compounds show significantly improved performance with correlation coefficient of 0.885 and cross validation coefficient of 0.839(Table 4). If using a threshold of prediction error larger than half unit (0.5), four compounds were identified as outliers When these four compounds were excluded from the building set, a regression model was reached with much better performance with a correlation coefficient of 0.919 and cross validation coefficient of 0.887 (Table 4).
To further examine the predictability of the approach, three validation models were constructed by randomly dividing all compounds into training set and test set. A model was constructed based on the compounds in the training set and then the activity is predicted for each of the compounds in the test set. The three regression models are designated as Valid1, Valid2, and Valid3, with different division of compounds in the training and test sets. The predicted activity for the training compounds and the testing compounds are listed in Table 3, the statistical results for the three models are listed in Table 4. As seen in Table 3, Valid1, Valid2, and Valid3 have 19, 21, and 19 compounds in training set and 15, 13, and 15 compounds in test set, respectively. The predicted results show that all compounds, except one in Valid1 model and two in Valid2 and Valid3, have predicted activity less than one unit (1.0). The plot for the correlation between the predicted and observed activities from the Valid1 is depicted in Figure 5B. Apparent correlation has been observed in the figure. This is a satisfactory result considering the range (~3) of the observed logIC50 values. All the three independent validation models demonstrate consistent performance and show that they are robust models for predicting biological activities.
Table 3.
The predictability of the models based on different training sets measured by the predicted bioactivities compared with the observed activity.
| Compound CID | Valid1 | Valid2 | Valid3* | |||||||
|---|---|---|---|---|---|---|---|---|---|---|
| logIC50 | Training | Test | Error | Training | Test | Error | Training | Test | Error | |
| 66541 | −7.336 | −7.448 | 0.112 | −7.529 | 0.193 | −7.390 | 0.053 | |||
| 286532 | −4.941 | −4.865 | −0.076 | −5.119 | 0.179 | −5.008 | 0.067 | |||
| 573353 | −4.470 | −4.952 | 0.482 | −5.022 | 0.552 | −4.927 | 0.456 | |||
| 646525 | −5.701 | −6.344 | 0.643 | −6.058 | 0.357 | −5.971 | 0.270 | |||
| 646749 | −4.911 | −5.146 | 0.235 | −4.960 | 0.049 | −4.942 | 0.030 | |||
| 647501 | −7.149 | −7.069 | −0.080 | −6.950 | −0.199 | −6.827 | −0.321 | |||
| 647599 | −5.899 | −5.904 | 0.005 | −5.749 | −0.150 | −5.666 | −0.233 | |||
| 648315 | −5.197 | −5.214 | 0.017 | −5.157 | −0.039 | −5.039 | −0.158 | |||
| 651936 | −5.757 | −5.378 | −0.379 | −5.592 | −0.165 | −5.414 | −0.343 | |||
| 653297 | −7.141 | −7.106 | −0.036 | −6.972 | −0.169 | −6.852 | −0.289 | |||
| 653316 | −4.351 | −4.584 | 0.233 | −4.939 | 0.588 | −4.724 | 0.373 | |||
| 653862 | −6.035 | −6.397 | 0.362 | −6.148 | 0.113 | −6.156 | 0.121 | |||
| 654815 | −5.674 | −5.400 | −0.274 | −5.399 | −0.275 | −5.198 | −0.476 | |||
| 655490 | −5.019 | −5.382 | 0.363 | −5.059 | 0.040 | −5.042 | 0.023 | |||
| 658111 | −5.173 | −4.842 | −0.331 | −4.682 | −0.491 | −4.641 | −0.532 | |||
| 658152 | −4.706 | −4.711 | 0.005 | −4.793 | 0.087 | −4.679 | −0.027 | |||
| 658724 | −5.049 | −5.217 | 0.168 | −5.217 | 0.168 | −5.129 | 0.080 | |||
| 658964 | −4.398 | −4.313 | −0.085 | −4.526 | 0.128 | −4.401 | 0.003 | |||
| 660829 | −4.415 | −4.139 | −0.276 | −4.252 | −0.163 | −4.139 | −0.276 | |||
| 665480 | −5.680 | −4.826 | −0.854 | −4.497 | −1.184 | −4.356 | −1.325 | |||
| 714967 | −4.848 | −4.867 | 0.019 | −4.644 | −0.204 | −4.560 | −0.288 | |||
| 794694 | −5.380 | −5.342 | −0.038 | −5.420 | 0.040 | −5.302 | −0.078 | |||
| 971438 | −4.430 | −4.438 | 0.008 | −4.729 | 0.300 | −4.522 | 0.093 | |||
| 1506381 | −4.338 | −5.224 | 0.886 | −4.835 | 0.498 | −4.767 | 0.429 | |||
| 2212050 | −5.148 | −5.801 | 0.653 | −5.680 | 0.533 | −5.620 | 0.472 | |||
| 2997948 | −5.499 | −6.976 | 1.477 | −6.623 | 1.124 | −6.575 | 1.076 | |||
| 3236798 | −5.926 | −6.700 | 0.774 | −6.754 | 0.828 | −6.595 | 0.669 | |||
| 3240114 | −6.160 | −5.938 | −0.222 | −6.029 | −0.130 | −5.940 | −0.219 | |||
| 3241895 | −6.362 | −6.497 | 0.135 | −6.181 | −0.180 | −6.082 | −0.279 | |||
| 3243025 | −6.073 | −6.219 | 0.145 | −6.139 | 0.066 | −6.038 | −0.036 | |||
| 3243128 | −6.608 | −6.414 | −0.193 | −6.315 | −0.293 | −6.205 | −0.403 | |||
| 3243168 | −5.067 | −5.194 | 0.127 | −5.329 | 0.261 | −5.026 | −0.042 | |||
| 3250046 | −4.736 | −4.621 | −0.116 | −4.637 | −0.100 | −4.458 | −0.278 | |||
| 5293426 | −5.648 | −5.865 | 0.216 | −5.708 | 0.059 | −5.568 | −0.080 | |||
Three Validation Regressions were constructed based on three training sets of compounds which were randomly selected. The rest compounds were used as test set. The activity of test set compounds was calculated based on the model built on training set compounds. The error is the difference between the observed value and the calculated value of the activity (logIC50) for each compound.
Conclusion
Biological activity of a set of active cathepsin B inhibitors discovered by one HTS experiment (PuBChem AID:820) has been predicted by the binding affinity calculation through LR-MMPBSA approach based on docked complexes. The binding structure and interaction modes have been examined and the effect of protein dimerization on the binding has been explored. LR-MMPBSA approach has then been successfully applied for binding affinity calculations and the calculated binding affinity has shown strong correlation with the experimental activity (logIC50).
All the active compounds under this study can bind into the active site of cathepsin B protein monomer and dimer based on the docking simulations, where similar binding patterns were observed. Based on the docking results, it is shown that the second protein in a dimer has direct interactions with a bound inhibitor. The protein closes up partial solvent accessible open space observed in monomer complex. The close-up turns solvent-accessible area into partial hydrophobic binding area and would benefit ligands which have less hydrophilic groups bound to the part of the active site. Enhanced regression results were obtained from dimer-based calculations, which suggests that the protein dimer could be a better model for structure-based cathepsin B inhibitor design in the work, though the role of molecular interaction in the biological system between cathepsin B molecules need to be further investigated.
Satisfactory correlation coefficients have been obtained between the calculated binding affinity through the LR-MM-PBSA approach and the observed biological activity (logIC50). The predictability of the model is evaluated by the LOO method, cross-validation, and three independent training-test experiments. The predicted activities for the compounds in these validation experiments exhibit good correlations with the observed activity with a low rate of errors. The excellent performance of the models demonstrates its robustness, predictability, and feasibility when applied to the evaluation of cathepsin B inhibitors. Together with previous studies, the application shows that this method is a promising approach in structure-based drug development by meeting the need to rank and prioritize new compounds in silico design based on their binding affinity to the protein receptor.
Supplementary Material
Acknowledgments
This research was supported by the Intramural Research Program of the NIH, NLM. The authors thank the developers of Pymol software for sharing the program to prepare the molecular figures used in the paper.
References
- 1.Barrett AJ, Kirschke H. Cathepsin B, Cathepsin H, and cathepsin L. Methods Enzymol. 1981;80(Pt C):535–561. doi: 10.1016/s0076-6879(81)80043-2. [DOI] [PubMed] [Google Scholar]
- 2.Chapman HA, Jr, Munger JS, Shi GP. The role of thiol proteases in tissue injury and remodeling. Am J Respir Crit Care Med. 1994;150(6 Pt 2):S155–159. doi: 10.1164/ajrccm/150.6_Pt_2.S155. [DOI] [PubMed] [Google Scholar]
- 3.Rooprai HK, McCormick D. Proteases and their inhibitors in human brain tumours: a review. Anticancer Res. 1997;17(6B):4151–4162. [PubMed] [Google Scholar]
- 4.Roberts LR, Adjei PN, Gores GJ. Cathepsins as effector proteases in hepatocyte apoptosis. Cell Biochem Biophys. 1999;30(1):71–88. doi: 10.1007/BF02737885. [DOI] [PubMed] [Google Scholar]
- 5.Giusti I, D’Ascenzo S, Millimaggi D, Taraboletti G, Carta G, Franceschini N, Pavan A, Dolo V. Cathepsin B mediates the pH-dependent proinvasive activity of tumor-shed microvesicles. Neoplasia. 2008;10(5):481–488. doi: 10.1593/neo.08178. [DOI] [PMC free article] [PubMed] [Google Scholar]
- 6.Gounaris E, Tung CH, Restaino C, Maehr R, Kohler R, Joyce JA, Plough HL, Barrett TA, Weissleder R, Khazaie K. Live imaging of cysteine-cathepsin activity reveals dynamics of focal inflammation, angiogenesis, and polyp growth. PLoS ONE. 2008;3(8):e2916. doi: 10.1371/journal.pone.0002916. [DOI] [PMC free article] [PubMed] [Google Scholar]
- 7.Ha SD, Martins A, Khazaie K, Han J, Chan BM, Kim SO. Cathepsin B is involved in the trafficking of TNF-alpha-containing vesicles to the plasma membrane in macrophages. J Immunol. 2008;181(1):690–697. doi: 10.4049/jimmunol.181.1.690. [DOI] [PubMed] [Google Scholar]
- 8.Haque A, Banik NL, Ray SK. New insights into the roles of endolysosomal cathepsins in the pathogenesis of Alzheimer’s disease: cathepsin inhibitors as potential therapeutics. CNS Neurol Disord Drug Targets. 2008;7(3):270–277. doi: 10.2174/187152708784936653. [DOI] [PubMed] [Google Scholar]
- 9.Sandes E, Lodillinsky C, Cwirenbaum R, Arguelles C, Casabe A, Eijan AM. Cathepsin B is involved in the apoptosis intrinsic pathway induced by Bacillus Calmette-Guerin in transitional cancer cell lines. Int J Mol Med. 2007;20(6):823–828. [PubMed] [Google Scholar]
- 10.Lutgens SP, Cleutjens KB, Daemen MJ, Heeneman S. Cathepsin cysteine proteases in cardiovascular disease. Faseb J. 2007;21(12):3029–3041. doi: 10.1096/fj.06-7924com. [DOI] [PubMed] [Google Scholar]
- 11.Hook V, Kindy M, Hook G. Cysteine protease inhibitors effectively reduce in vivo levels of brain beta-amyloid related to Alzheimer’s disease. Biol Chem. 2007;388(2):247–252. doi: 10.1515/BC.2007.027. [DOI] [PubMed] [Google Scholar]
- 12.Downs LS, Jr, Lima PH, Bliss RL, Blomquist CH. Cathepsins B and D activity and activity ratios in normal ovaries, benign ovarian neoplasms, and epithelial ovarian cancer. J Soc Gynecol Investig. 2005;12(7):539–544. doi: 10.1016/j.jsgi.2005.06.009. [DOI] [PubMed] [Google Scholar]
- 13.Vasiljeva O, Korovin M, Gajda M, Brodoefel H, Bojic L, Kruger A, Schurigt U, Sevenich L, Turk B, Peters C, Reinheckel T. Reduced tumour cell proliferation and delayed development of high-grade mammary carcinomas in cathepsin B-deficient mice. Oncogene. 2008;27(30):4191–4199. doi: 10.1038/onc.2008.59. [DOI] [PubMed] [Google Scholar]
- 14.Vasiljeva O, Papazoglou A, Kruger A, Brodoefel H, Korovin M, Deussing J, Augustin N, Nielsen BS, Almholt K, Bogyo M, Peters C, Reinheckel T. Tumor cell-derived and macrophage-derived cathepsin B promotes progression and lung metastasis of mammary cancer. Cancer Res. 2006;66(10):5242–5250. doi: 10.1158/0008-5472.CAN-05-4463. [DOI] [PubMed] [Google Scholar]
- 15.Jane DT, Morvay L, Dasilva L, Cavallo-Medved D, Sloane BF, Dufresne MJ. Cathepsin B localizes to plasma membrane caveolae of differentiating myoblasts and is secreted in an active form at physiological pH. Biol Chem. 2006;387(2):223–234. doi: 10.1515/BC.2006.030. [DOI] [PubMed] [Google Scholar]
- 16.Akache B, Grimm D, Shen X, Fuess S, Yant SR, Glazer DS, Park J, Kay MA. A two-hybrid screen identifies cathepsins B and L as uncoating factors for adeno-associated virus 2 and 8. Mol Ther. 2007;15(2):330–339. doi: 10.1038/sj.mt.6300053. [DOI] [PMC free article] [PubMed] [Google Scholar]
- 17.Hook VY, Kindy M, Hook G. Inhibitors of cathepsin B improve memory and reduce beta-amyloid in transgenic Alzheimer disease mice expressing the wild-type, but not the Swedish mutant, beta-secretase site of the amyloid precursor protein. J Biol Chem. 2008;283(12):7745–7753. doi: 10.1074/jbc.M708362200. [DOI] [PubMed] [Google Scholar]
- 18.Hosokawa M, Kashiwaya K, Eguchi H, Ohigashi H, Ishikawa O, Furihata M, Shinomura Y, Imai K, Nakamura Y, Nakagawa H. Over-expression of cysteine proteinase inhibitor cystatin 6 promotes pancreatic cancer growth. Cancer Sci. 2008;99(8):1626–1632. doi: 10.1111/j.1349-7006.2008.00869.x. [DOI] [PMC free article] [PubMed] [Google Scholar]
- 19.Parker BS, Ciocca DR, Bidwell BN, Gago FE, Fanelli MA, George J, Slavin JL, Moller A, Steel R, Pouliot N, Eckhardt BL, Henderson MA, Anderson RL. Primary tumour expression of the cysteine cathepsin inhibitor Stefin A inhibits distant metastasis in breast cancer. J Pathol. 2008;214(3):337–346. doi: 10.1002/path.2265. [DOI] [PubMed] [Google Scholar]
- 20.Greenspan PD, Clark KL, Tommasi RA, Cowen SD, McQuire LW, Farley DL, van Duzer JH, Goldberg RL, Zhou H, Du Z, Fitt JJ, Coppa DE, Fang Z, Macchia W, Zhu L, Capparelli MP, Goldstein R, Wigg AM, Doughty JR, Bohacek RS, Knap AK. Identification of dipeptidyl nitriles as potent and selective inhibitors of cathepsin B through structure-based drug design. J Med Chem. 2001;44(26):4524–4534. doi: 10.1021/jm010206q. [DOI] [PubMed] [Google Scholar]
- 21.Otto HH, Schirmeister T. Cysteine Proteases and Their Inhibitors. 1997;97:133–172. doi: 10.1021/cr950025u. [DOI] [PubMed] [Google Scholar]
- 22.Yamamoto A, Tomoo K, Hara T, Murata M, Kitamura K, Ishida T. Substrate specificity of bovine cathepsin B and its inhibition by CA074, based on crystal structure refinement of the complex. J Biochem. 2000;127(4):635–643. doi: 10.1093/oxfordjournals.jbchem.a022651. [DOI] [PubMed] [Google Scholar]
- 23.Mladenovic M, Ansorg K, Fink RF, Thiel W, Schirmeister T, Engels B. Atomistic Insights into the Inhibition of Cysteine Proteases: First QM/MM Calculations Clarifying the Stereoselectivity of Epoxide-Based Inhibitors. J Phys Chem B. 2008 doi: 10.1021/jp803895f. [DOI] [PubMed] [Google Scholar]
- 24.Redzynia I, Ljunggren A, Abrahamson M, Mort JS, Krupa JC, Jaskolski M, Bujacz G. Displacement of the occluding loop by the parasite protein, chagasin, results in efficient inhibition of human cathepsin B. J Biol Chem. 2008;283(33):22815–22825. doi: 10.1074/jbc.M802064200. [DOI] [PubMed] [Google Scholar]
- 25.Watanabe D, Yamamoto A, Tomoo K, Matsumoto K, Murata M, Kitamura K, Ishida T. Quantitative evaluation of each catalytic subsite of cathepsin B for inhibitory activity based on inhibitory activity-binding mode relationship of epoxysuccinyl inhibitors by X-ray crystal structure analyses of complexes. J Mol Biol. 2006;362(5):979–993. doi: 10.1016/j.jmb.2006.07.070. [DOI] [PubMed] [Google Scholar]
- 26.Beavers MP, Myers MC, Shah PP, Purvis JE, Diamond SL, Cooperman BS, Huryn DM, Smith AB., 3rd Molecular docking of cathepsin L inhibitors in the binding site of papain. J Chem Inf Model. 2008;48(7):1464–1472. doi: 10.1021/ci800085c. [DOI] [PMC free article] [PubMed] [Google Scholar]
- 27.Warshel A. Calculations of enzymic reactions: calculations of pKa, proton transfer reactions, and general acid catalysis reactions in enzymes. Biochemistry. 1981;20(11):3167–3177. doi: 10.1021/bi00514a028. [DOI] [PubMed] [Google Scholar]
- 28.Warshel A, Levitt M. Theoretical studies of enzymatic reactions: dielectric electrostatic and steric stabilization of the carbonium ion in the reaction of lysozyme. Journal Molecular Biology. 1976;103:227–249. doi: 10.1016/0022-2836(76)90311-9. [DOI] [PubMed] [Google Scholar]
- 29.Wang J, Morin P, Wang W, Kollman PA. Use of MM-PBSA in Reproducing the Binding Free Energies to HIV-1 RT of TIBO Derivatives and Predicting the Binding Mode to HIV-1 RT of Efavirenz by Docking and MM-PBSA. Journal of the American Chemical Society. 2001;123(22):5221–5230. doi: 10.1021/ja003834q. [DOI] [PubMed] [Google Scholar]
- 30.Kuhn B, Donini O, Huo S, Wang J, Kollman PA. MM-PBSA applied to computer-assisted ligand design. Free Energy Calculations in Rational Drug Design. 2001:243–251. [Google Scholar]
- 31.Zhou Z, Madura JD. Relative free energy of binding and binding mode calculations of HIV-1 RT inhibitors based on Dock-MM-PB/GS. Proteins: Structure, Function, and Bioinformatics. 2004;57(3):493–503. doi: 10.1002/prot.20223. [DOI] [PubMed] [Google Scholar]
- 32.Zhou Z, Bates M, Madura JD. Structure modeling, ligand binding, and binding affinity calculation (LR-MM-PBSA) of human heparanase for inhibition and drug design. Proteins. 2006;65(3):580–592. doi: 10.1002/prot.21065. [DOI] [PubMed] [Google Scholar]
- 33.Kim R, Skolnick J. Assessment of programs for ligand binding affinity prediction. J of Computational Chemistry. 2008;29(8):1316–1331. doi: 10.1002/jcc.20893. [DOI] [PMC free article] [PubMed] [Google Scholar]
- 34.Jorgensen WL, Tirado-Rives J. The OPLS Potential function for proteins Energy minimizations for crystals of cyclic peptides and crambin. J Am Chem Soc. 1988;110:1657–1666. doi: 10.1021/ja00214a001. [DOI] [PubMed] [Google Scholar]
- 35.Damm W, Frontera A, Tirado-Rives J, Jorgensen WL. OPLS all-atom force field for carbohydrates. Journal of Computational Chemistry. 1997;18(16):1955–1970. [Google Scholar]
- 36.Rizzo RC, Jorgensen WL. OPLS All-Atom Model for Amines: Resolution of the Amine Hydration Problem. Journal of the American Chemical Society. 1999;121(20):4827–4836. [Google Scholar]
- 37.Jorgensen WL, Maxwell DS, Tirado-Rives J. Development and Testing of the OPLS All-Atom Force Field on Conformational Energetics and Properties of Organic Liquids. Journal of the American Chemical Society. 1996;118(45):11225–11236. [Google Scholar]
- 38.Friesner RA, Banks JL, Murphy RB, Halgren TA, Klicic JJ, Mainz DT, Repasky MP, Knoll EH, Shelley M, Perry JK, Shaw DE, Francis P, Shenkin PS. Glide: A new approach for rapid, accurate docking and scoring. 1 method and assessment of docking accuracy. Journal of Medicinal Chemistry. 2004;47(7):1739–1749. doi: 10.1021/jm0306430. [DOI] [PubMed] [Google Scholar]
- 39.Halgren TA, Murphy RB, Friesner RA, Beard HS, Frye LL, Pollard WT, Banks JL. Glide: A new approach for rapid, accurate docking and scoring. 2 Enrichment factors in database screening. Journal of Medicinal Chemistry. 2004;47(7):1750–1759. doi: 10.1021/jm030644s. [DOI] [PubMed] [Google Scholar]
- 40.Grant JA, Pickup BT, Nicholls A. A smooth permittivity function for poisson-boltzmann solvation methods. Journal of Computational Chemistry. 2001;22(6):608–640. [Google Scholar]
- 41.Rocchia W, Sridharan S, Nicholls A, Alexov E, Chiabrera A, Honig B. Rapid grid-based construction of the molecular surface and the use of induced surface charge to calculate reaction field energies: applications to the molecular systems and geometric objects. Journal of Computational Chemistry. 2002;23(1):128–137. doi: 10.1002/jcc.1161. [DOI] [PubMed] [Google Scholar]
Associated Data
This section collects any data citations, data availability statements, or supplementary materials included in this article.