Synopsis
Arterial spin labeling (ASL) will soon be available as a routine clinical perfusion imaging sequence for a significant number of MRI scanners. The ASL perfusion technique offers similar information as conventional dynamic susceptibility sequences; however, it does not require intravenous contrast and can be quantified. The appearance of pathology is significantly impacted by the ASL techniques used. Familiarity with the available sequence parameter options and the common appearances of pathology will facilitate perfusion interpretation.
At Wake Forest University School of Medicine, we have implemented an automated processing pipeline capable of handling a substantial clinical volume of perfusion acquisitions. Over the past 2 years over 8,000 clinical ASL examinations have been performed. These cases have revealed many pathologic and physiologic processes readily identified with quantitative perfusion imaging(1-11).
Keywords: Arterial spin labeled MRI, perfusion, applications, stroke imaging, ASL, PASL
Introduction
Arterial spin labeling (ASL) perfusion MRI imaging was conceived over 15 years ago(12-14). Since that time the technique has largely existed in the research realm because of the complex post-processing requirements. Many research studies have demonstrated the potential clinical utility of the sequence, but until now a large scale clinical implementation has not been achieved(1-8). The perfusion sequence has several benefits over traditional contrast bolus techniques. First, ASL requires no Gadolinium-based contrast agent. Due to fear of nephrogenic systemic fibrosis, the acquisition of perfusion data in a clinical population full of chronic renal failure patients has been problematic and caused the radiologist great consternation while protocoling studies(15). ASL allows the perfusion data acquisition without the associated fear. Acquiring perfusion data in young children with bolus techniques has also been problematic because of the necessary intravenous access. If contrast is not needed for the routine examination, using ASL avoids a potential needle stick in the sleeping baby.
The second major benefit of ASL over conventional bolus techniques is that ASL can be quantitative(16). The majority of perfusion techniques available are qualitative, showing relative changes in cerebral blood volume (CBV), cerebral blood flow (CBF), and mean transit time (MTT)(17). Quantification allows for regional and global assessments of cerebral perfusion. Relative perfusion techniques have an inherently difficult time revealing global hypo- or hyperperfusion. Quantification on an absolute scale allows easy recognition of states such as hypercapnia or diffuse hypoxic/anoxic injury. Regional assessments of cerebral perfusion allow for easy comparisons between pre and post treatment states involving chemotherapy, endarterectomy, thrombolysis, and migraine or seizure therapy. There is also a growing body of evidence that perfusion values can be correlated with histologic grade of neoplasms(18, 19).
During the last 15 years refinements in scanner technology and computer processing capabilities have allowed for automation of the necessary post processing. During that time teams of researchers have been working to improve the robustness of the sequence, acquisition time, and resolution and reduce the known technical failures and artifacts(20, 21). Vendors have each developed their “own” version of ASL which can vary significantly in the techniques employed.
Technical considerations
Understanding and interpreting the clinical applications of ASL requires some basic knowledge of the technical parameters of the sequence. In general, ASL is based on the “labeling” of protons in the blood in the supplying vessels outside of the imaging plane, waiting a period of time known as the post labeling delay (PLD) for the labeled blood to reach the parenchyma, and then imaging the parenchyma in the labeled and control (i.e. unlabeled) state. The width and location of the labeling plane varies depending on the ASL implementation and will be discussed in greater detail below.
Subtraction of the labeled and controlled images eliminates the static tissue signal from the parenchyma. The remaining signal is a relative measure of the perfusion. The difference between the control and label images yields a signal proportional to the local CBF and can be sensitized to specific tissue perfusion (12). The signal difference is usually a fraction (1 - 2%) of the tissue signal and depends on many parameters such as flow rate, T1 of the blood and tissue and transit time for blood to travel from the tagging region to the imaging plane. Multiple control and label images are acquired to ensure sufficient signal-to-noise ratio (SNR) for diagnostic review. An absolute quantitative perfusion map can be obtained using the General Kinetic Model by Buxton et. al (22).
ASL images are acquired with MRI pulse sequences that have two distinct and independent components, a preparation component and an acquisition component. The preparation component labels the inflowing blood in different magnetic states for the control and label images. Once the blood has been labeled, the acquisition component acquires the data. The acquisition component typically uses a fast acquisition method such as Spiral or Echo Planar Imaging (EPI). The distinct and independent nature of the preparation and acquisition components has allowed researchers to choose the combination that is best suited for their specific application.
There are currently four types of ASL preparation components, pulsed ASL (PASL), continuous ASL (CASL), pseudo-continuous ASL (PCASL) and velocity-selective ASL (VS-ASL). The primary difference among these ASL categories is the technique that magnetically tags the inflowing blood. These four types of ASL methods were developed to address the limitations and technical challenges encountered in the early implementations of ASL.
PASL uses short (5 – 20ms) radio-frequency (RF) pulses to invert a thick slab of spins in the tagging plane proximal to the imaging region (23). Original PASL methods such as FAIR(24), PICORE(25), and EPISTAR(23) used a single inversion pulse during the preparation component to magnetically label the spins. The difference among these methods is the location of the labeling plane and the choice of the magnetically labeled state of the blood for the control and label images. These techniques were refined when adiabatic hyperbolic secant (AHS) RF pulses, which are insensitive to B1 field inhomogeneity, were used to improve inversion efficiency (23, 24). Further improvements in the labeling plane slice profile were achieved with Frequency Offset Correction Inversion AHS RF pulses (26). While PASL techniques have a higher inversion efficiency and lower RF power deposition than CASL, a limitation of PASL was the poorly defined distal edge of the labeling plane, which introduces a systematic bias to the CBF quantification. This limitation was overcome with QUIPPS and Q2TIPS (17, 26). QUIPPS and Q2TIPS apply a saturation pulse at a specified time after the inversion pulse to sharply define the labeling planes distal edge, which eliminates the systematic bias.
CASL uses long and continuous RF pulses (1-2seconds) along with a constant gradient field to induce a flow-driven adiabatic inversion in a narrow plane of spins, usually just below the imaging plane (27, 28). The tagging plane is chosen so that the inflowing spins are in a direction approximately normal to the tagging plane. With proper adjustment of the RF and gradients, spins within a physiologic range of velocities are inverted (14). In CASL the spins are continuously being inverted as they pass through the tagging plane, resulting in higher perfusion sensitivity than PASL. While higher perfusion sensitivity is desirable, CASL has several drawbacks that have limited widespread acceptance. The primary limitation of CASL is the need for continuous RF transmit hardware, which is not commonly available on commercial clinical scanners. The long RF pulses used in CASL deposit large amounts of RF energy into the patient, which can exceed the FDA guidelines for RF power deposition, also known as specific absorption rate (SAR), unless special precautions are taken (29). Magnetization Transfer (MT) effects are also a drawback of CASL, requiring a second inversion to accomplish the control state. Higher RF power deposition and MT effects associated with CASL can be overcome by using a separate small RF surface coil for labeling the blood as it flows through the carotid arteries (9, 30, 31). The additional hardware necessary restricts this solution to a small number of research sites. Another disadvantage of CASL is that the average inversion efficiency of CASL is lower (80 - 95%) compared to PASL (95%) (30, 31). However, the lower inversion efficiency is compensated by the closer inversion to the imaging plane, thereby minimizing loss of perfusion signal due to T1 relaxation.
pCASL was introduced to match the inversion efficiency of CASL while reducing the RF power deposition. First developed by Garcia, et. al (32), pCASL uses a train of discrete RF pulses in conjunction with a synchronous gradient field to mimic a flow-driven adiabatic inversion seen in CASL without the special hardware. This technique provides a better balance between tagging efficiency and SNR, as well as reducing MT effects and RF power deposition compared to CASL methods. Depending upon the implementation, pCASL is susceptible to B0 inhomogeneity and eddy currents.(30).
While PASL, CASL, and pCASL invert the inflowing blood at a specific location, VS-ASL saturates the blood that is moving at a faster velocity than the specified cutoff value to achieve perfusion contrast. In theory, this results in a smaller and more uniform transit delay for the delivery of blood to the target tissue and allows for quantitative measurements of CBF under slow and collateral flow conditions, such as stroke (33). Disadvantages of VS-ASL include lower SNR and difficulty in determining the optimal cutoff velocity. Inappropriate values of cutoff velocity will result in incorrect local perfusion information and produce image artifacts. A summary of advantages and disadvantages for each method is listed in Table 1.
Table 1.
Advantages of disadvantages of different ASL methods
| ASL Types | Advantages | Disadvantages |
|---|---|---|
| PASL | Higher tagging efficiency Lower SAR Improved transit time effects. |
Lower SNR Increased transit delay |
| CASL |
Higher SNR than PASL Shorter transit delay |
Lower tagging efficiency Continuous RF transmit hardware required Higher SAR Magnetization Transfer effects |
| pCASL | Higher SNR than PASL Higher tagging efficiency than CASL Improved transit time effects. |
Higher SAR Limited clinical availability. |
| VS-ASL | Ability to measure low | Lower SNR |
Once the blood has been labeled with the preparation component of the ASL sequence, the acquisition component acquires the images. ASL images have been conventionally acquired with EPI in the cartesian trajectory due to the fast acquisition speed and simple reconstruction. Because of relaxation, echo time (TE) plays an important role in perfusion sensitivity. Spiral trajectory can be used to achieve optimal TE to further improve SNR. In addition, suppression of the static tissue signal has been shown to be an effective method for improving signal stability and reducing imaging noise(32, 35, 36). There exist many implementations of ASL techniques, and the interested reader may refer to recent ASL reviews for detailed explanations (29, 34, 37).
Regardless of the method employed, one of the most significant factors in the appearance of the perfusion image is the presence or absence of additional crusher gradients during the acquisition component (Table 2). Ideally all of the signal imparted to the protons would be deposited in the tissues by the time the parenchyma is imaged; however, there is frequently residual tagged signal contained within the vasculature. Including the vascular signal would give artificially high measurements when trying to quantify perfusion. By applying bipolar gradients prior to imaging the parenchyma, it is possible to suppress the moving signal that is within the vasculature. The benefit of crusher gradients is that they allow for quantification by suppressing the intravascular signal. However, since ASL has inherently low SNR, removing any signal from the image, even if it is in the vessel, can lower the apparent quality of the perfusion image(1). The presence or absence of crusher gradients will also significantly impact the appearance of vascular pathologies, such as slow flow states associated with infarction, or high flow states associated with arteriovenous malformations (AVM) (Figure 1)(38).
Table 2.
The effects of bipolar crusher gradients on clinical ASL imaging.
| Benefits | Limitations | AVM | Very Slow Flow | Stroke Imaging | Physiologic Imaging | |
|---|---|---|---|---|---|---|
| Crusher Gradient Applied | Allows for quantitative perfusion imaging | Decreased overall available signal | Allows for quantification of the steal phenomena | CBF map will resemble transit time map. | Perfusion will be underestimated. | Global perfusion changes can be assessed |
| No Crusher Gradient | Increased available signal | Perfusion imaging is qualitative | Allows for visualization of the A-V shunting | High signal will be in the affected territory. | Perfusion will be overestimated. | Relative regional perfusion changes can be assessed. |
Figure 1. Label panels from Left to Right: A, B, C, D.
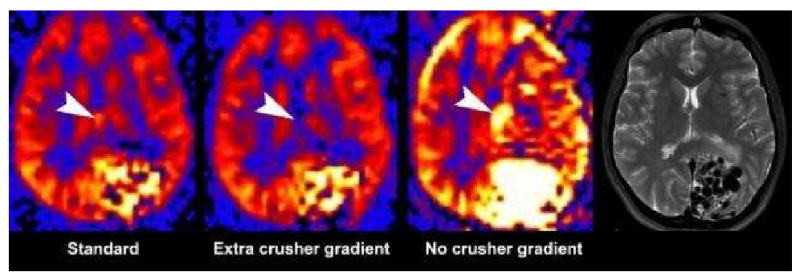
The effect of bipolar gradients on PASL. Standard bipolar gradients (A), additional gradient directions (B), and no bipolar gradients (C) were used in a patient with a large left occipital arteriovenous malformation (AVM). Large flow voids are seen on the T2 image (D). The absence of bipolar gradients results in visualization of the intravascular signal resulting in a brighter image. Without intravascular suppression, the entire AVM lesion including the draining veins (arrowhead) are seen (C). With standard intravascular signal suppression (A), the intensity of the AVM's signal is reduced significantly as well as the draining veins (arrowhead). With additional gradients (B) the AVM signal intensity is further reduced and the signal in the draining vein has been eliminated (arrowhead).
ASL's general principle of a tag, delay for tissue deposition, and then imaging introduces significant importance to the amount of the post labeling delay in the sequence. The post labeling delay, known as the inversion time in the PASL sequence, will significantly impact the CBF perfusion map, especially when bipolar crusher gradients are used. With a very short PLD, in which the blood has not had sufficient time to reach the parenchyma, the perfusion signal will be low. A shorter PLD will allow the acquisition time to decrease. However, the perfusion image may not accurately represent the cerebral perfusion because there has not been enough time for slower flow territories to tissue exchange. The moving intravascular signal will then be crushed. This results in an image that overestimates perfusion defects and shows watershed territories as having significantly diminished perfusion(1). At longer PLD, there will be more time for the tag to be deposited in the tissue leading to a more accurate global assessment of cerebral perfusion. Images will in general appear more homogenous. Drawbacks of longer delays include longer acquisition time and less available signal at the time of imaging due to T1 relaxation.
Unfortunately, there is no perfect solution between the two extremes. The optimum PLD will depend upon the age and health of the patient. Imagers must find the balance that satisfies the imaging needs based on the clinical population. Regardless of the PLD selected, one should develop familiarity with the normal age related appearance of the pulse sequence prior to declaring a perfusion pattern to be pathologic(1).
Quantification versus qualification
The subtraction of the control and labeled image pairs yields signal differences that reflect the relative perfusion of the parenchyma. These relative perfusion maps are easily attainable, but still reflect the choice of inversion time (delay), slice thickness, and presence of bipolar crusher gradients. To quantify cerebral perfusion, the following equation must be solved:
| (13) |
where CBF is the cerebral blood flow, ΔM(TI2) is the mean difference in the signal intensity between the label and control images, M0,blood is the equilibrium magnetization of blood, (x025A1) is the tagging efficiency, TI1 is the time duration of the tagging bolus, TI2 is the inversion time of each slice, T1,blood is the longitudinal relaxation time of blood, and qp is a correction factor that accounts for the difference between the T1 of blood and the T1 of brain tissue(20). There are several variables that are directly measured and then introduced into the equation, such as the T1 of tissue. Other variables used in the equation represent standard values taken from the published literature. Ideally all of the variables would be obtained de novo in each patient; however, this is not possible in some cases, and not practical in others. These assumptions can introduce errors into the quantification. Most important are the T1 values of blood and tissue. The T1 of blood increases as hematocrit increases(39-41). If standard published values for the T1 of blood are used in solving the equation for a severely anemic patient, quantification errors of 10-15% can result(5, 39, 41). The T1 of tissue can fortunately be measured using Look-Locker techniques. This adds time and complexity for computing the T1 data on a voxelwise basis and then calculating the CBF values using those T1 values. Understanding the influence and variables in the CBF quantification equation will yield more accurate interpretations of the quantified CBF values(42).
Artifacts
Before discussing the clinical applications of ASL, there are a few frequently encountered artifacts in the clinical population that must be addressed (1). Familiarity with these artifacts will facilitate interpretation and allow the radiologist to be proactive in problem solving. Unlike graduate students who often volunteer to be subjects for MR sequence testing, clinical patients frequently move during scanning. Even the most subtle head or respiratory motion can significantly impact the quality of the ASL given the subtraction technique that is employed. At our institution, we have developed a filter that detects and discards bad subtraction pairs related to large movements or transient hardware gradient malfunction(43). This filter has markedly improved the quality of our scans; however, it is significantly more difficult to identify motion corrupted data when a patient continuously moves throughout the scan. Vendors will likely employ similar techniques to filter the data and apply motion correction in future ASL iterations. Despite all of these efforts, motion is the single most commonly seen artifact in the clinical population. (Figure 2)
Figure 2.
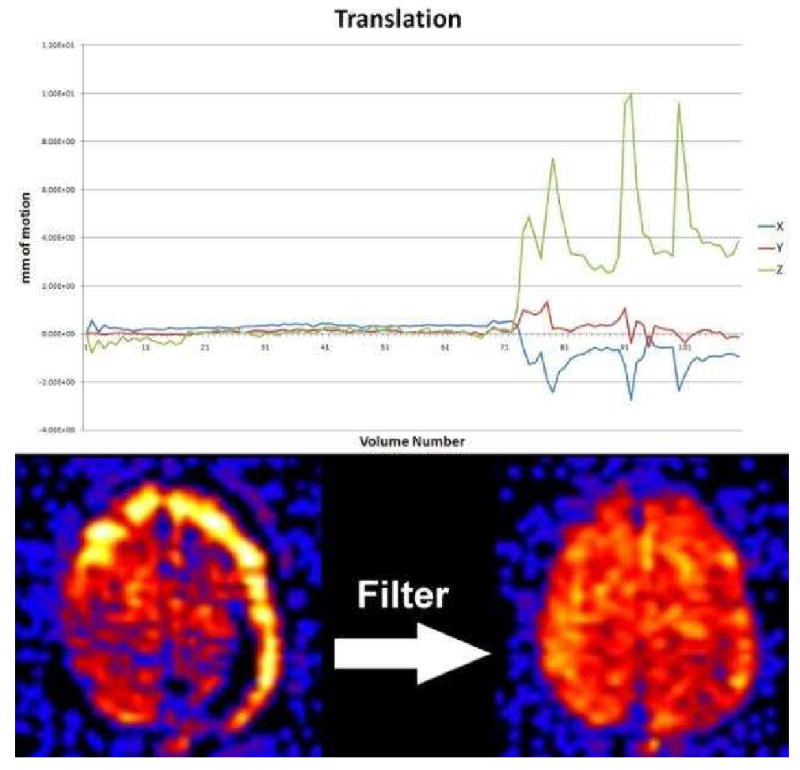
Motion during the ASL examination can result in significant signal loss and characteristic ring of increased signal because ASL is based on subtraction of the control and labeled image pairs. PASL filtering can significantly reduce these artifacts by discarding those image pairs with significant motion. The graph shows translational motion during the exam which had four large spikes during the end of the exam. This manifests on imaging as the ring of high signal at the periphery of the cerebral cortex (bottom left). Filtering discards these image pairs associated with the motion spikes resulting in an image without artifact (bottom right).
Another commonly seen artifact is susceptibility. The ASL sequence frequently employs echo planar imaging (EPI) because of the necessity for rapid acquisition. The downside of EPI is the proclivity of susceptibility artifacts around surgical hardware, craniotomy sites, hemorrhages, calcifications, and the paranasal sinuses. The susceptibility effects create artifactual defects in the perfusion imaging that can easily be misinterpreted as pathology (Figure 3). For example, the susceptibility associated with the paranasal sinus limits the utility of ASL in the medial temporal lobes and skull base(1).
Figure 3. Label panels from Left to Right: A, B.
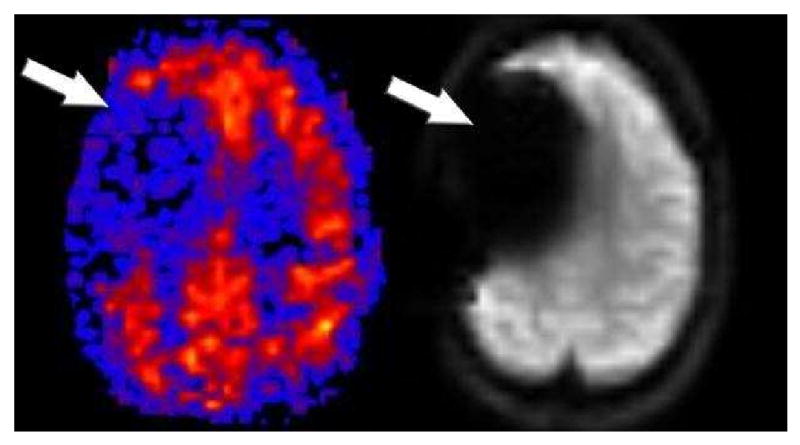
CBF PASL perfusion map shows a large right frontal region of hypoperfusion (A). This apparent perfusion defect is an artifact secondary to the craniotomy clips. The susceptibility artifact is demonstrated on the baseline magnetization echoplanar image (B).
Clinical Applications
In order to interpret pathology on ASL, the radiologist must have an appreciation for the normal patient's ASL image. If quantitative techniques are used with the sequence, marked age dependent variability will be seen. Pediatric patients in the 5-15 year range have some of the highest perfusion values for grey matter(44-46). After approximately age 30, there is a gradual decline in grey mater perfusion (Figure 4). Furthermore, if bipolar crusher gradients are used in the elderly, the anterior and posterior watershed territories will frequently appear more hypoperfused because of the prolonged transit times in these regions (Figure 5a,b,c). If one alters the sequence to prolong the inversion time, the apparent hypoperfusion secondary to transit time delay can be improved.
Figure 4.
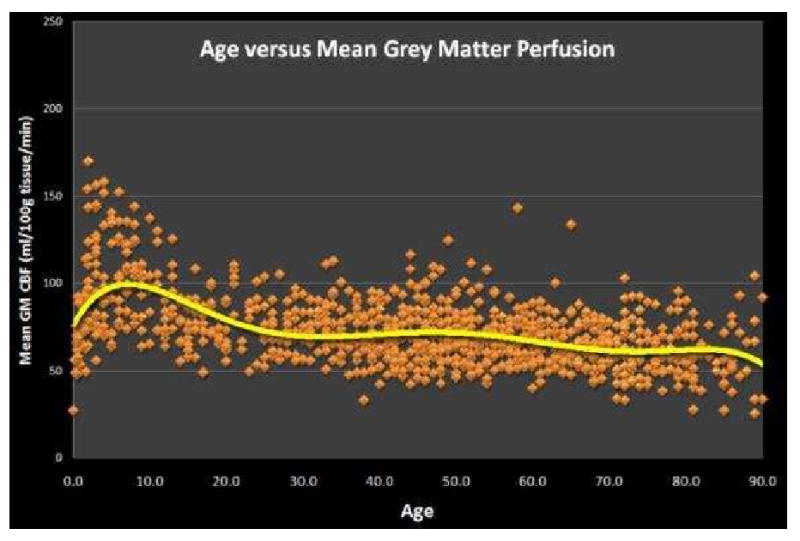
Graph of Age versus Mean Grey Matter Perfusion for 959 normal patients imaged with PASL. Perfusion values peak in the 5-15 year range and then quickly decrease to age 30 after which a slow progressive decline is observed.
Figure 5.
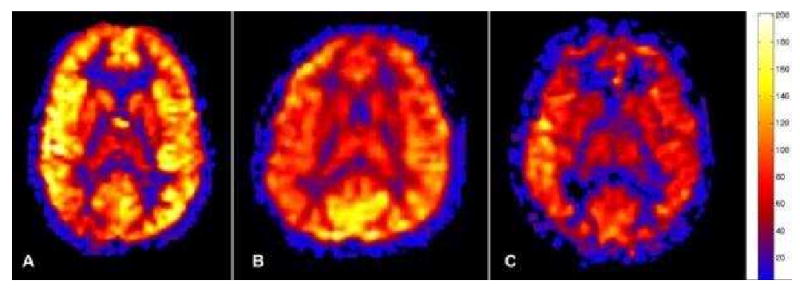
Figure 5a. Normal physiologic pediatric hyperperfusion in a 10 year old patient. Mean GM CBF = 94 mL/100g tissue/min.
Figure 5b. Normal 40 year old PASL cerebral perfusion. Mean GM CBF = 70 mL/100g tissue/min.
Figure 5c. Normal 80 year old cerebral perfusion. Note the areas of apparent hypoperfusion in the anterior and posterior watershed territories. These are frequently encountered and reflect the increasingly slow transit times in the elderly. Mean GM CBF = 49 mL/100g tissue/min.
Cerebral Infarction
One of the most frequent applications of any perfusion technique is in the evaluation of cerebral infarction. In comparison to bolus techniques, standard ASL provides CBF only (47). Cerebral infarction has typically been defined as a CBF below which neuronal metabolism ceases. However in clinical practice, measurement of the blood volume and transit time with perfusion imaging has supplanted the CBF concept. This is due to a practical consequence of the current techniques, as accurate CBF data is notoriously difficult to obtain from bolus perfusion studies. Transit time typically depicts the tissue at risk, while volume shows the area of infarction. The difference between these two values defines the presence or absence of the penumbra(48). Currently, ASL only measures CBF; however, there are some promising techniques on the horizon to generate transit time data(49, 50). This changes the interpretation of perfusion data generated by ASL(2). Our unpublished experience with concomitant ASL and DSC perfusion in stroke imaging, is that the ASL CBF defect most closely corresponds to the transit time defect (Figure 6). When vascular territories are affected by a significant stenosis or occlusion such that perfusion decreases below 15-20 mL/100gtissue/min, the associated diminution in ASL signal makes it difficult to accurately resolve CBF values. This limitation is unfortunately near the threshold to distinguish a penumbra from an infarct. Thus, in the setting of an infarct, the ASL CBF map should be interpreted as showing the tissue at risk if bipolar crusher gradients are used. Traditional diffusion sequences can be used to demonstrate the area of infarction, and the difference between the diffusion abnormality and the ASL CBF defect represents the penumbra. Future applications of ASL using dynamic acquisitions at multiple inversion times may be able to generate arrival time parameters in addition to CBF(51).
Figure 6. Label panels from Left to Right: A, B, C, D.

Diffusion, Negative enhancement integral, Mean time to enhance from dynamic susceptibility contrast perfusion imaging, and PASL perfusion imaging in a patient with a proximal right MCA occlusion. Diffusion restriction is seen the right basal ganglia and insular cortex (arrowhead, A). The diffusion restriction corresponds to decreases in blood volume (blue areas) (arrowhead, B) seen on the negative enhancement integral. The mean time to enhance shows a much larger region of at risk tissue (green area)(arrows, C) surrounding the core infarct. PASL shows a similar region of hypoperfusion (arrows) corresponding to the defect on the mean time to enhance map. (D) PASL perfusion imaging cannot distinguish small perfusion differences below 20 mL/100g/min so infarction looks similar to at risk tissue. In these low flow situations, the PASL perfusion defect is comparable to the mean time to enhance rather than reflecting true CBF.
One significant benefit of incorporating perfusion into all cerebral imaging protocols is the detection of significant perfusion defects before they manifest clinically as infarctions. Large perfusion defects that cannot be otherwise explained as artifactual should warrant further investigations with MR or CT angiography. We have identified several patients imaged for a variety of indications demonstrating normal clinical imaging, and a large perfusion defect on ASL imaging. Follow-up MR, CT, or conventional angiography in many of these patients have demonstrated high grade proximal stenotic lesions amenable to treatment to prevent future ischemic events (Figure 7).
Figure 7. Label panels from Left to Right: A, B, C.
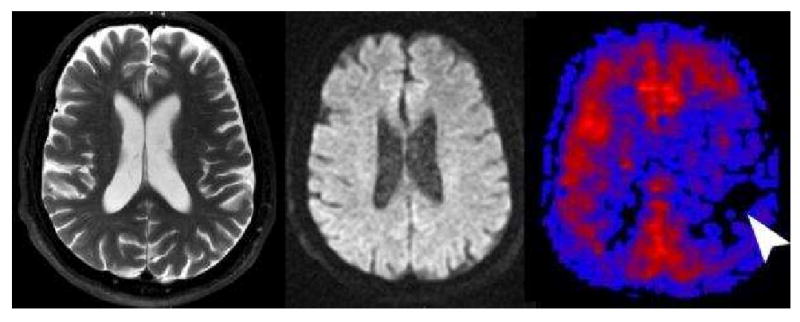
Tissue at Risk. This 70 year old male presented with transient ischemic attacks involving the right sided extremities. T2 (A) and diffusion (B) were normal except for mild diffuse cerebral atrophy. PASL CBF map (C) revealed significant hypoperfusion in the left frontal and parietal hemisphere. The patient had a follow-up CT Angiography showing a high grade stenosis of the left internal carotid artery that was surgically corrected without further clinical sequela.
Perfusion Patters in Stroke with ASL
There are three different patterns of cerebral perfusion associated with cerebral infarction(2) that are primarily based upon the use of bipolar crusher gradients to suppress intravascular signal. In patients with very slow flow, but not complete occlusion, the ASL tag may be suppressed in the vessels at the time of crusher gradient application before deposition in tissue. As such, any prolonged transit time delay will result in a CBF perfusion defect corresponding to that delay. The resulting CBF map will very closely correspond to a transit time map (Figure 6).
The extreme case of slow transit time exists with a Moya-Moya pattern of cerebral perfusion. Moya-Moya is associated with prolonged stenosis resulting in marked development of collateral vessels. Transit time is significantly increased in the small perforating vessels of the basal ganglia and in leptomeningeal collaterals. This increased transit time will manifest as large areas devoid of CBF when ASL is used with crusher gradients because much of the tag remains in the intravascular compartment and is subsequently suppressed. While these patients will frequently have multiple infarctions, the regions devoid of CBF will frequently appear normal on conventional sequences. This discordant finding between perfusion and conventional images should not be misinterpreted as true lack of CBF (Figure 8).
Figure 8.
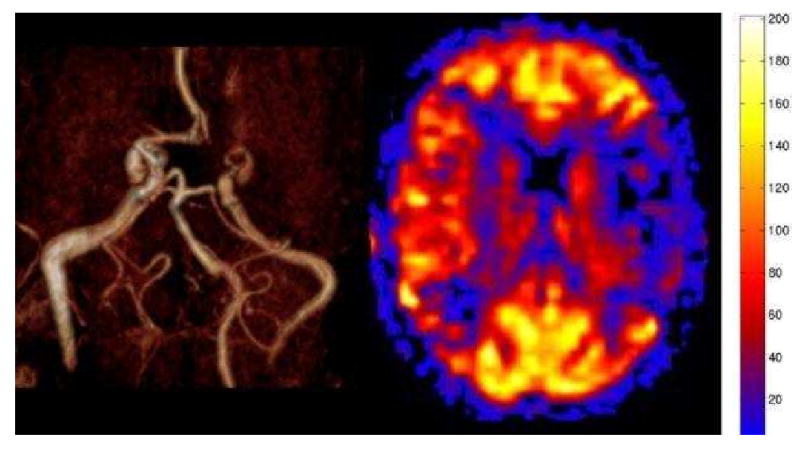
Moya-Moya pattern on PASL. MR angiography shows occlusion of the middle cerebral arteries bilaterally. The MRA also suggests the presence of extensive small vessel collaterals in the basal ganglia. PASL CBF map shows bilateral hypoperfusion in the MCA territories. The perfusion reflects the marked transit time delay due to the suppression of the intravascular signal. The perfusion in the affected territories is underestimated.
The second pattern is encountered when crusher gradients are not used and there is very slow flow. In this setting, the intravascular signal will not be suppressed and the vessels will be visualized. On the CBF map, this non-suppressed very slow flow has the appearance of linear areas of high signal along the cortical margins and affected vessels. This pattern reflects an overestimation of CBF, and the resulting map will more closely correspond to a mix between CBV and transit time depending on the degree of stenosis(52).
The third pattern encountered with cerebral infarction is hyperperfusion. Occasionally thrombotic or embolic infarctions will autolyse or lyse with intravenous or intra-arterial thrombolytic administration. If blood flow is restored to the area of ischemia, the local autoregulatory vasoconstrictive mechanisms may not be able to compensate, resulting in localized vasodilatation. This pattern manifests on ASL as regional areas of hyperperfusion corresponding to the regions of diffusion abnormality(Figure 9)(2).
Figure 9.
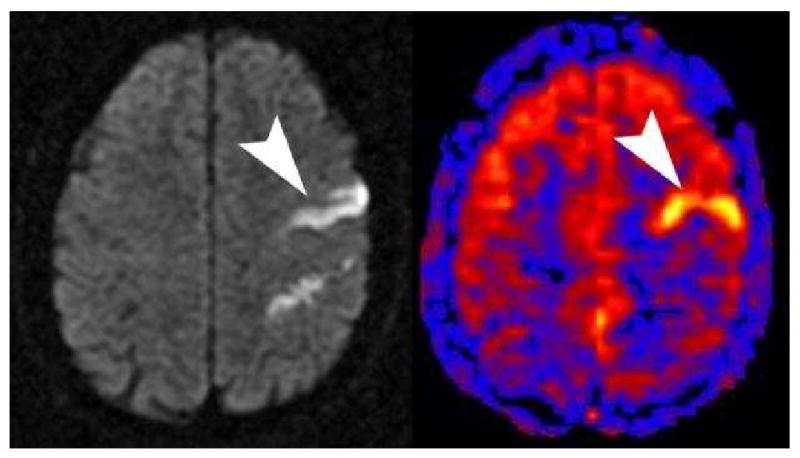
Diffusion shows a linear area of high signal corresponding to a linear area of hyperperfusion on PASL (arrowheads) with a bipolar crusher gradient employed. This pattern of hyperperfusion can be seen when there has been lysis of the thrombus and local autoregulatory dysfunction. A similar appearance can be seen if bipolar crusher gradients are not used and there is slow flow in the region of infarction.
The extreme form of this hyperperfusion in the setting of stroke is seen with anoxic or hypoxic ischemic injury. In a retrospective case series, anoxic patents all demonstrated significant global hyperperfusion with quantitative ASL CBF maps compared to control groups (Figure 10) (2, 6). We believe that a global loss of autoregulation resulted in diffuse vasodilatation and hyperperfusion in those cases. However, not all cases of global hyperperfusion are secondary to anoxic injury. Other etiologies can also show global hyperperfusion, including normal pediatric patients and patients with hypercapnia.
Figure 10.
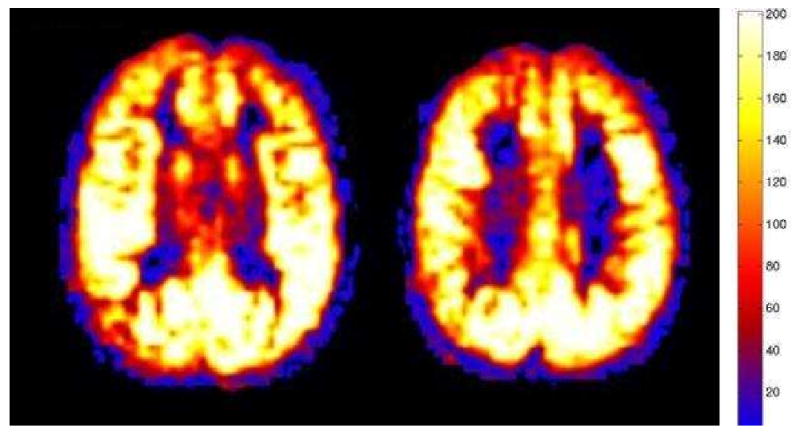
Marked global hyperperfusion is seen post anoxic or hypoxic injury. Conventional sequences (not shown) revealed characteristic diffusion restriction in the basal ganglia and cortex. Mean GM CBF = 190 mL/100g/min.
Tumor Evaluation
Another frequent application of ASL perfusion maps is for the evaluation of an intra or extra-axial neoplastic process. A growing body of research has shown that tumor grade frequently correlates with various perfusion parameters (19, 53-55). Most of the studies have reported CBV measurements based upon contrast bolus techniques. The ASL CBF perfusion data in a tumor is a hybrid affected both by transit time, and blood volume. As tumor studies using ASL emerge, the relationship between CBF and tumor grade will be better defined.
Hypoperfusion
Hypoperfused tumors on ASL are frequently of a lower histologic grade(Figure 11)(53). There are, however, several factors beyond histologic grade that can affect the ASL signal, and several questions must be considered before concluding that a tumor is hypoperfused, and therefore, of low histologic grade. First, has the tumor hemorrhaged, is it cystic, or does it contain calcifications? If the answer to any of these questions is “yes”, then the ASL signal may be artificially low. Has the patient had surgery already? If the answer to this question is “yes,” and metallic craniotomy clips were used, then large artificial perfusion defects may mask an underlying recurrence or primary neoplasm. Finally high grade neoplasms are frequently heterogeneous and may have central necrosis. CBF in these necrotic regions is characteristically low, however, the rim of the mass is typically hyperperfused or similar to grey matter. As such, when measuring the mean perfusion of the tumor with ASL, it is very important to know which portion of the tumor was evaluated.
Figure 11.
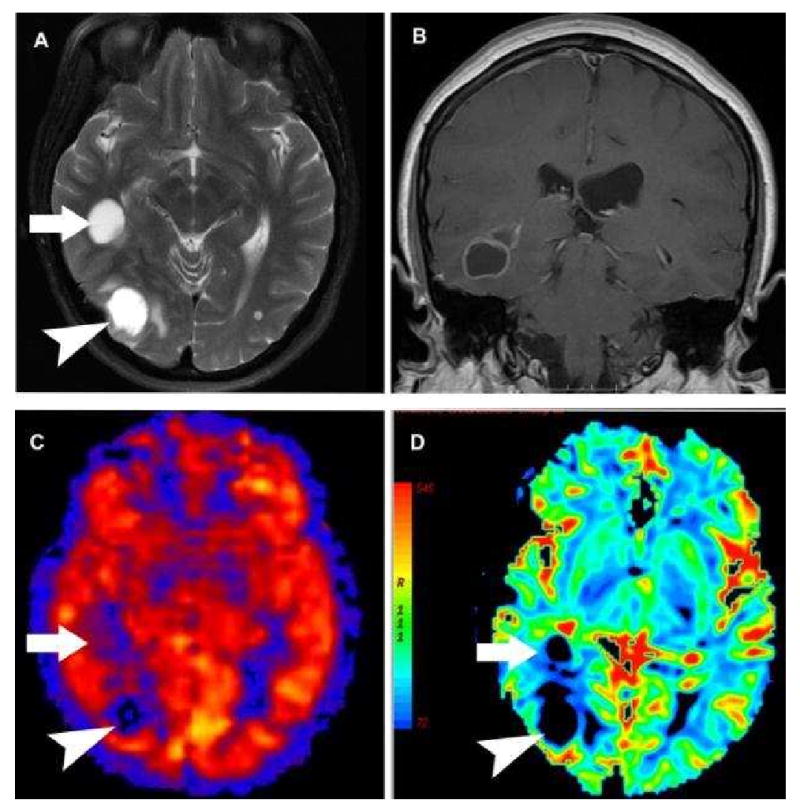
A-D: Hypoperfused cystic non-small cell carcinoma metastasis on PASL. A) Axial T2 weighted image shows two large hyperintense cystic lesions (arrow and arrowhead) with minimal surrounding vasogenic edema. B) Post contrast coronal image shows smooth ring enhancement of the more anterior lesion. C) PASL CBF map shows both lesions to be significantly hypoperfused relative to grey matter. The more anterior lesion (arrow) is centered within the white matter and is less distinct on PASL. D) Negative Enhancement Integral from a DSC contrast perfusion study shows decreased blood volume in both of the cystic masses.
Hyperperfusion
Recent studies have shown that for most PASL imaging applications with malignant neoplasms, the higher the perfusion of the mass, the higher the histologic grade (Figure 15) (19, 53-55). However, not all hyperperfused masses are high grade. Meningiomas tend to be one of the most frequently hyperperfused lesions encountered in clinical practice (Figure 12). The hypervascularity of these lesions is known to correlate with the typical prolonged angiographic blush during contrast administration. The enhancing mural nodule neoplasms, such as hemangioblastomas, are some of the most highly perfused lesions we have encountered (Figure 13). Metastatic lesions that are solid tend to be hyperperfused (Figure 14), while neoplasms that are cystic tend to be hypoperfused (Figure 11). As future studies are performed on different tumor subtypes and grades, guidelines will likely emerge to help differentiate between these lesions. Although hyperperfusion has relatively high positive predictive value in diagnosing a neoplasm, the absence of hyperperfusion may have significant negative predictive value for excluding the presence of a neoplasm. When trying to distinguish malignant high grade tumors from infection or abscess, the perfusion characteristics of the lesion are frequently complementary to conventional sequences. If a lesion appears highly malignant, but the perfusion appears low, then the lesion may contain some intrinsic component, such as blood or calcium, which is causing artifactual hypoperfusion. Alternatively, if no such confounding technical factors are identified, then the etiology of the lesion might need to be reconsidered (Figure 16).
Figure 15. Label panels from Left to Right: A, B.
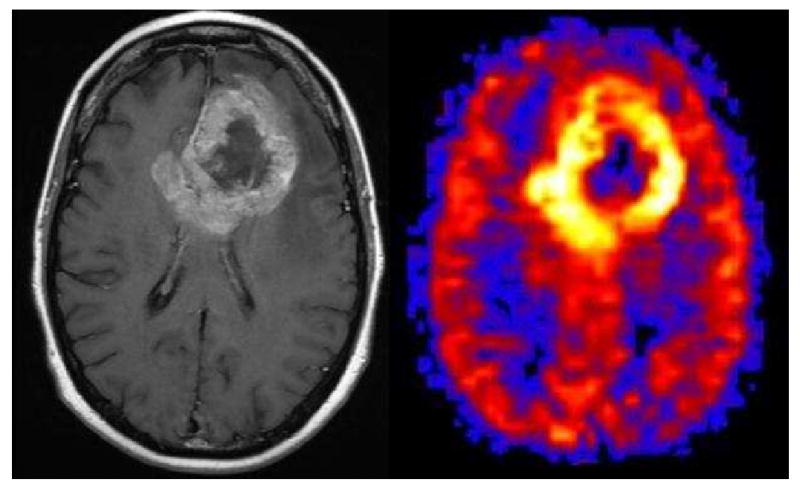
Glioblastoma Multiforme. A large irregular ring enhancing mass is seen in the left frontal lobe on the post contrast image (A). The PASL CBF map shows marked hyperperfusion corresponding to the ring enhancing portion of the tumor and central hypoperfusion corresponding to the central necrotic areas (B).
Figure 12.
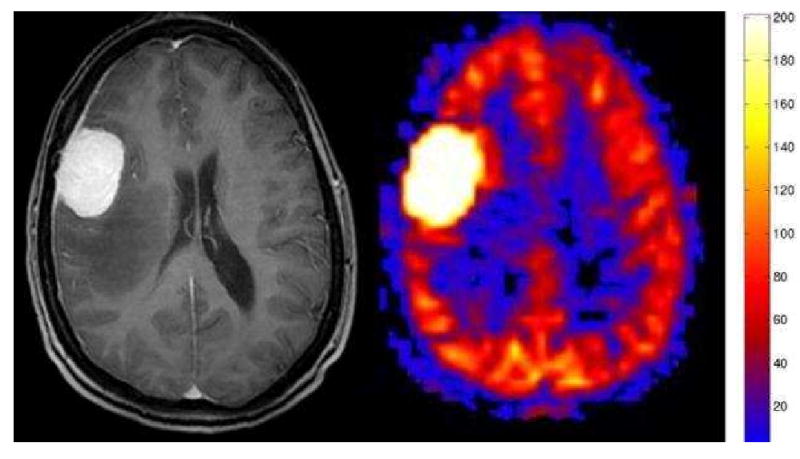
Meningioma. Axial post contrast image shows a dural based mass with avid homogenous enhancement and associated enhancing dural tail. PASL CBF map shows dramatic characteristic hyperperfusion.
Figure 13.
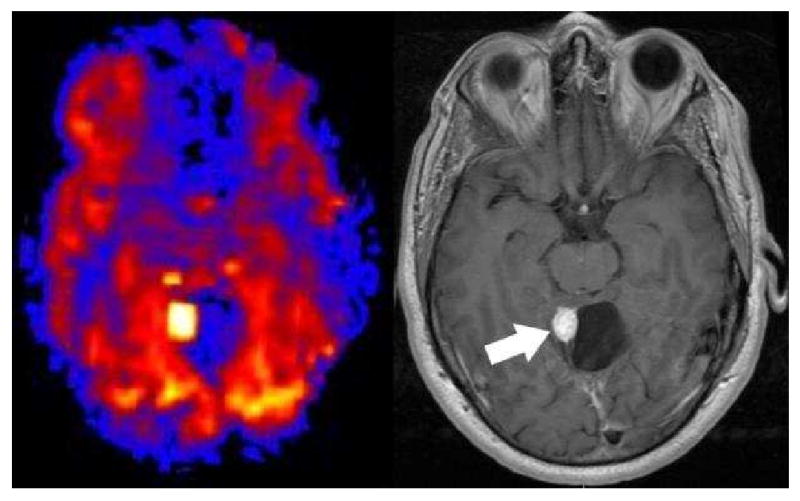
Hemangioblastoma. PASL CBF map shows an intensely hyperperfused posterior fossa nodule adjacent to a hypoperfused cyst. Post contrast T-1 imaging shows the intensely enhancing mural nodule and cyst.
Figure 14.
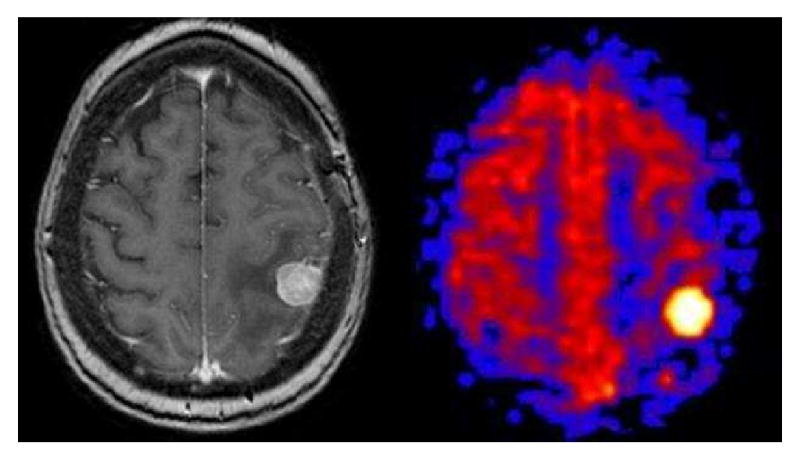
Solid Breast Metastasis. Axial post-contrast T1 weighted image shows a solid enhancing focus in the posterior left frontal lobe with surrounding vasogenic edema. PASL CBF map shows an intensely hyperperfused focus.
Figure 16. Label panels from Left to Right: A, B, C.
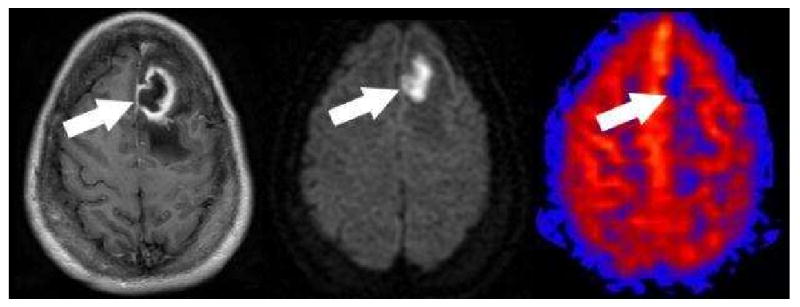
Pyogenic Cerebral Abscess. Post contrast (A) axial T-1 image shows irregular thick ring enhancement with surrounding edema (arrow). The center of the lesion shows homogenous restricted diffusion (B). PASL CBF map (C) shows hypoperfusion corresponding to the center of the lesion (arrow). No hyperperfusion corresponding to the enhancing rim can be identified.
Infectious Etiologies
The imaging appearance of CNS infection can occasionally be confused for a neoplastic process. In our experience with PASL, most infections demonstrate hypoperfusion (Figure 16). However, infectious conditions can also present with hyperperfusion. Cortical hyperperfusion, for example, can be seen adjacent to epidural abscesses, and with conditions such as herpes encephalitis. Even in those cases where there is adjacent cerebritis, the abscess itself usually remains hypoperfused (Figure 17).
Figure 17. Label panels from Left to Right: A, B, C.
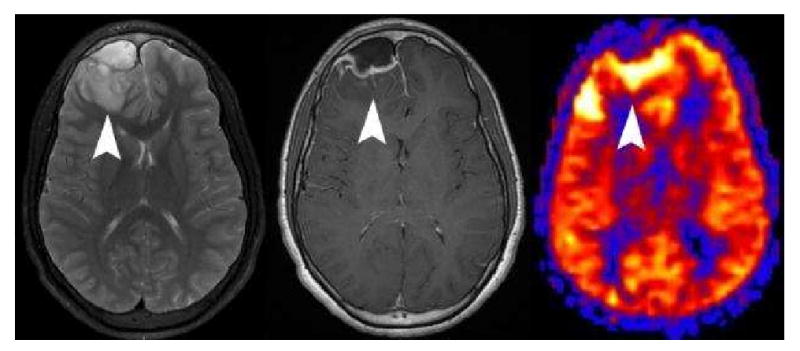
Cerebritis adjacent to an epidural abscess. Axial T2 weighted image (A) shows an epidural fluid collection and adjacent edema (arrowhead) in the right frontal lobe. Post contrast imaging (B) shows a rim enhancing epidural fluid collection, faint enhancement in the adjacent parenchyma (arrowhead), and enhancement of the right frontal subarachnoid spaces. PASL CBF map (C) demonstrates marked hyperperfusion of the edematous cortex (arrowhead).
Physiologic Quantification
One of the benefits of using quantitative ASL in a clinical population is that physiologic processes that affect global cerebral perfusion can be readily detected. Qualitative perfusion measurements can show relative perfusion differences quite reliably, however, if the process is global or symmetric, it may become difficult if not impossible to detect. One of the main driving forces behind cerebral perfusion is CO2. The autoregulatory mechanisms of the CNS are exquisitely sensitive to both hypercapnia and hypocapnia(56-58). Hypercapnia produces cerebrovascular vasodilatation that increases in a linear fashion up to pCO2 values of 75 mm Hg. It has been shown that hypercapnia can produce global CNS hyperperfusion without concomitant imaging findings on conventional MRI sequences (Figure 18) (5). Similarly, hypocapnia secondary to hyperventilation can result in vasoconstriction and subsequent hypoperfusion(5, 59-62). Indeed, hypocapnia can result in global hypoperfusion that is severe enough to markedly decrease the amount of usable ASL signal, resulting in uninterpretable perfusion data in an otherwise clinically normal appearing patient. These changes in physiologic perfusion may manifest while imaging ventilator dependent, emphysematous, or claustrophobic patients.
Figure 18.
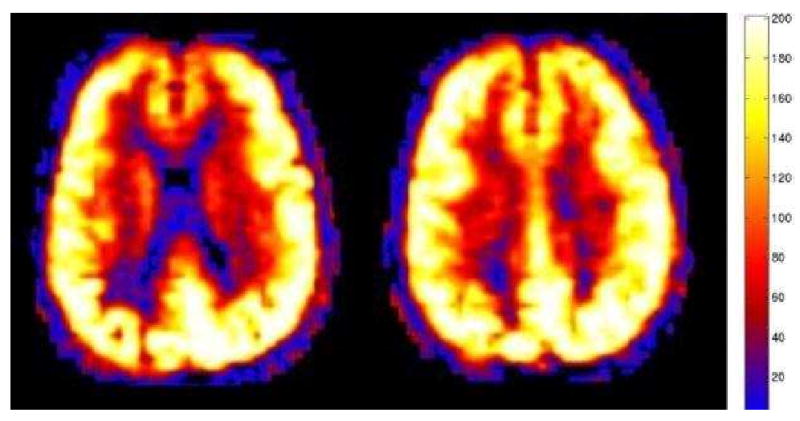
Hypercapnia. Global hyperperfusion (mean GM CBF = 168.4) is seen in this 60 year old patient with normal conventional imaging findings, but marked hypercapnia. This patient had a subsequent arterial blood gas PCO2 measurement of 76.6 mm Hg (normal range 35-45 mm Hg).
Pediatric Patients
The pediatric patient population is one of the optimal groups for clinical ASL because reliable perfusion imaging can be obtained without the use of ionizing radiation or power injection of intravenous contrast materials. The sequence is safe to repeat for the reacquisition of data if an error should occur. Pediatric patients have intrinsically higher cerebral blood flow that can be detected and quantified using ASL. As such, the same global perfusion values cannot be used as “normal” for adult and pediatric populations. Our data has shown three discrete patterns of cerebral perfusion in pediatric patients. There is a rapid increase in cerebral perfusion between birth and age 3. Cerebral perfusion then plateaus between age 4 and 11, such that rates of CBF in the majority of children in this age group are greater than 90 ml/100g/min. Cerebral perfusion rapidly decreases after age 11, such that rates of CBF in most adolescents and young adults (age 12-30) are less than 90 ml/100g/min (Figure 4). From age 30 to 90 years, there is a very slow decline in mean CBF(11).
Imaging very young pediatric patients presents a few problems for the ASL sequence. Because of the small size of the head and neck in a newborn, if the tag is applied well below the imaging plane, some of the tagged blood may actually be in the aortic arch and go to the arms and body rather than the brain. This will result in a loss of signal and apparent cerebral hypoperfusion. For very young patients, the sequence should be modified to compensate for these differences in size (44, 45).
Regional Causes of Hyperperfusion
Seizure
Epileptic foci have been studied extensively using nuclear medicine perfusion techniques. These methods require an ictal injection of a radiotracer, with a subsequent inter-ictal injection. Such techniques capture a snapshot of cerebral perfusion at the time of tracer injection. Although we do not have a dedicated protocol for seizure imaging with ASL, we have incidentally captured several patients in the immediate post-ictal state. These ASL perfusion scans unambiguously demonstrated regional hyperperfusion corresponding to the abnormal cortical focus localized via clinical presentation and EEG monitoring (Figure 19). ASL has been most successful in demonstrating supratentorial, extra temporal seizure foci (63). Mesial temporal sclerosis has been difficult to image because of the susceptibility secondary to the proximity to the skull base and sphenoid sinus(64). Unlike nuclear medicine studies, ASL is repeatable over short time intervals. This property may lend itself to near real-time dynamic imaging of the cerebral perfusion during the immediate post-ictal state.
Figure 19.
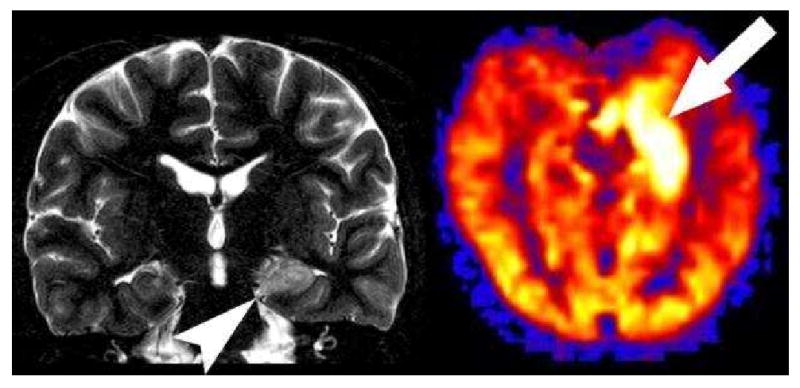
Hyperperfused seizure focus. Coronal T2 image shows increased signal in the left hippocampus (arrowhead). PASL CBF map reveals marked hyperperfusion in the medial left temporal lobe corresponding to the increased signal within the left hippocampus in this patient with a recent left temporal lobe seizure.
The majority of clinical seizure patients will be imaged in the inter-ictal state. The seizure foci in these patients, unless they have a form of subclinical epileptic activity, will show hypoperfusion in the involved cortex (Figure 20) (2, 63). If the rare post-ictal patient is imaged, hyperperfusion has been shown with ASL up to 1 hour after seizure onset(4).
Figure 20. Label panels from Left to Right: A, B.
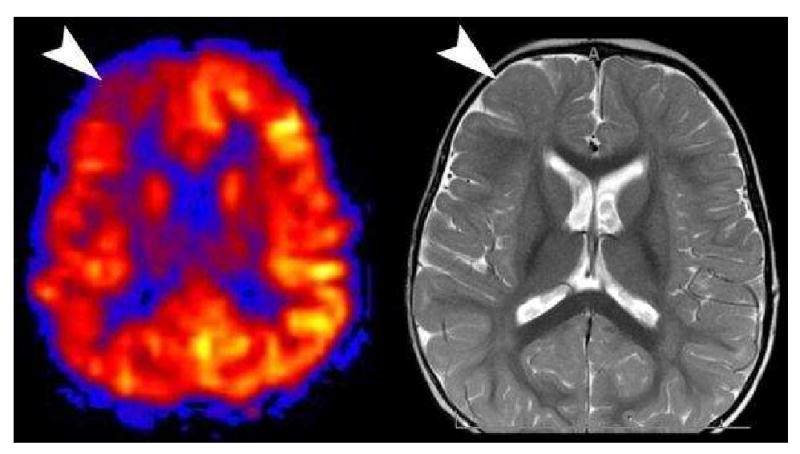
Hypoperfused Seizure Focus. Hypoperfusion is seen in the right frontal lobe (arrowhead) in this interictal pediatric patient (A). A second look at axial T2 image (B) from the conventional sequences revealed a very subtle migrational anomaly with thickening in the right frontal cortex (arrowhead).
Posterior Reversible Encephalopathy Syndrome
A significant number studies have sought to elucidate the pathogenesis of the posterior reversible encephalopathy syndrome (PRES). Various theories from vasoconstriction to vasodilation have been proposed, but no one theory can account for the disparities in the clinical imaging and perfusion data(65-67). PRES on ASL can also have a variety of appearances. We have found that patients who are imaged acutely show hyperperfusion in the occipital and frontal hemispheres and patients who are imaged in the subacute phase show hypoperfusion in the occipital and frontal hemispheres (Figure 21)(10). The variability and apparent discrepancies between studies investigating perfusion changes related to PRES may be secondary to the time-course of the disease.
Figure 21.
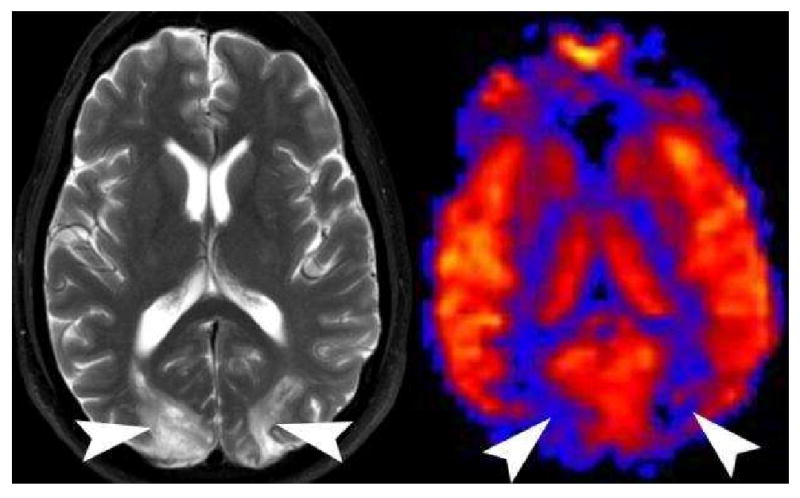
Posterior Reversible Encephalopathy Syndrome (PRES) on PASL. Axial T2 weighted image shows increased symmetric bilateral signal in the occipital hemispheres (arrowheads). PASL CBF map reveals significant hypoperfusion in the corresponding vascular territories (arrowheads). PRES appears to have a time dependent appearance. Patients imaged acutely tend to have hyperperfusion in the affected territories, while those patients imaged in the subacute phase are hypoperfused.
Migraine
Migraine headaches are occasionally imaged during the acute phase because the aura symptoms can mimic cerebral infarction. If the migraine patient happens to be imaged while having aura symptoms, ASL will show hypoperfusion in the cortex thought to correspond to those symptoms. More commonly the patients will present to medical attention during the aura phase only to later develop a headache near the time of imaging. If migraine patients are imaged during the headache phase, hyperperfusion will be seen in the cortex thought to correspond to the prior aura symptoms (Figure 22)(68-71). Conventional sequences are usually normal, but they may show some subtle cortical edema(8).
Figure 22.
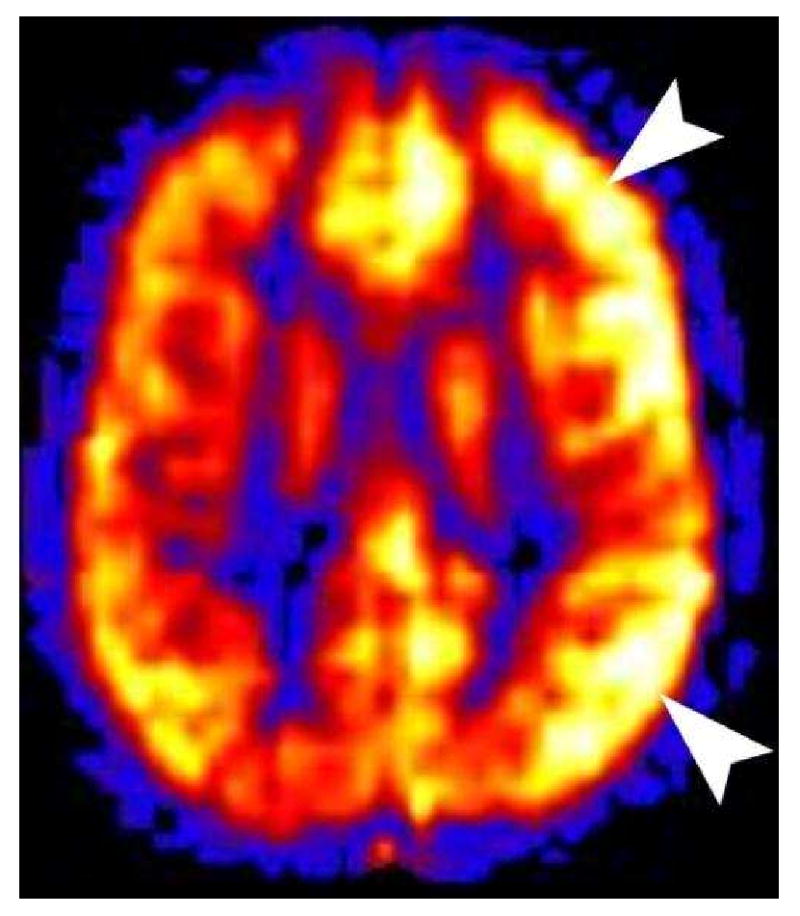
Hemiplegic Migraine. This 11 year old male presented with right hemiplegia followed by a severe migraine headache. All conventional sequences were normal. PASL showed marked hyperperfusion in the left cerebral cortex. Hyperperfusion of the symptomatic cortex is seen in patients imaged during the migraine headache. Hypoperfusion is seen if the patient is imaged during the aura phase.
Immunocompromised Patients
One occasional diagnostic dilemma in the immunocompromised patient is differentiating toxoplasmosis versus lymphoma. Our clinical experience with ASL has shown that all cases of toxoplasmosis to date have been hypoperfused (Figure 23) and the cases of lymphoma have been hyperperfused (Figure 24). This simple distinction has proven reliable so far, but a larger study will be needed to confirm this hypothesis.
Figure 23.
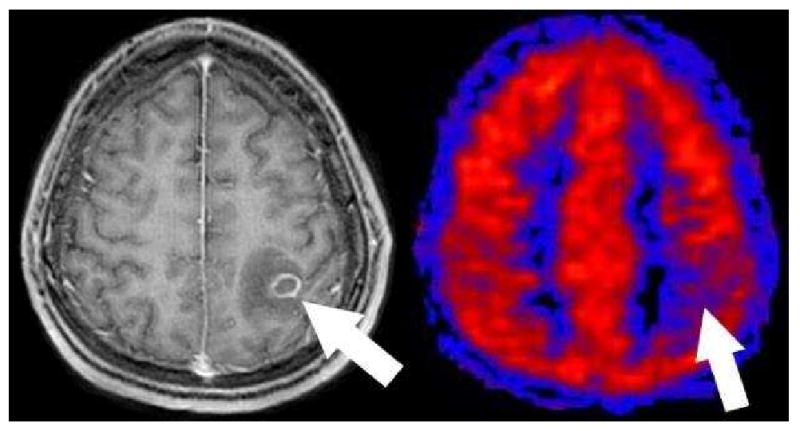
Toxoplasmosis on PASL. Axial post contrast T1 image shows a ring enhancing mass with surrounding edema in this immunocompromised patient (arrow). PASL CBF map shows that the lesion is hypoperfused relative to grey matter. This hypoperfused pattern has been consistently seen in all toxoplasmosis cases to date and may be useful to help distinguish toxoplasmosis from lymphoma.
Figure 24.
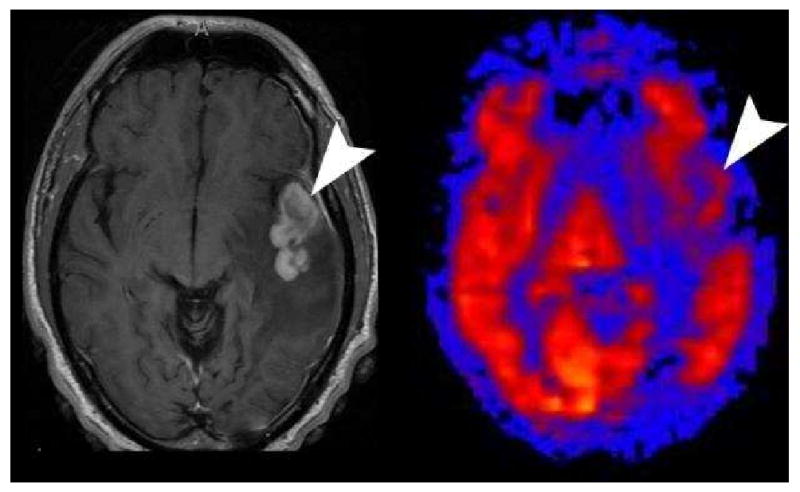
Lymphoma on PASL. Axial post contrast images shows a solid enhancing mass (arrowhead) in the left temporal lobe with surrounding vasogenic edema in this immunocompromised patient. PASL CBF map shows the mass to have similar perfusion to the adjacent grey matter in this case of lymphoma.
Future Developments
Even though ASL is being introduced into routine clinical imaging by several MRI vendors, the perfusion sequence remains a work in progress. Potentially ASL's greatest barrier to clinical acceptance will be the lack of consistency in methodology and results. The number of options available may appear daunting. Future iterations of the sequence will continue to be optimized and evolve as advancements are made in the technology and scanners. Some techniques on the horizon that may be introduced into the sequence include propeller imaging, artifact reduction, territorial mapping(72, 73), and T1 mapping.
Extracranial Perfusion
The ASL methodology is ideal for the cerebral circulation. There is little susceptibility in the cerebral hemispheres and the brain doesn't move very much. As the ASL acquisition is extended inferiorly, increasing susceptibility artifacts at the skull base and near the paranasal sinuses are encountered. However, we have frequently imaged the orbits as part of the standard brain protocol with mixed degrees of success. Occasionally very vascular masses and infectious processes have shown hyperperfusion on ASL. The significance of the hyperperfusion in this setting is uncertain at this point, but as the susceptibility artifacts are reduced in the future, the ASL technique may be increasingly successful in imaging the skull base and extracranial soft tissues (Figure 25) (9).
Figure 25.
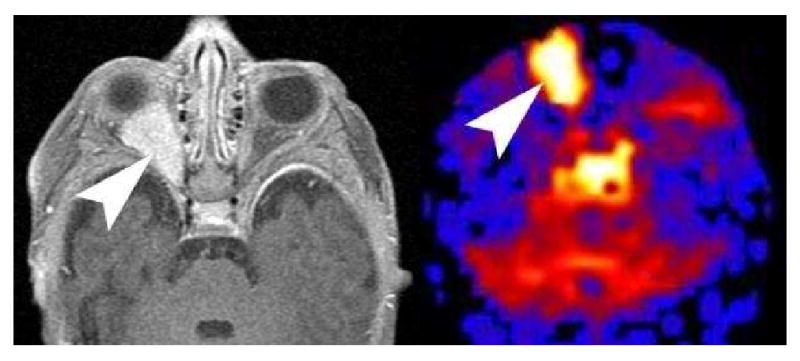
PASL imaging of the Orbit. Axial post contrast imaging of orbits shows an avidly enhancing right retro bulbar mass in an infant consistent with an infantile hemangioma. PASL CBF map reveals significant hyperperfusion in the mass. PASL imaging of the orbit is technically challenging because of the susceptibility artifacts from the paranasal sinuses and skull base. In infants, the relative lack of pneumatization may allow for more successful imaging of orbital masses.
Transit Times
Commonly employed ASL techniques only provide CBF. Much of the literature on stroke, penumbra, and tumors relies on transit time and blood volume parameters. In the future multiphase dynamic ASL with multiple inversion times will be available. From this single multiphase acquisition, voxel wise signal intensity vs. time curves can be generated which can yield time to peak and tag arrival time information. While not a true transit time, these dedicated timing parameter maps will be a great addition to clinical perfusion imaging(50).
Summary
ASL has broad clinical applications in a routine neuroradiology practice. General understanding of the technique and the options employed by the vendor are essential for accurate interpretation.
Acknowledgments
This work was supported by the Human Brain Project and NIBIB through grant numbers EB004673 and EB004673-02S2, and EB003880. This work was also partially supported by the Center for Biomolecular Imaging of Wake Forest University School of Medicine.
Footnotes
There are no conflicts of interest. This work was supported by the Human Brain Project and NIBIB through grant numbers EB004673 and EB004673-02S2
Publisher's Disclaimer: This is a PDF file of an unedited manuscript that has been accepted for publication. As a service to our customers we are providing this early version of the manuscript. The manuscript will undergo copyediting, typesetting, and review of the resulting proof before it is published in its final citable form. Please note that during the production process errors may be discovered which could affect the content, and all legal disclaimers that apply to the journal pertain.
Contributor Information
Huan Tan, Email: htan@wfubmc.edu.
Robert A. Kraft, Email: bkraft@wfubmc.edu.
Christopher T. Whitlow, Email: cwhitlow@wfubmc.edu.
Jonathan H. Burdette, Email: jburdett@wfubmc.edu.
Joseph A. Maldjian, Email: Maldjian@wfubmc.edu.
References
- 1.Deibler AR, Pollock JM, Kraft RA, Tan H, Burdette JH, Maldjian JA. Arterial spin-labeling in routine clinical practice, part 1: technique and artifacts. AJNR Am J Neuroradiol. 2008;29:1228–1234. doi: 10.3174/ajnr.A1030. [DOI] [PMC free article] [PubMed] [Google Scholar]
- 2.Deibler AR, Pollock JM, Kraft RA, Tan H, Burdette JH, Maldjian JA. Arterial spin-labeling in routine clinical practice, part 2: hypoperfusion patterns. AJNR Am J Neuroradiol. 2008;29:1235–1241. doi: 10.3174/ajnr.A1033. [DOI] [PMC free article] [PubMed] [Google Scholar]
- 3.Maldjian JA, Laurienti PJ, Burdette JH, Kraft RA. Clinical implementation of spin-tag perfusion magnetic resonance imaging. J Comput Assist Tomogr. 2008;32:403–406. doi: 10.1097/RCT.0b013e31816b650b. [DOI] [PubMed] [Google Scholar]
- 4.Pollock JM, Deibler AR, West TG, Burdette JH, Kraft RA, Maldjian JA. Arterial Spin-Labeled Magnetic Resonance Imaging in Hyperperfused Seizure Focus: A Case Report. J Comput Assist Tomogr. 2008;32:291–292. doi: 10.1097/RCT.0b013e31814cf81f. [DOI] [PubMed] [Google Scholar]
- 5.Pollock JM, Deibler AR, Whitlow CT, et al. Manifestations of Hyper and Hypocapnia on Arterial Spin Labeled MRI Perfusion Imaging. AJNR Am J Neuroradiol. 2008 doi: 10.3174/ajnr.A1095. In Press. [DOI] [PMC free article] [PubMed] [Google Scholar]
- 6.Pollock JM, Whitlow CT, Deibler AR, et al. Anoxic injury-associated cerebral hyperperfusion identified with arterial spin-labeled MR imaging. AJNR Am J Neuroradiol. 2008;29:1302–1307. doi: 10.3174/ajnr.A1095. [DOI] [PMC free article] [PubMed] [Google Scholar]
- 7.Deibler AR, Pollock JM, Kraft RA, Tan H, Burdette JH, Maldjian JA. Arterial spin-labeling in routine clinical practice, part 3: hyperperfusion patterns. AJNR Am J Neuroradiol. 2008;29:1428–1435. doi: 10.3174/ajnr.A1034. [DOI] [PMC free article] [PubMed] [Google Scholar]
- 8.Pollock JM, Deibler AR, Burdette JH, et al. Migraine associated cerebral hyperperfusion with arterial spin-labeled MR imaging. AJNR Am J Neuroradiol. 2008;29:1494–1497. doi: 10.3174/ajnr.A1115. [DOI] [PMC free article] [PubMed] [Google Scholar]
- 9.Pollock JM, Kraft RA, Tan H, Maldjian JA. Arterial Spin Labeled Perfusion Imaging of the Orbit: Initial Experience. American Society of Head and Neck Radiology 42th Annual Meeting; Toronto, Canada; 2008. [Google Scholar]
- 10.Whitlow CT, Pollock JM, Kraft RA, et al. American Society of Functional Neuroradiology. Orlando, Florida: 2008. Evolving Temporal Changes in Cerebral Blood Flow Associated with Posterior Reversible Encephalopathy Syndrome: A Magnetic Resonance Arterial Spin Labeling Investigation. [Google Scholar]
- 11.Whitlow CT, Pollock JM, Mussat-Whitlow B, et al. Changes in Global Rates of Cerebral Perfusion Associated with Normal Development as Measured with MR Arterial Spin Labeling. American Society of Neuroradiology 46th Annual Meeting; New Orleans, Louisiana. 2008. [Google Scholar]
- 12.Detre JA, Zhang W, Roberts DA, et al. Tissue specific perfusion imaging using arterial spin labeling. NMR Biomed. 1994;7:75–82. doi: 10.1002/nbm.1940070112. [DOI] [PubMed] [Google Scholar]
- 13.Alsop DC, Detre JA. Multisection cerebral blood flow MR imaging with continuous arterial spin labeling. Radiology. 1998;208:410–416. doi: 10.1148/radiology.208.2.9680569. [DOI] [PubMed] [Google Scholar]
- 14.Williams DS, Detre JA, Leigh JS, Koretsky AP. Magnetic resonance imaging of perfusion using spin inversion of arterial water. Proc Natl Acad Sci U S A. 1992;89:212–216. doi: 10.1073/pnas.89.1.212. [DOI] [PMC free article] [PubMed] [Google Scholar]
- 15.Sadowski EA, Bennett LK, Chan MR, et al. Nephrogenic systemic fibrosis: risk factors and incidence estimation. Radiology. 2007;243:148–157. doi: 10.1148/radiol.2431062144. [DOI] [PubMed] [Google Scholar]
- 16.Yang Y, Frank JA, Hou L, Ye FQ, McLaughlin AC, Duyn JH. Multislice imaging of quantitative cerebral perfusion with pulsed arterial spin labeling. Magn Reson Med. 1998;39:825–832. doi: 10.1002/mrm.1910390520. [DOI] [PubMed] [Google Scholar]
- 17.Wintermark M, Sesay M, Barbier E, et al. Comparative overview of brain perfusion imaging techniques. Stroke. 2005;36:e83–99. doi: 10.1161/01.STR.0000177884.72657.8b. [DOI] [PubMed] [Google Scholar]
- 18.Chawla S, Wang S, Wolf RL, et al. Arterial spin-labeling and MR spectroscopy in the differentiation of gliomas. AJNR Am J Neuroradiol. 2007;28:1683–1689. doi: 10.3174/ajnr.A0673. [DOI] [PMC free article] [PubMed] [Google Scholar]
- 19.Noguchi T, Yoshiura T, Hiwatashi A, et al. Perfusion imaging of brain tumors using arterial spin-labeling: correlation with histopathologic vascular density. AJNR Am J Neuroradiol. 2008;29:688–693. doi: 10.3174/ajnr.A0903. [DOI] [PMC free article] [PubMed] [Google Scholar]
- 20.Luh WM, Wong EC, Bandettini PA, Hyde JS. QUIPSS II with thin-slice TI1 periodic saturation: a method for improving accuracy of quantitative perfusion imaging using pulsed arterial spin labeling. Magn Reson Med. 1999;41:1246–1254. doi: 10.1002/(sici)1522-2594(199906)41:6<1246::aid-mrm22>3.0.co;2-n. [DOI] [PubMed] [Google Scholar]
- 21.Gunther M, Bock M, Schad LR. Arterial spin labeling in combination with a look-locker sampling strategy: inflow turbo-sampling EPI-FAIR (ITS-FAIR) Magn Reson Med. 2001;46:974–984. doi: 10.1002/mrm.1284. [DOI] [PubMed] [Google Scholar]
- 22.Buxton RB, Frank LR, Wong EC, Siewert B, Warach S, Edelman RR. A general kinetic model for quantitative perfusion imaging with arterial spin labeling. Magn Reson Med. 1998;40:383–396. doi: 10.1002/mrm.1910400308. [DOI] [PubMed] [Google Scholar]
- 23.Edelman RR, Siewert B, Darby DG, et al. Qualitative mapping of cerebral blood flow and functional localization with echo-planar MR imaging and signal targeting with alternating radio frequency. Radiology. 1994;192:513–520. doi: 10.1148/radiology.192.2.8029425. [DOI] [PubMed] [Google Scholar]
- 24.Kim SG, Tsekos NV. Perfusion imaging by a flow-sensitive alternating inversion recovery (FAIR) technique: application to functional brain imaging. Magn Reson Med. 1997;37:425–435. doi: 10.1002/mrm.1910370321. [DOI] [PubMed] [Google Scholar]
- 25.Wong EC, Buxton RB, Frank LR. Implementation of quantitative perfusion imaging techniques for functional brain mapping using pulsed arterial spin labeling. NMR Biomed. 1997;10:237–249. doi: 10.1002/(sici)1099-1492(199706/08)10:4/5<237::aid-nbm475>3.0.co;2-x. [DOI] [PubMed] [Google Scholar]
- 26.Yongbi MN, Yang Y, Frank JA, Duyn JH. Multislice perfusion imaging in human brain using the C-FOCI inversion pulse: comparison with hyperbolic secant. Magn Reson Med. 1999;42:1098–1105. doi: 10.1002/(sici)1522-2594(199912)42:6<1098::aid-mrm14>3.0.co;2-1. [DOI] [PubMed] [Google Scholar]
- 27.Detre JA, Leigh JS, Williams DS, Koretsky AP. Perfusion imaging. Magn Reson Med. 1992;23:37–45. doi: 10.1002/mrm.1910230106. [DOI] [PubMed] [Google Scholar]
- 28.Detre JA, Alsop DC. Perfusion magnetic resonance imaging with continuous arterial spin labeling: methods and clinical applications in the central nervous system. Eur J Radiol. 1999;30:115–124. doi: 10.1016/s0720-048x(99)00050-9. [DOI] [PubMed] [Google Scholar]
- 29.Liu TT, Brown GG. Measurement of cerebral perfusion with arterial spin labeling: Part 1. Methods J Int Neuropsychol Soc. 2007;13:517–525. doi: 10.1017/S1355617707070646. [DOI] [PubMed] [Google Scholar]
- 30.Wu WC, Fernandez-Seara M, Detre JA, Wehrli FW, Wang J. A theoretical and experimental investigation of the tagging efficiency of pseudocontinuous arterial spin labeling. Magn Reson Med. 2007;58:1020–1027. doi: 10.1002/mrm.21403. [DOI] [PubMed] [Google Scholar]
- 31.Petersen ET, Zimine I, Ho YC, Golay X. Non-invasive measurement of perfusion: a critical review of arterial spin labelling techniques. Br J Radiol. 2006;79:688–701. doi: 10.1259/bjr/67705974. [DOI] [PubMed] [Google Scholar]
- 32.Garcia DM, Bazelaire CD, Alsop D. Pseudo-continuous Flow Driven Adiabatic Inversion for Aterial Spin Labeling. ISMRM 05; 2005. [Google Scholar]
- 33.Wong EC, Cronin M, Wu WC, Inglis B, Frank LR, Liu TT. Velocity-selective arterial spin labeling. Magn Reson Med. 2006;55:1334–1341. doi: 10.1002/mrm.20906. [DOI] [PubMed] [Google Scholar]
- 34.Calamante F, Thomas DL, Pell GS, Wiersma J, Turner R. Measuring cerebral blood flow using magnetic resonance imaging techniques. J Cereb Blood Flow Metab. 1999;19:701–735. doi: 10.1097/00004647-199907000-00001. [DOI] [PubMed] [Google Scholar]
- 35.St Lawrence KS, Frank JA, Bandettini PA, Ye FQ. Noise reduction in multi-slice arterial spin tagging imaging. Magn Reson Med. 2005;53:735–738. doi: 10.1002/mrm.20396. [DOI] [PubMed] [Google Scholar]
- 36.Ye FQ, Frank JA, Weinberger DR, McLaughlin AC. Noise reduction in 3D perfusion imaging by attenuating the static signal in arterial spin tagging (ASSIST) Magn Reson Med. 2000;44:92–100. doi: 10.1002/1522-2594(200007)44:1<92::aid-mrm14>3.0.co;2-m. [DOI] [PubMed] [Google Scholar]
- 37.Brown GG, Clark C, Liu TT. Measurement of cerebral perfusion with arterial spin labeling: Part 2. Applications J Int Neuropsychol Soc. 2007;13:526–538. doi: 10.1017/S1355617707070634. [DOI] [PMC free article] [PubMed] [Google Scholar]
- 38.Wolf RL, Wang J, Detre JA, Zager EL, Hurst RW. Arteriovenous shunt visualization in arteriovenous malformations with arterial spin-labeling MR imaging. AJNR Am J Neuroradiol. 2008;29:681–687. doi: 10.3174/ajnr.A0901. [DOI] [PMC free article] [PubMed] [Google Scholar]
- 39.Lu H, Clingman C, Golay X, van Zijl PC. Determining the longitudinal relaxation time (T1) of blood at 3.0 Tesla. Magn Reson Med. 2004;52:679–682. doi: 10.1002/mrm.20178. [DOI] [PubMed] [Google Scholar]
- 40.Silvennoinen MJ, Kettunen MI, Kauppinen RA. Effects of hematocrit and oxygen saturation level on blood spin-lattice relaxation. Magn Reson Med. 2003;49:568–571. doi: 10.1002/mrm.10370. [DOI] [PubMed] [Google Scholar]
- 41.Zhernovoi AI, Sharshina LM. Effects of hematocrit on blood proton relaxation time. Med Tekh. 1997:33–34. [PubMed] [Google Scholar]
- 42.Buxton RB. Quantifying CBF with arterial spin labeling. J Magn Reson Imaging. 2005;22:723–726. doi: 10.1002/jmri.20462. [DOI] [PubMed] [Google Scholar]
- 43.Tan H, Maldjian JA, Burdette JH, Deibler AR, Pollock JM, Kraft RA. PASL Filtering: A Method of Improving Clinical Perfusion Imaging. ISMRM; Toronto, Canada. 2008. [Google Scholar]
- 44.Wang J, Licht DJ. Pediatric perfusion MR imaging using arterial spin labeling. Neuroimaging Clin N Am. 2006;16:149–167. ix. doi: 10.1016/j.nic.2005.10.002. [DOI] [PubMed] [Google Scholar]
- 45.Wang J, Licht DJ, Jahng GH, et al. Pediatric perfusion imaging using pulsed arterial spin labeling. J Magn Reson Imaging. 2003;18:404–413. doi: 10.1002/jmri.10372. [DOI] [PubMed] [Google Scholar]
- 46.Wang Z, Fernandez-Seara M, Alsop DC, et al. Assessment of functional development in normal infant brain using arterial spin labeled perfusion MRI. Neuroimage. 2008;39:973–978. doi: 10.1016/j.neuroimage.2007.09.045. [DOI] [PMC free article] [PubMed] [Google Scholar]
- 47.Wolf RL, Alsop DC, McGarvey ML, Maldjian JA, Wang J, Detre JA. Susceptibility contrast and arterial spin labeled perfusion MRI in cerebrovascular disease. J Neuroimaging. 2003;13:17–27. [PubMed] [Google Scholar]
- 48.Markus HS. Cerebral perfusion and stroke. J Neurol Neurosurg Psychiatry. 2004;75:353–361. doi: 10.1136/jnnp.2003.025825. [DOI] [PMC free article] [PubMed] [Google Scholar]
- 49.Barbier EL, Silva AC, Kim SG, Koretsky AP. Perfusion imaging using dynamic arterial spin labeling (DASL) Magn Reson Med. 2001;45:1021–1029. doi: 10.1002/mrm.1136. [DOI] [PubMed] [Google Scholar]
- 50.Wang J, Alsop DC, Song HK, et al. Arterial transit time imaging with flow encoding arterial spin tagging (FEAST) Magn Reson Med. 2003;50:599–607. doi: 10.1002/mrm.10559. [DOI] [PubMed] [Google Scholar]
- 51.Hendrikse J, van Osch MJ, Rutgers DR, et al. Internal carotid artery occlusion assessed at pulsed arterial spin-labeling perfusion MR imaging at multiple delay times. Radiology. 2004;233:899–904. doi: 10.1148/radiol.2333031276. [DOI] [PubMed] [Google Scholar]
- 52.Ye FQ, Mattay VS, Jezzard P, Frank JA, Weinberger DR, McLaughlin AC. Correction for vascular artifacts in cerebral blood flow values measured by using arterial spin tagging techniques. Magn Reson Med. 1997;37:226–235. doi: 10.1002/mrm.1910370215. [DOI] [PubMed] [Google Scholar]
- 53.Kim HS, Kim SY. A prospective study on the added value of pulsed arterial spin-labeling and apparent diffusion coefficients in the grading of gliomas. AJNR Am J Neuroradiol. 2007;28:1693–1699. doi: 10.3174/ajnr.A0674. [DOI] [PMC free article] [PubMed] [Google Scholar]
- 54.Warmuth C, Gunther M, Zimmer C. Quantification of blood flow in brain tumors: comparison of arterial spin labeling and dynamic susceptibility-weighted contrast-enhanced MR imaging. Radiology. 2003;228:523–532. doi: 10.1148/radiol.2282020409. [DOI] [PubMed] [Google Scholar]
- 55.Wolf RL, Wang J, Wang S, et al. Grading of CNS neoplasms using continuous arterial spin labeled perfusion MR imaging at 3 Tesla. J Magn Reson Imaging. 2005;22:475–482. doi: 10.1002/jmri.20415. [DOI] [PubMed] [Google Scholar]
- 56.Noth U, Kotajima F, Deichmann R, Turner R, Corfield DR. Mapping of the cerebral vascular response to hypoxia and hypercapnia using quantitative perfusion MRI at 3 T. NMR Biomed. 2007 doi: 10.1002/nbm.1210. [DOI] [PubMed] [Google Scholar]
- 57.Noth U, Meadows GE, Kotajima F, Deichmann R, Corfield DR, Turner R. Cerebral vascular response to hypercapnia: determination with perfusion MRI at 1.5 and 3.0 Tesla using a pulsed arterial spin labeling technique. J Magn Reson Imaging. 2006;24:1229–1235. doi: 10.1002/jmri.20761. [DOI] [PubMed] [Google Scholar]
- 58.Raichle ME, Stone HL. Cerebral blood flow autoregulation and graded hypercapnia. Eur Neurol. 1971;6:1–5. doi: 10.1159/000114443. [DOI] [PubMed] [Google Scholar]
- 59.Faraci FM, Breese KR, Heistad DD. Cerebral vasodilation during hypercapnia. Role of glibenclamide-sensitive potassium channels and nitric oxide Stroke. 1994;25:1679–1683. doi: 10.1161/01.str.25.8.1679. [DOI] [PubMed] [Google Scholar]
- 60.Floyd TF, Clark JM, Gelfand R, et al. Independent cerebral vasoconstrictive effects of hyperoxia and accompanying arterial hypocapnia at 1 ATA. J Appl Physiol. 2003;95:2453–2461. doi: 10.1152/japplphysiol.00303.2003. [DOI] [PubMed] [Google Scholar]
- 61.Raichle ME, Plum F. Hyperventilation and cerebral blood flow. Stroke. 1972;3:566–575. doi: 10.1161/01.str.3.5.566. [DOI] [PubMed] [Google Scholar]
- 62.Raichle ME, Posner JB, Plum F. Cerebral blood flow during and after hyperventilation. Arch Neurol. 1970;23:394–403. doi: 10.1001/archneur.1970.00480290014002. [DOI] [PubMed] [Google Scholar]
- 63.Wolf RL, Alsop DC, Levy-Reis I, et al. Detection of mesial temporal lobe hypoperfusion in patients with temporal lobe epilepsy by use of arterial spin labeled perfusion MR imaging. AJNR Am J Neuroradiol. 2001;22:1334–1341. [PMC free article] [PubMed] [Google Scholar]
- 64.Engelhorn T, Doerfler A, Weise J, Baehr M, Forsting M, Hufnagel A. Cerebral perfusion alterations during the acute phase of experimental generalized status epilepticus: prediction of survival by using perfusion-weighted MR imaging and histopathology. AJNR Am J Neuroradiol. 2005;26:1563–1570. [PMC free article] [PubMed] [Google Scholar]
- 65.Bartynski WS. Posterior reversible encephalopathy syndrome, part 1: fundamental imaging and clinical features. AJNR Am J Neuroradiol. 2008;29:1036–1042. doi: 10.3174/ajnr.A0928. [DOI] [PMC free article] [PubMed] [Google Scholar]
- 66.Bartynski WS. Posterior reversible encephalopathy syndrome, part 2: controversies surrounding pathophysiology of vasogenic edema. AJNR Am J Neuroradiol. 2008;29:1043–1049. doi: 10.3174/ajnr.A0929. [DOI] [PMC free article] [PubMed] [Google Scholar]
- 67.Bartynski WS, Boardman JF, Zeigler ZR, Shadduck RK, Lister J. Posterior reversible encephalopathy syndrome in infection, sepsis, and shock. AJNR Am J Neuroradiol. 2006;27:2179–2190. [PMC free article] [PubMed] [Google Scholar]
- 68.Friberg L, Olesen J, Lassen NA, Olsen TS, Karle A. Cerebral oxygen extraction, oxygen consumption, and regional cerebral blood flow during the aura phase of migraine. Stroke. 1994;25:974–979. doi: 10.1161/01.str.25.5.974. [DOI] [PubMed] [Google Scholar]
- 69.Goadsby PJ. Migraine pathophysiology. Headache. 2005;45 1:S14–24. doi: 10.1111/j.1526-4610.2005.4501003.x. [DOI] [PubMed] [Google Scholar]
- 70.Hsu DA, Stafstrom CE, Rowley HA, Kiff JE, Dulli DA. Hemiplegic migraine: Hyperperfusion and abortive therapy with intravenous verapamil. Brain Dev. 2008;30:86–90. doi: 10.1016/j.braindev.2007.05.013. [DOI] [PubMed] [Google Scholar]
- 71.Jacob A, Mahavish K, Bowden A, Smith ET, Enevoldson P, White RP. Imaging abnormalities in sporadic hemiplegic migraine on conventional MRI, diffusion and perfusion MRI and MRS. Cephalalgia. 2006;26:1004–1009. doi: 10.1111/j.1468-2982.2006.01131.x. [DOI] [PubMed] [Google Scholar]
- 72.Lim CC, Petersen ET, Ng I, Hwang PY, Hui F, Golay X. MR regional perfusion imaging: visualizing functional collateral circulation. AJNR Am J Neuroradiol. 2007;28:447–448. [PMC free article] [PubMed] [Google Scholar]
- 73.Golay X, Petersen ET, Hui F. Pulsed star labeling of arterial regions (PULSAR): a robust regional perfusion technique for high field imaging. Magn Reson Med. 2005;53:15–21. doi: 10.1002/mrm.20338. [DOI] [PubMed] [Google Scholar]


