Abstract
Escherichia coli O157: H7 is detected using a remote-query (wireless, passive) magnetoelastic sensor platform to which a 1 µm-thick layer of Bayhydrol 110 and then a layer of functionalized mannose is applied. The multivalent binding of lectin concanavalin A (Con A) to the E. coli surface O-antigen and mannose favors the strong adhesion of E. coli to the mannose modified magnetoelastic sensor; E. coli is rigidly and strongly attached on the mannose-modified sensor through Con A, which works as a bridge to bind to the E. coli surface O-antigen and mannose modified sensor surface. As E. coli is bound to the sensor its resonance frequency shifts, enabling quantification of E. coli concentration with a limit of detection of 60 cells/mL and a linear logarithmic response range of 6.0×101 to 6.1×10⁹ cells/mL. The analysis can be directly conducted without incubation, and completed in 3 h or less.
1. Introduction
Escherichia coli (E. coli) O157:H7 is a pathogenic bacterium capable of contaminating foodstuffs causing food poisoning, urinary tract infections, inflammations and peritonitis.1 Rapid, accurate methods for bacterial detection are essential with respect to food poisoning as well as water contamination and, therefore, treatment options. Detection methods developed over the past several decades include DNA and RNA probes,2, 3 piezoelectric quartz crystal techniques,4 surface plasmon resonance (SPR),5, 6 polymerase chain reaction (PCR)-based analysis,7, 8 flow cytometry methods,9 immunomagnetic separation (ISM) analysis,10, 11 bulk acoustic wave impedance biosensor,12 micro-electromechanical analysis,13–15 bioluminescent assay,16 fluorescent in situ hybridization (FISH),17 optical tweezers18 and nucleic acid sequence-based amplification (NASBA).19 Most conventional methods are time-consuming, often requiring 1–2 days to obtain results. Although much faster detection methods such as immunosensors or DNA chips are becoming available, they have failed to gain wide acceptance due to the relatively high degree of user expertise required and high cost of labeling reagents. As a result, a rapid, quantitative, sensitive, and specific method for one-step bacterial detection is highly sought after.
The development and application of wireless, passive magnetoelastic sensors have been reported over the past ten years.20–37 Typically the sensor is a free standing, ribbon-like magnetoelastic thick-film coupled with a chemical or biochemical sensing layer such as an enzyme. In response to an externally applied time-varying magnetic field the magnetoelastic sensor mechanically vibrates at a characteristic resonance frequency, launching a return magnetic field that can be remotely detected using a pickup coil.21, 22 No physical contact between the sensor and the detection system are required for signal telemetry. Since the sensor is powered by the interrogation signal, no internal power supplies, i.e. a battery, are needed. Various magnetoelastic sensors have been developed including sensors for remote-query monitoring of gastric pH,22 glucose,23 organophosphorus pesticides,33 and microorganisms.25–27, 35–37 A magnetoelastic immunosensor for the detection of E. coli O157: H7 was reported 25 through immobilizing alkaline phosphatase-labeled anti-E. coli O157: H7 antibody on the sensor surface, with the mass change associated with the antibody–antigen binding reaction amplified by biocatalytic precipitation of 5-bromo-4-chloro-3-indolyl phosphate. Other magnetoelastic biosensors based on antigen–antibody reaction include one for Salmonella typhimurium, 26 and the use of a biosensor array for the simultaneous quantification of multiple bioagents including E. coli O157: H7, staphylococcal enterotoxin B, and ricin.27 Magnetoelastic sensors for the detection of Pseudomonas aeruginosa (P. aeruginosa)34 was reported based on the growth curves of bacteria. The reported wireless magnetoelastic microorganism biosensors were based either on the antibody-antigen binding reaction in combination with enzyme amplification,25–27 or the growth curve of the microoganism during the incubation.34 The antibody-antigen binding reaction cannot be used for the detection of unknown species, and the incubation method is not suitable for rapid detection.
In this article, a wireless magnetoelastic biosensor for direct and rapid detection of Gram-negative bacteria, E. coli O157: H7 without incubation is reported. As the direct adsorption of bacteria on the magnetoelastic sensor results in little response with low sensitivity, sensor sensitivity is enhanced by using Con A which increased the binding sites of E. coli on the sensor surface.38 The multivalent binding of Con A to the E. coli surface O-antigen sustains the strong adhesion of E. coli to the mannose modified biosensor surface by forming bridges between mannose and E. coli surface O-antigen.38 The specific binding property of Con A to O-antigen and mannose promotes the specificity of the sensor in response to Gram-negative bacteria. The wireless operation characteristics of the magnetoelastic sensor are of great utility in aseptic environment for microbial analysis.
2. Experimental
2.1 Materials and reagents
Mannose and Con A were purchased from Jie Hui biology Company (P.R.China). Phosphate, acetone, calcium chloride and manganese acetate were purchased from commercial sources and used as received. 400 nM Con A solution in saline was prepared by dissolving the required amount of Con A in a pH 7.2 PBS solution. Dimethyl aminopropyl-3-ethylcarbodiimide (EDC), and N-hydroxysuccinimide (NHS) were purchased from Aldrich and used as received. All chemicals were of analytical grade.
Bayhydrol 110, an anionic dispersion of aliphatic polyester urethane resin in water/N-methyl-2-pyrrolidone solution (50%, w/v) was purchased from Bayer Corporation (Pittsburgh, PA, USA). E. coli O157:H7 was generously provided by the Department of Life Science of Hunan Normal University (China). The culture medium (CM) is a nutrient broth (NB) prepared by adding 0.5 g beef extract, 1 g peptone, and 0.5 g sodium chloride in 100 mL distilled water. After adjusting the pH to 7.2 using sodium hydroxide, the mixture was sterilized in an autoclave at 121 °C for 20 min. 100 mL of the NB was seeded with E. coli and incubated for 18 h at 37 °C, then stored at 4 °C as a stock solution. The concentration of E. coli in the stock solution was determined by plate counts (PC). Distilled and deionized water was used throughout the experiment.
Freestanding magnetoelastic thick films comprised of Metglas alloy 2826 (Fe40Ni38Mo4B18) were purchased from Honeywell Corporation (Minneapolis, MN, USA) were used throughout this work as the sensor substrate. Each sensor was 22 mm×6 mm×28 µm in size. The resonant frequency of an un-coated sensor in air is approximately 102.5 kHz.
2.2 Sensor fabrication
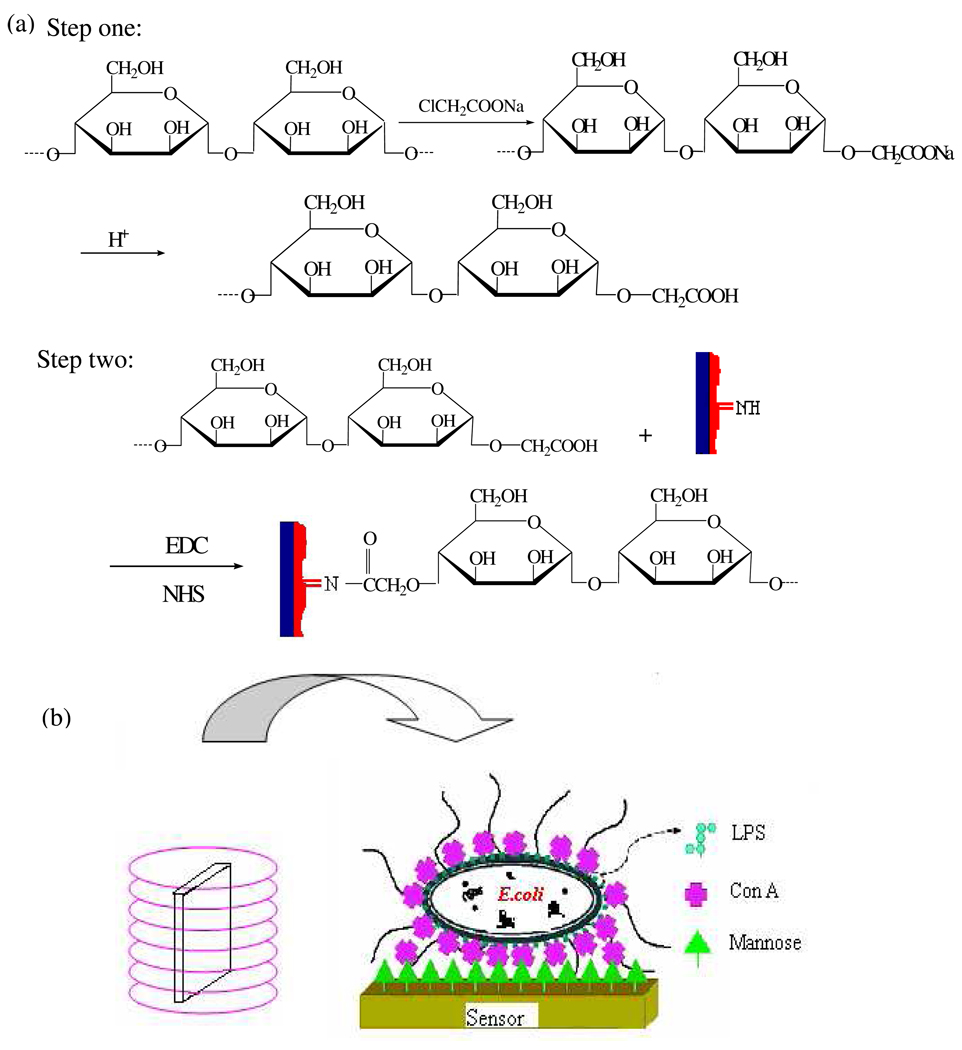
Fig. 1 represents the route of the sensor fabrication. The magnetoelastic sensor was ultrasonically cleaned in Micro-Cleaning solution, followed by a water and acetone rinse, and then dried in air. About 2 µL 40% Bayhydrol 110 (density of 1 g/cm3) was applied upon the sensor resulting in a 1 µm thick protective film. The polyurethane-coated sensor was dried in air and then heated at 150 °C or 2 h to form a robust protective membrane, which offered a NH group for linking the modified mannose and protected the iron-rich magnetoelastic substrate from corrosion.
Fig. 1.
(a) Fabrication sequence of sensor. (b) Illustration depicting the structure of the mannose-magnetoelastic sensor. The sensor is placed within a vial containing the test solution, which is then placed inside a signal telemetry coil. The electronic sensor-reader electronics are interfaced to a computer via a RS232 port for data display and storage.
Mannose was carboxyl functionalized 39 as shown in Fig. 1(a). Briefly 0.5 g mannose, 7.4 mL 1.35 M sodium monochloracetate, 1 mL 10 M sodium hydroxide, and 1.6 mL water were added to a 25 mL flask. After stirred for 7 h at room temperature, 2 mL 1 M monopotassium phosphate was added into the flask to stop the reaction. The resulted solution was adjusted to pH 5.2 with hydrochloric acid.
50 µL of the carboxyl funcionalized mannose solution (16.67 g/L) containing 0.46 g/L EDC and 0.38 g/L NHS was applied on the polyurethane-coated sensor and dried in air. The mole ratio of NHS and EDC to mannose is 3.2 and 2.9%, respectively. Activated by EDC and NHS, mannose was bonded on the sensor surface through amide bond between polyurethane and mannose.
2.3 Detection of E. coli
The as-prepared sensor was vertically and freely placed in a 2.5 mL vial which was stood in a coil connected to a magnetoelastic sensor reader. The resonance frequency was monitored by the magnetoelastic sensor reader, using a frequency counting technique of the pulse-wise excited sensor, the details of which can be found in literatures.22, 23 The electronics are interfaced to a computer via a RS232 port to facilitate measurement control and data processing.
Different quantities of E. coli were added in the 2.5 mL sterilized vial in which 1.5 mL of CM or water was added. With addition of Con A the resonance frequency of the sensor was recorded every 1 min. The temperature was kept at 37± 1 °C using a thermostatic water jacket.
3. Result and discussion
3.1 The sensor response
Otto et al 40, 41 showed the direct adhesion of E. coli onto the mannose immobilized sensor surface is quiet flexible. Structural studies indicate that the major bacterial cell wall component in Gram-negative bacteria such as E. coli consists of a class of glycoconjugates called lipopolysaccharides (LPS).42 LPS is capped by a single O-antigen subunit consisting of glucose, N-acetylglucosamine, galactose, and rhamnose.38 The distinct surface LPS can be recognized by specific lectins. Con A, a multivalent binding protein isolated from Jack bean (Canavalian ensiformis) is the most widely used and well-characterized mannose- and glucose-binding lectin. Con A can aggregate on specific terminal carbohydrates of bacterial surface LPS with different binding ability.38 The multivalent binding of Con A to the E. coli surface O-antigen glucose receptor favors the strong adhesion of E. coli to mannose immobilized on the sensor as schematically shown in Fig. 1.
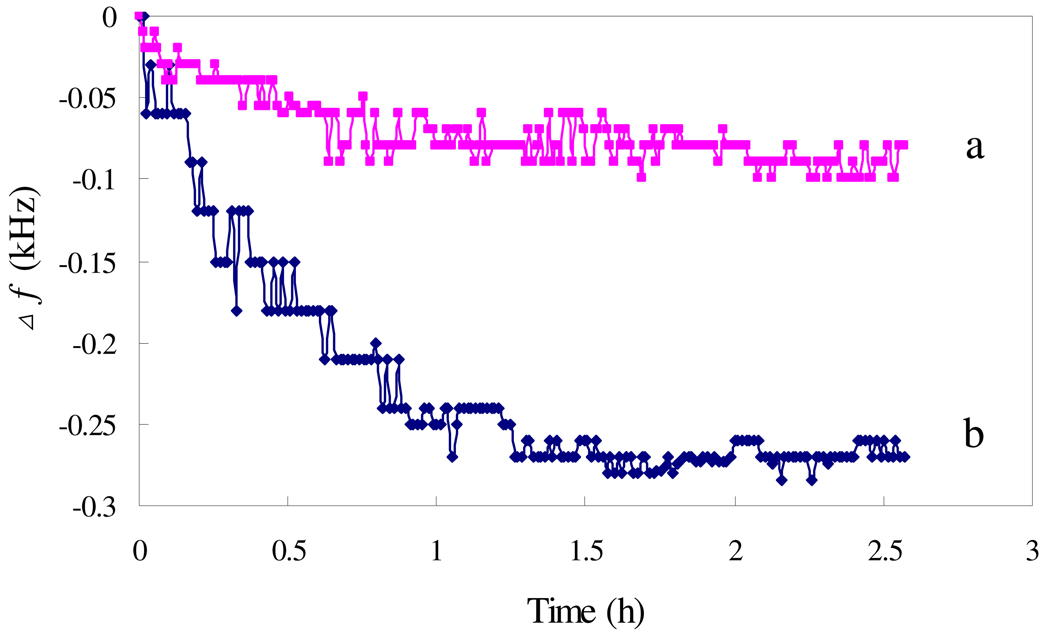
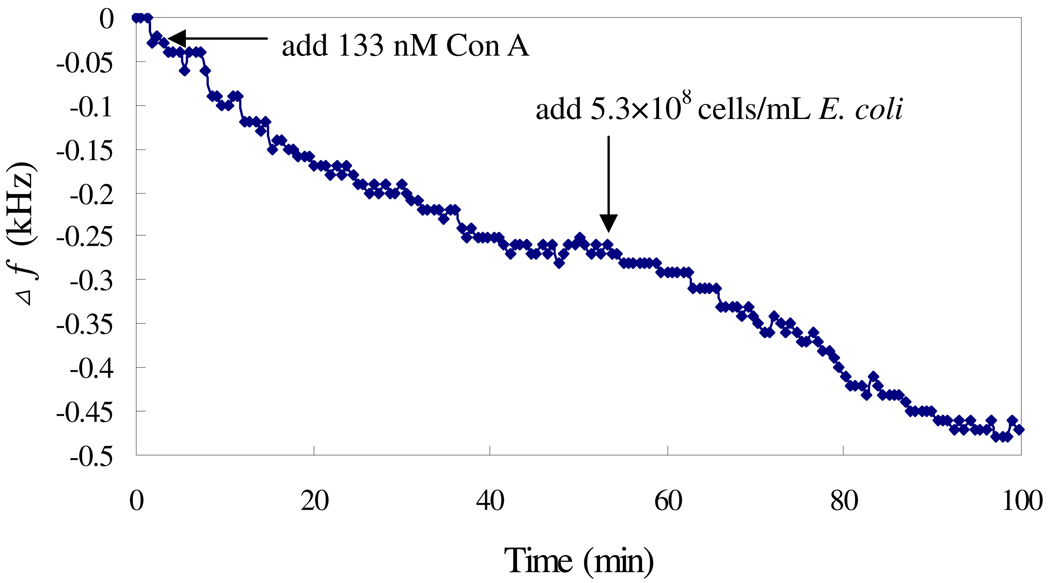
Fig. 2 shows the responses of the sensor modified with or without mannose to the addition of the mixture of E. coli and Con A. The frequency shifts of the unmodified sensor in the response to E. coli indicate the inherent attaching property of microorganisms on the sensor surface. The modification of the sensor with mannose results in a greater frequency shift as compared with the unmodified sensor, indicating the enhanced adhesion ability of E. coli to mannose immobilized sensor due to the multivalent binding of Con A to the E. coli surface O-antigen and mannose. In a 8.3×10⁷ cells/mL E. coli solution, the Δf of mannose applied sensor was about 240 Hz, while that of unmodified sensor was 80 Hz. To further investigate the role of Con A, Con A and E. coli were introduced into the test solution in serial, and the response is shown in Fig. 3. The addition of 133 nM Con A results in a frequency shift of 260 Hz within 40 min, and following addition of 5.31×10⁸ cell/mL E. coli results in a frequency shift of 210 Hz within another 40 min. These results indicate that Con A can bind with both mannose and E. coli..
Fig. 2.
The influence of mannose: (a) mannose was not applied to sensor, and (b) mannose was applied to sensors. The Con A concentration was 100 nM, with 8.3×10⁷ cells/mL of E. coli.
Fig. 3.
Frequency change vs time when Con A solution and E. coli were sequentially added to the mannose-sensor. The Con A concentration was 133 nM.
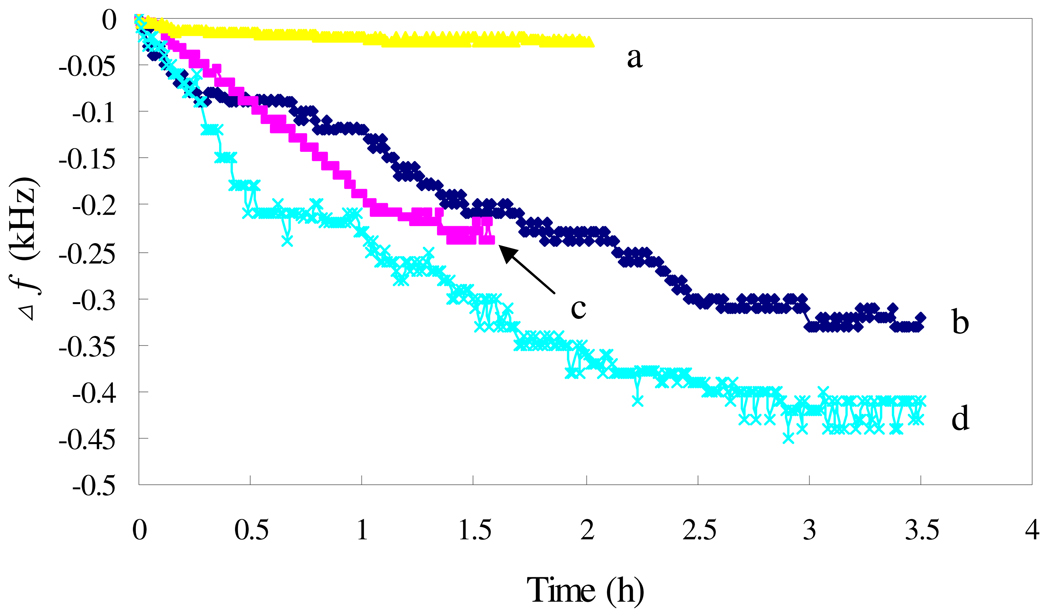
To further confirm the multivalent binding property of Con A, the mannose-modified sensor was exposed to solutions containing Con A or E. coli, with the results shown in Fig. 4. The sensor responses to either Con A (Fig. 4, curve c) or E. coli (Fig. 4, curve b), with a higher response to E. coli, indicating that either Con A or E. coli can adsorb on the mannose-modified sensor. While both Con A and E. coli are present, the sensor shows the highest response as shown in Fig. 4, curve d, confirming the multivalent binding property of Con A, which results in an enhancement of the sensor response.
Fig. 4.
Frequency change vs time with the sensors exposed to different solutions: (a) blank; (b) 9.4×10⁹ cells/mL E. coli; (c) 100 nM Con A; (d) 9.4×10⁹ cells/mL E. coli and 100 nM Con A.
Considering that the in situ growth of E. coli may increase the sensor response, the diluted culture medium NB was used as the test solution. The sensor showed a response of 360 Hz in NB solution, but 660 Hz in water. The possible reason would be that the organic macromolecules of NB partly blocked the sensor surface, resulting in a decrease in the mass loading of E. coli. In addition, the bacterium consumes nutrients resulting in a decrease in the viscosity, which in turn leads to an increase in the resonance frequency partly offsetting the frequency decrease caused by the bacterium loading.20 NB was therefore not added in the test solution.
3.2 The effect of Mn2+/Ca2+
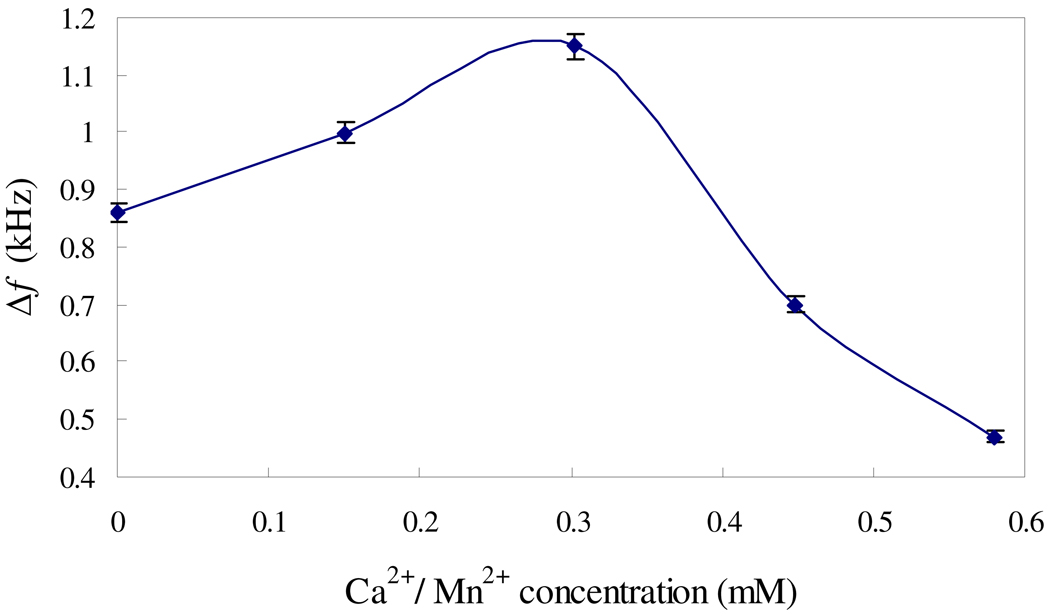
Con A has identical subunits of 237 amino acid residues (MW 26000). At neutral pH, Con A is predominantly tetrameric with optimal activity.38 Metal ions Mn2+/Ca2+ can bind to Con A; both must be present for carbohydrate binding.38 As such reactions may affect the binding of Con A to mannose and E. coli, the effect of these metal ions on the sensor performances was investigated. Fig. 5 shows the sensor responses in the presence of Mn2+/Ca2+ at different concentrations with a molar ratio of 1:1. The frequency shifts are increased by 140 Hz and 290 Hz with the addition of 0.15 mM and 0.303 mM Mn2+/Ca2+ (1:1 molar ratio), respectively. This result confirms that Mn2+/Ca2+ can promote the binding of Con A to mannose and E. coli. However, further increasing Mn2+/Ca2+ concentration to above 0.45 mM results in decreases in the frequency shifts. High Mn2+/Ca2+ concentrations are unfavorable to the sensor responses. The possible reason would be that high concentrations of Mn2+/Ca2+ could restrain the growth of bacteria and then reduce the sensitivity of the sensor.43 The optimal concentration of Mn2+/Ca2+ is around 0.3 mM.
Fig. 5.
The effect of Ca2+ and Mn2+, with 9.7×10¹⁰ cells/mL E. coli and Con A concentration of 133 nM.
3.3 Detection of E. coli
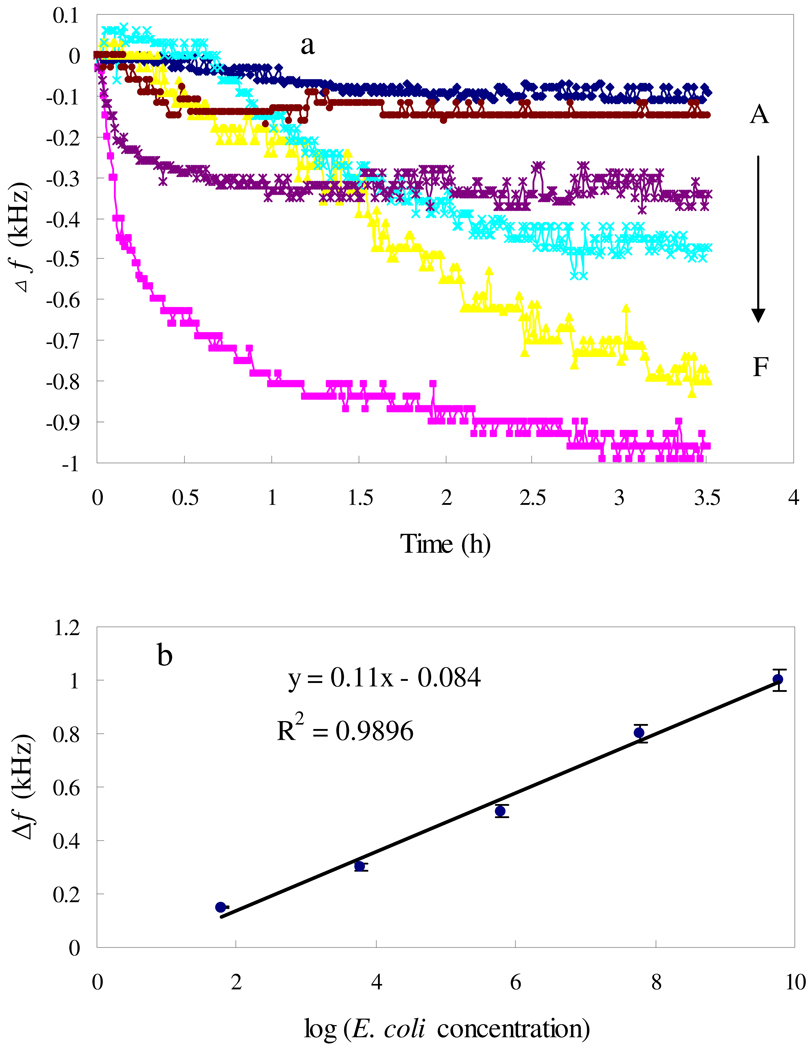
Fig. 6 shows the change in resonance frequency versus E. coli O157:H7 concentration from 6×101 to 6.1×10⁹ cells/mL. The resonance frequency decreases with the loading of Con A-bond E. coli, in most cases reaching a plateau within 2 h except in the case of 6.1×10⁷ cells/mL E. coli where 3 h is required for signal saturation. As indicated in Fig. 3, the time to reach the plateau is longer than that when only Con A or E. coli exists (40 min). It seems that the binding of Con A and E. coli onto the sensor surface proceeds in a step by step manner, with E. coli following Con A, and as a result more time is required to reach an absorption equilibrium in the presence of both Con A and E. coli. The 3 h frequency shift is therefore used to quantify E. coli, with the calibration curve shown in Fig. 6 (b); the 3 h frequency shift is linearly dependent on the logarithm of cell concentrations ranging from 6.0×101 to 6.1×10⁹ cells/mL. At 60 cells/mL E. coli the sensor response is distinguishable from the blank response, and the detection limit (LOD) of the mannose-magnetoelastic sensor is therefore defined as 60 cells/mL. As for rapid detection of E. coli, the LOD of 60 cells/mL is achieved within 3.5 h, comparing favorably with values reported in literature,13, 35, 38, 44, 45 such as the amperometric detection of E. coli based on DNA hybridization and enzyme amplification using microelectromechanical systems with a LOD of 1000 E. coli cells,13 nonlabeled quartz crystal microbalance biosensing detection using carbohydrate and lectin recognitions with a LOD of 7.5×10² cells/mL,38 nanoparticle amplification based quartz crystal microbalance DNA sensing detection with a LOD of 2.67×10² cells/mL,44 and the magnetoelastic sensing detection of E. coli based on changes in the properties of culture medium during the bacterium growth with a LOD of 200 cells/mL.35 Using polymerase chain reaction a LOD of 2–3 cells was achieved via a capillary electrophoretic (PCR-CE) technique.46 The direct detection (without incubation) can be completed within a couple of hours offering rapid detection.
Fig. 6.
The shift of fr in response to various concentrations of E. coli (a): (A) vacant sample; (B)–(F) the E. coli concentrations were 6.0×101, 6.1×10³, 6.1×10⁵, 6.1×10⁷, 6.1×10⁹ cells/mL; (b) Calibration curve: 3 h frequency shifts vs log of E. coli concentrations. 133 nM Con A and 0.303 mM Mn2+/Ca2+ were added to the detection solution.
Specificity is another key parameter, in addition to sensitivity and detection time. In biosensing analyses high specificity is generally achieved by using either antibodies or nucleic acid probes as the detection element, with a large array of antibodies required for identification of unknown agents. Taking advantage of the fact that Gram-negative bacteria such as E. coli have distinct surface LPS that can be recognized by specific lectins, Con A, the described method can be applied for the detection of Gram-negative bacteria with high specificity and sensitivity.
4. Conclusions
A novel wireless biosensor is described, constructed by coating a mass-sensitive magnetoelastic sensor with a mannose polymer upon it for the direct detection of Gram-negative bacteria, E. coli. Con A, a multivalent specific binding lectin was used to increase the binding of E. coli on the mannose-coated sensor, and a sensitive response was therefore achieved. The multivalent specific binding property of Con A promotes sensor response to any Gram-negative bacteria. As Mn2+/Ca2+ can promote the binding of Con A to mannose and E. coli, Mn2+/Ca2+ were added in the test solution to enhance the sensor response. The highest response was achieved at 0.3 mM Mn2+/Ca2+, with a LOD of 60 cells/mL with analysis time of 3 h. The proposed sensor shows a linear response in the range from 6.0×101 to 6.1×10⁹ cells/mL. However, higher concentrations than 0.3 mM of Mn2+/Ca2+ resulted in a decrease in the sensor response.
Acknowledgements
We are grateful for the financial support from the National Science Foundation of China under the grant 20775024 and 20827006, and the National Science Foundation for Distinguished Young Scholars under Grant 50725825. C.A. Grimes gratefully acknowledges partial support of this work by the National Institutes of Health under grant 1 R21 EB006397-01.
References
- 1.Bettelheim KA. In: Balows A, Truper HG, Dworkin M, Harder W, Schleifer KH, editors. Springer-Verlag; 1991. pp. 2696–2736. [Google Scholar]
- 2.Mo XT, Zhou YP, Lei H, Deng L. Enzyme Microbiol. Technol. 2002;30:583–589. [Google Scholar]
- 3.Wang RF, Cao WW, Johnson MG. Appl. Environ. Microbiol. 1992;58:2827–2831. doi: 10.1128/aem.58.9.2827-2831.1992. [DOI] [PMC free article] [PubMed] [Google Scholar]
- 4.Su XD, Low S, Kwang J, Chew VHT, Li SFY. Sens. Actuators B. 2001;75:29–35. [Google Scholar]
- 5.Uchida H, Fujitani K, Kawai Y, Kitazawa H, Horii A, Shiiba K, Saito K, Saito T. Biosci. Biotechnol. Biochem. 2004;68:1004–1010. doi: 10.1271/bbb.68.1004. [DOI] [PubMed] [Google Scholar]
- 6.Jindou S, Soda A, Karita S, Kajino T, Beguin P, Wu JH, Inagaki M, Kimura T, Sakka K, Ohmiya K. J. Biol. Chem. 2004;279:9867–9874. doi: 10.1074/jbc.M308673200. [DOI] [PubMed] [Google Scholar]
- 7.Hardegger D, Nadal D, Bossart W, Altwegg M, Dutly F. J. Microbiol. Meth. 2000;41:45–51. doi: 10.1016/s0167-7012(00)00135-4. [DOI] [PubMed] [Google Scholar]
- 8.Ahmed N, Mohanty AK, Mukhopadhyay U, Batish VK, Grover S. J. Clin. Microbiol. 1998;36:3094–3095. doi: 10.1128/jcm.36.10.3094-3095.1998. [DOI] [PMC free article] [PubMed] [Google Scholar]
- 9.Gunasekera TS, Attfield PV, Veal DA. Appl. Environ. Microbiol. 2000;66:1228–1232. doi: 10.1128/aem.66.3.1228-1232.2000. [DOI] [PMC free article] [PubMed] [Google Scholar]
- 10.Yu H, Bruno JG. Appl. Environ. Microbiol. 1996;62:587–592. doi: 10.1128/aem.62.2.587-592.1996. [DOI] [PMC free article] [PubMed] [Google Scholar]
- 11.Bukhari Z, McCuin RM, Fricker CR, Clancy JL. Appl. Environ. Microbiol. 1998;64:4495–4499. doi: 10.1128/aem.64.11.4495-4499.1998. [DOI] [PMC free article] [PubMed] [Google Scholar]
- 12.Zhao JW, Zhu WJ, He FJ. Sens. Actuators B. 2005;107:271–276. [Google Scholar]
- 13.Gau JJ, Lan EH, Dunn B, Ho CM, Woo JC. Biosens. Bioelectron. 2001;16:745–755. doi: 10.1016/s0956-5663(01)00216-0. [DOI] [PubMed] [Google Scholar]
- 14.Pepper J, Noring R, Klempner M, Cunninghama B, Petrovich A, Bousquet R, Clapp C. Sens. Actuators B. 2003;96:565–575. [Google Scholar]
- 15.Hiratsuka A, Muguruma H, Lee KH, Karube I. Biosens. Bioelectron. 2004;19:1667–1672. doi: 10.1016/j.bios.2004.01.003. [DOI] [PubMed] [Google Scholar]
- 16.Lee J, Deininger RA. Luminescence. 2004;19:209–211. doi: 10.1002/bio.775. [DOI] [PubMed] [Google Scholar]
- 17.Garcia-Armisen T, Servais P. Microbiol. Meth. 2004;58:269–279. doi: 10.1016/j.mimet.2004.04.014. [DOI] [PubMed] [Google Scholar]
- 18.Ericsson M, Hanstorp D, Hagberg P, Enger J, Nystrom T. J. Bacteriol. 2000;182:5551–5555. doi: 10.1128/jb.182.19.5551-5555.2000. [DOI] [PMC free article] [PubMed] [Google Scholar]
- 19.Simpkins SA, Chan AB, Hays J, Popping B, Cook N. Lett. Appl. Microbiol. 2000;30:75–79. doi: 10.1046/j.1472-765x.2000.00670.x. [DOI] [PubMed] [Google Scholar]
- 20.Stoyanov PG, Grimes CA. Sens. Actuators A. 2000;80:8–14. doi: 10.1016/s0924-4247(99)00288-5. [DOI] [PubMed] [Google Scholar]
- 21.Schmidt S, Grimes CA. Sens. Actuators A. 2001;94:189–196. doi: 10.1016/s0924-4247(01)00708-7. [DOI] [PubMed] [Google Scholar]
- 22.Cai QY, Grimes CA. Sens. Actuators B. 2000;71:112–117. doi: 10.1016/s0925-4005(00)00599-2. [DOI] [PubMed] [Google Scholar]
- 23.Cai QY, Zeng KF, Ruan CM, Desai TA, Grimes CA. Anal. Chem. 2004;76:4038–4043. doi: 10.1021/ac0498516. [DOI] [PubMed] [Google Scholar]
- 24.Puckett LG, Barrett G, Kouzoudis D, Grimes CA, Bachas LG. Biosens. Bioelectron. 2003;18:675–681. doi: 10.1016/s0956-5663(03)00033-2. [DOI] [PubMed] [Google Scholar]
- 25.Ruan CM, Zeng KF, Varghese OK, Grimes CA. Anal. Chem. 2003;75:6494–6498. doi: 10.1021/ac034562n. [DOI] [PubMed] [Google Scholar]
- 26.Guntupalli R, Hu J, Lakshmanan RS, Huang TS, Barbaree JM, Chin BA. Biosens. Bioelectron. 2007;22:1474–1479. doi: 10.1016/j.bios.2006.06.037. [DOI] [PubMed] [Google Scholar]
- 27.Ong KG, Zeng KF, Yang XP, Shankar K, Ruan CM, Grimes CA. IEEE Sens. J. 2006;6:514–523. [Google Scholar]
- 28.Zeng KF, Ong KG, Yang XP, Grimes CA. Sens. Lett. 2006;4:388–397. [Google Scholar]
- 29.Zeng KF, Grimes CA. Rev. Sci. Instrum. 2004;75:5257–5261. [Google Scholar]
- 30.Zeng KF, Ong KG, Yang XP, Grimes CA. Sens. Lett. 2006;4:388–397. [Google Scholar]
- 31.Zeng KF, Ong KG, Mungle C, Grimes CA. Rev. Sci. Instrum. 2002;73:4375–4380. [Google Scholar]
- 32.Grimes CA, Kouzoudis D, Dickey EC, Qian D, Anderson MA, Shahidain R, Lindsey M, Green L. J. Appl. Phys. 2000;87:5341–5343. doi: 10.1063/1.373341. [DOI] [PubMed] [Google Scholar]
- 33.Zourob M, Ong KG, Zeng KF, Mouffouk F, Grimes CA. Analyst. 2007;132:338–343. doi: 10.1039/b616035b. [DOI] [PubMed] [Google Scholar]
- 34.Pang PF, Huang Sj, Cai QY, Yao SZ, Zeng KF, Grimes CA. Biosens. Bioelectr. 2007;23:295–299. doi: 10.1016/j.bios.2007.07.004. [DOI] [PubMed] [Google Scholar]
- 35.Huang Sj, Pang Pf, Xiao Xl, He LW, Cai QY, Grimes CA. Sens. Actuators B. 2008;131:489–495. [Google Scholar]
- 36.Huang Sj, Ge ST, He LW, Cai QY, Grimes CA. Biosens. Bioelectro. 2008;23:1745–1748. doi: 10.1016/j.bios.2008.01.036. [DOI] [PubMed] [Google Scholar]
- 37.Pang PF, Cai QY, Yao SZ, Grimes CA. Talanta. 2008;76:360–364. doi: 10.1016/j.talanta.2008.03.008. [DOI] [PubMed] [Google Scholar]
- 38.Shen ZH, Huang MC, Xiao CD, Zhang Y, Zeng XQ, Wang PG. Anal. Chem. 2007;79:2312–2319. doi: 10.1021/ac061986j. [DOI] [PMC free article] [PubMed] [Google Scholar]
- 39.Yang L, Cheng L, Wei YC, Tian L. J Sichuan Un iv (Med Sc i Edi) 2003;34:730–732. [PubMed] [Google Scholar]
- 40.Otto K, Elwing H, Hermansson M. J. Bacteriol. 1999;181:5210–5218. doi: 10.1128/jb.181.17.5210-5218.1999. [DOI] [PMC free article] [PubMed] [Google Scholar]
- 41.Otto K, Hermansson M. J. Bacteriol. 2004;186:226–234. doi: 10.1128/JB.186.1.226-234.2004. [DOI] [PMC free article] [PubMed] [Google Scholar]
- 42.Hsu KL, Pilobello KT, Mahal LK. Nat. Chem. Biol. 2006;2:153–157. doi: 10.1038/nchembio767. [DOI] [PubMed] [Google Scholar]
- 43.Liu Q, Xu WC, Zhang Y. Uranium Mining Metallurgy. 2004;23:155–157. [Google Scholar]
- 44.Mao XL, Yang LJ, Su XL, Li YB. Biosens. Bioelectro. 2006;21:1178–1185. doi: 10.1016/j.bios.2005.04.021. [DOI] [PubMed] [Google Scholar]
- 45.Liu RH, Yang JN, Lenigk R, Bonanno J, Grodzinski P. Anal. Chem. 2004;76:1824–1831. doi: 10.1021/ac0353029. [DOI] [PubMed] [Google Scholar]
- 46.Lagally ET, Scherer JR, Blazej RG, Toriello NM, Diep BA, Ramchandani M, Sensabaugh GF, Riley LW, Mathies RA. Anal. Chem. 2004;76:3162–3170. doi: 10.1021/ac035310p. [DOI] [PubMed] [Google Scholar]


