

Abstract
One of the major limitations to preclinical mouse therapeutic evaluation is the inherent difficulty in imaging small tumors in vivo. We present a rapid and reliable method to detect optic glioma (OPG) in a mouse neurofibromatosis-1 model (Nf1flox/mutGFAP-Cre mice) in vivo using Manganese-Enhanced Magnetic Resonance Imaging (MEMRI). In a blinded study, twenty-three mice were chosen randomly from a cohort of Nf1flox/mutGFAP-Cre mice and two sets of age-matched controls. In all cases, OPG presence or absence was correctly identified. In addition, the OPG size and shape was accurately measured in vivo, facilitating the use of this model for preclinical drug studies.
Introduction
Neurofibromatosis type 1 (NF1) is a common autosomal dominant inherited tumor predisposition syndrome in which 15-20% of affected children manifest low-grade gliomas of the optic nerve, optic chiasm, and optic pathway (Listernick et al. 1994; Listernick et al. 1995). While many of these gliomas initially respond to chemotherapy, nearly one third of children with NF1-associated optic glioma will require additional treatment (Listernick et al. 2004; Rosser et al. 2002; Thiagalingam et al. 2004). Our ability to design and test new therapies for NF1-associated optic gliomas is heavily predicated on the availability of robust small-animal models of these tumors suitable for preclinical drug evaluation (Gutmann et al. 2006). One of the major obstacles to preclinical drug testing in current small-animal low-grade glioma models is the inability to rapidly and accurately detect these tumors in mice prior to treatment and the difficulties estimating tumor size in the intact animal.
Over the past several years, we have developed a robust mouse model of NF1-asscociated optic glioma resulting from Nf1 gene inactivation in glial cells (Nf1flox/mutGFAP-Cre mice). Nf1flox/mutGFAP-Cre mice are born healthy, but develop gliomas restricted to the prechiasmatic optic nerves and optic chiasm by 2-3 months of age (Bajenaru et al. 2005; Bajenaru et al. 2003). These optic gliomas can be visualized by small-animal magnetic resonance imaging (MRI) using a lengthy diffusion-based method that typically requires 3 hours of data acquisition (Bajenaru et al. 2003). Using this method, tumors can be reproducibly identified in mice, but size measurements are not possible. The combination of lengthy imaging times and the inability to assess tumor size are major obstacles that limit the utility of MRI in screening mice for optic glioma and measuring tumor growth for preclinical drug studies.
Contrast agents are commonly used in human MR imaging, with gadolinium-based agents used routinely for identifying and monitoring high-grade brain tumors. While optic gliomas in some mice enhance using Gd-based contrast media (Bajenaru et al. 2003), we have not found such agents valuable for the routine visualization of these tumors. Recently, divalent manganese ion (Mn2+) has been developed as a contrast agent in small-animal MRI for enhancement of selected regions of the brain (Aoki et al. 2004). In this report, we describe the use of T1-weighted imaging combined with manganese contrast enhancement (MEMRI) to accurately and reproducibly detect Nf1flox/mutGFAP-Cre mouse optic gliomas in vivo with only 10-15 minutes of imaging time. This major advance now allows these optic glioma mice to be effectively used in informative preclinical drug trials.
Materials and Methods
Transgenic Mice
Nf1flox/mutGFAP-Cre mice were generated as previously described (Zhu et al. 2002). Control animals were wild-type C57Bl/6J and Nf1flox/floxGFAP-Cre mice. A total of 23 mice were used in this study including seven controls, seven Nf1flox/floxGFAP-Cre mice, and nine Nf1flox/mutGFAP-Cre mice. All mice were 4-8 months old.
Pathology
Mice were perfused transcardially with phosphate buffered saline (PBS) followed by 4% paraformaldehyde (PFA) in 0.1 M sodium phosphate buffer (pH 7.4). Optic nerves including the optic chiasms were dissected, post-fixed in 4% PFA overnight at 4°C, and photographed with a CCD digital camera (Diagnostic Instruments) attached to an Olympus dissection microscope.
Magnetic Resonance Imaging
Images were collected in an Oxford Instruments (Oxford, U. K.) 4.7-tesla magnet (33 cm, clear bore) equipped with 15-cm inner diameter, actively shielded Oxford gradient coils (maximum gradient, 18 G/cm; rise time, 300 μs) and Techron Model 3020 gradient power supplies. The magnet/gradients are interfaced with a Varian (Palo Alto, CA) INOVA console, and data were collected using a 1.5-cm outer diameter surface coil (receive) and a 9-cm inner diameter Helmholtz coil (transmit). For contrast enhancement, the mice were injected intraperitoneally with a 35 mM solution of MnCl2 (140 mg/kg of body weight), followed by a subcutaneous injection of 0.5 ml saline to help maintain hydration. Data were collected 16-48 hours after contrast-agent injection. Additional experimental details are included in the legend to Figure 1.
Figure 1. Individual slices from T1-weighted, transaxial spin-echo MR images of the prechiasmatic region of mouse brain demonstrate the effect of Mn2+ enhancement.
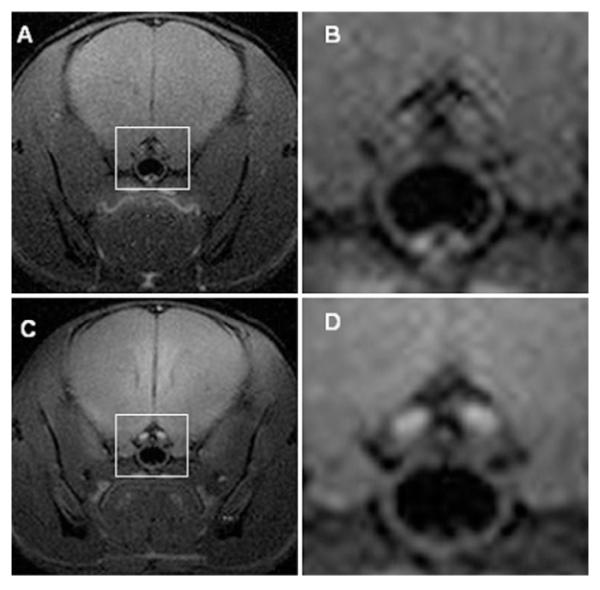
(A) Representative wild-type mouse without Mn2+ enhancement. (B) Expansion of the region marked “A” around the optic nerve (white box). (C) Same wild-type mouse with Mn2+enhancement. (D) Expansion of C around the optic nerve (white box). T1-weighted spin-echo images [repetition time (TR) = 300 ms, echo time (TE) = 14 ms, number of scans (NS) = 16] were collected in a transaxial orientation with a 1.5 × 1.5 cm2 field of view and slice thickness of 0.5 mm. Before all imaging experiments, mice were anesthetized with isoflurane/O2 [4% (v/v)], and they were maintained on isoflurane/O2 [1% (v/v)] throughout the experiments. Mouse body temperature was maintained at 37 ± 1 °C using a heating pad formed by circulating warm water.
Results
In contrast to our previous MR images, which required acquisition of 6-direction diffusion-weighted data and subsequent computation of various diffusion parametric maps (Bajenaru et al. 2003) or standard T1-weighted, spin-echo imaging without contrast (Figure 1, top panel), T1-weighted imaging following manganese administration allowed for the clear visualization of the optic nerves in the pre-chiasmatic region of a control mouse (Figure 1, bottom). These images of the optic nerves are typical of those collected for all of the control animals, with the optic nerves appearing as small, symmetric features within the chiasm.
To determine whether MEMRI could accurately detect optic glioma in Nf1flox/mutGFAP-Cre mice, we performed a blinded study in which either wild-type or Nf1flox/mutGFAP-Cre mice were imaged (n=23 mice). In all cases, the Nf1flox/mutGFAP-Cre mice were correctly identified as harboring optic glioma, which was subsequently confirmed by histopathologic analysis. Representative MEMRI images and optic nerve gross pathology are shown in Figure 2 for one wild-type mouse (panels A — C), and two different Nf1flox/mutGFAP-Cre mice with optic glioma (panels D — F and G — I). Compared with the wild-type mice (panel C), the optic nerves of the Nf1flox/mutGFAP-Cre mice (panels F and I) are swollen and misshapen with loss of the normal space between the prechiasmatic optic nerves (arrows), corresponding to the optic glioma. In contrast, tumors were never detected in Nf1flox/floxGFAP-Cre mice, which develop optic nerve hyperproliferation, but no optic gliomas, although the caliber of the nerve is mildly thickened, as previously reported (Bajenaru et al. 2003).
Figure 2. MEMRI accurately detects optic glioma in Nf1flox/mutGFAP-Cre mice.

MR images and optic nerve gross pathology are shown from one representative wild-type mouse (panels A-C), and two representative Nf1flox/mutGFAP-Cre mice with optic glioma (panels D-F and G-I). The top panels show slices from T1-weighted, spin-echo MR images of the chiasmic region; the middle panels show expansions around the optic nerve region (white box); the bottom panels show corresponding the optic nerves. MEMRI was able to detect the asymmetric appearance of the optic glioma in one Nf1flox/mutGFAP-Cre mouse (panels D-F) compared to the more symmetric-appearing optic glioma in another Nf1flox/mutGFAP-Cre mouse (panels G-I).
To characterize optic glioma in a quantitative fashion, we calculated the cross-sectional area of the optic nerve in the slice from the MR image containing the chiasmic region for each mouse. A graph showing the cross-sectional areas of C57Bl/6J (n=7), Nf1flox/floxGFAP-Cre (n=7), and Nf1flox/mutGFAP-Cre (n=9) mice is presented in Figure 3. Consistent with the images of Figure 2, the cross-sectional areas of the optic nerves in the controls and the Nf1flox/floxGFAP-Cre mice were smaller than those in the mice with optic glioma. The mean optic nerve cross-sectional area was 0.32 mm2 (SD 0.05 mm2) in wild-type mice, 0.36 mm2 (SD 0.03 mm2) in Nf1flox/floxGFAP-Cre, and 0.49 mm2 (SD 0.0009 mm2) in Nf1flox/mutGFAP-Cre mice. The differences in cross-sectional area between Nf1flox/mutGFAP-Cre mice and either the Nf1flox/floxGFAP-Cre or control mice are statistically significant, as determined by the Mann-Whitney Rank Sum Test, (p = 0.002 vs. controls; p = 0.006 vs. Nf1flox/floxGFAP-Cre mice). The difference between control and Nf1flox/floxGFAP-Cre mice is not statistically significant (p = 0.119).
Figure 3. Cross-sectional areas of prechiasmatic region optic nerve are larger in Nf1flox/mutGFAP-Cre mice than in Nf1flox/floxGFAP-Cre or control mice.

Average optic nerve cross-sectional areas in Nf1flox/mutGFAP-Cre mice (0.49 mm2; SD 0.09 mm2) are larger than those in Nf1flox/floxGFAP-Cre (0.36 mm2; SD 0.03 mm2) or C57Bl/6J mice (0.32 mm2; SD 0.05 mm2). The differences between the optic nerve areas in the Nf1flox/mutGFAP-Cre mice and the two other groups are both statistically significant; the difference between the Nf1flox/floxGFAP-Cre and C57Bl/6J mice is not statistically significant, as determined by the Mann-Whitney Rank Sum Test.
Discussion
In vivo detection and quantitative measurement of tumor size are critical components in the design of successful preclinical small-animal drug studies. Studies of optic glioma pose unique challenges due to the size and location of the tumors. In this study, we have shown that T1-weighted spin-echo MRI, combined with manganese contrast enhancement, is an effective and sensitive technique for the visualization of optic glioma in mice. Unlike Gd-based agents, uptake of Mn2+, a Ca-ion analogue, does not depend upon breakdown of the blood-brain barrier, but instead is thought to occur via axonal transport (Pautler 2004). Manganese enhancement has been used in mice to map neuronal connections (Pautler et al. 2003), monitor auditory response (Yu et al. 2005) and follow odor-induced activity in the olfactory bulb (Pautler et al. 2002). MEMRI has also aided to visualize high grade gliomas in mouse models (Wei et al. 2006). The relatively short imaging time in these experiments provides the necessary throughput of mice for preclinical studies. Mice with optic glioma are quickly and readily distinguished from normal animals based on the size and shape of the optic nerves in the chiasmatic region. In this study, the cross-sectional area of the optic nerves of mice with optic glioma is, on average, ∼50% greater than in control animals. These results provide a solid foundation for preclinical studies to monitor the therapeutic response of mice with optic glioma to a variety of chemotherapeutic treatments.
Acknowledgments
This work was supported by an NIH/NCI Small Animal Imaging Resource Program (SAIRP) grant (R24 CA83060); Department of Defense grant W81XWH061022; NIH grant NS054629-01; and the Alvin J. Siteman Cancer Center at Washington University in St. Louis, an NCI Comprehensive Cancer Center (P30 CA91842).
Footnotes
Publisher's Disclaimer: This is a PDF file of an unedited manuscript that has been accepted for publication. As a service to our customers we are providing this early version of the manuscript. The manuscript will undergo copyediting, typesetting, and review of the resulting proof before it is published in its final citable form. Please note that during the production process errors may be discovered which could affect the content, and all legal disclaimers that apply to the journal pertain.
References
- Aoki I, Wu YJL, Silva AC, Lynch RM, Koretsky AP. In vivo detection of neuroarchitecture in the rodent brain using manganese-enhanced MRI. NeuroImage. 2004;22:1046–1059. doi: 10.1016/j.neuroimage.2004.03.031. [DOI] [PubMed] [Google Scholar]
- Bajenaru ML, Garbow JR, Perry A, Hernandez MR, Gutmann DH. Natural History of Neurofibromatosis1-Associated Optic Nerve Glioma in Mice. Ann. Neurol. 2005;57(1):119–127. doi: 10.1002/ana.20337. [DOI] [PubMed] [Google Scholar]
- Bajenaru ML, Hernandez MR, Perry A, Y Z, Parada LF, Garbow JR, Gutmann DH. Optic Nerve Glioma in Mice Requires Astrocyte Nf1 Gene Inactivation and Nf1 Brain Heterozygosity. Cancer Res. 2003;63:8573–8577. [PubMed] [Google Scholar]
- Gutmann DH, Hunter-Schaedle K, Shannon KM. Harnessing preclinical mouse models to inform human clinical cancer trials. J. Clin. Invest. 2006;116(4):847–852. doi: 10.1172/JCI28271. [DOI] [PMC free article] [PubMed] [Google Scholar]
- Listernick R, Charrow J, Greenwald M, Mets M. Natural history of optic pathway tumors in children with neurofibromatosis type 1: a longitudinal study. J. Pediatr. 1994;125:63–66. doi: 10.1016/s0022-3476(94)70122-9. [DOI] [PubMed] [Google Scholar]
- Listernick R, Darling C, Greenwood M, Strauss L, Charrow J. Optic pathway tumors in children: the effect of neurofibromatosis type 1 on clinical manifestations and natural history. J. Pediatr. 1995;127:718–722. doi: 10.1016/s0022-3476(95)70159-1. [DOI] [PubMed] [Google Scholar]
- Listernick R, Ferner RE, Piersall L, Sharif S, Gutmann DH, Charrow J. Late-onset optic pathway tumors in children with neurofibromatosis1. Neurology. 2004;63:1944–1946. doi: 10.1212/01.wnl.0000144341.16830.01. [DOI] [PubMed] [Google Scholar]
- Pautler RG. In vivo, trans-synaptic tract-tracing utilizing manganese-enhanced magnetic resonance imaging (MEMRI) NMR BioMed. 2004;17:595–601. doi: 10.1002/nbm.942. [DOI] [PubMed] [Google Scholar]
- Pautler RG, Koretsky AP. Tracing Odor-Induced Activation in the Olfactory Bulbs of Mice Using Manganese-Enhanced Magnetic Resonance Imaging. NeuroImage. 2002;16:441–448. doi: 10.1006/nimg.2002.1075. [DOI] [PubMed] [Google Scholar]
- Pautler RG, Mongeau R, Jacobs R. In Vivo Trans-Synaptic Tract Tracing From the Murine Striatum and Amygdala Utilizing Manganese Enhance MRI (MEMRI) Magn. Reson. Med. 2003;50:33–39. doi: 10.1002/mrm.10498. [DOI] [PubMed] [Google Scholar]
- Rosser T, Packer RJ. Intracranial neoplasms in children with neurofibromatosis1. J. Child Neurol. 2002;17:646–651. doi: 10.1177/088307380201700815. [DOI] [PubMed] [Google Scholar]
- Thiagalingam S, Flaherty M, Billson F, North K. Neurofibromatosis type 1 and optic pathway gliomas: follow-up of 54 patients. Opthalmology. 2004;111:568–577. doi: 10.1016/j.ophtha.2003.06.008. [DOI] [PubMed] [Google Scholar]
- Wei Q, Clarke L, Scheidenhelm DK, Qian B, Tong A, Sabha N, Karim Z, Bock NA, Reti R, Swoboda R. High-Grade Glioma Formation Results from Postnatal Pten Loss or Mutant Epidermal Growth Factor Receptor Expression in a Transgenic Mouse Glioma Model. Cancer Res. 2006;66(15):7429–7437. doi: 10.1158/0008-5472.CAN-06-0712. others. [DOI] [PubMed] [Google Scholar]
- Yu X, Wadghiri YZ, Sanes DH, Turnbull DH. In vivo auditory brain mapping in mice with Mn-enhanced MRI. Nat. Neurosci. 2005;8(7):961–968. doi: 10.1038/nn1477. [DOI] [PMC free article] [PubMed] [Google Scholar]
- Zhu Y, Ghosh P, Charnay P, Barns DK, Parada LF. Neurofibromas in NF1: Schwann cell origin and role of tumor environment. Science. 2002;296:920–922. doi: 10.1126/science.1068452. [DOI] [PMC free article] [PubMed] [Google Scholar]