

Abstract
Background
Delayed enhanced magnetic resonance imaging (DE-MRI) can be used for the exact assessment of myocardial infarct scar. Electroanatomic (EA) mapping can identify the subendocardial extension of infarcts and is used to identify and eliminate areas critical for post-infarction ventricular arrhythmias. The purpose of this study was to correlate DE-MRI with EA mapping in post-infarction patients with ventricular arrhythmias to assess myocardial infarct architecture and its relationship to post-infarction ventricular arrhythmias.
Methods and Results
EA mapping during sinus rhythm was performed in 14 post-infarction patients (10 men; age: 64±10 years; ejection fraction: 0.33±0.12) referred for ablation of ventricular arrhythmias. All patients underwent prior DE-MRI. Both DE-MRI and EA mapping data were registered in 3D space. Presence of scar, and its transmurality as well as scar core vs. grey zone were assessed on DE-MRI and correlated with EA maps; furthermore electrogram characteristics of the EA map were correlated with the DE-MRI. Scar areas as assessed by bipolar and unipolar voltages in the EA map both correlated well with the scar as defined by DE-MRI. The best cut-off value to differentiate subendocardial scar from normal myocardium was 1.0 mV for bipolar voltage and 5.8 mV for unipolar voltage. Areas with delayed enhancement (DE) had distinct electrophysiologic characteristics compared to non-enhancing sites. All identified sites that were critical for post-infarction ventricular tachycardia (31/31) and premature ventricular complexes (5/5) were located within areas of DE, with most (71%) being located in the core area of the scar.
Conclusions
DE-MRI can accurately predict the electroanatomic characteristics of corresponding subendocardial locations. Critical sites of post-infarction arrhythmias were confined to areas of DE. The scar information on MRI can be selectively imported into an EA mapping system to facilitate the mapping and ablation procedure.
Keywords: Post-infarction Ventricular tachycardia, mapping, radiofrequency catheter ablation, magnetic resonance imaging
Delayed enhanced magnetic resonance imaging (DE-MRI) has been used to identify extent and volume as well as characteristics of infarct scars in patients with prior myocardial infarction. (1-3) (4)
By means of voltage acquisition, electroanatomic (EA) mapping has also been used to identify the endocardial extent of infarct scarring. (5,6) Furthermore, electrogram characteristics help to assess histologic properties of scar tissue. (7) This information has been used effectively to localize and eliminate the arrhythmogenic substrate in patients with post-infarction ventricular arrhythmias.(8)
A prior report compared both imaging modalities and found a good correlation in the extent of scar by DE-MRI and EA mapping. (9) However, a recent report (10) found a mismatch between the two modalities. The purpose of our study was to gain more detailed insight into infarct architecture as assessed by DE-MRI and EA mapping, and its relationship to post-infarction ventricular arrhythmias.
Methods
Patient Characteristics (table 1)
Table 1.
Patient Characteristics:
| Patient number | 14 |
| Age | 64±10 |
| Gender (m/f) | 10/4 |
| Ejection fraction | 0.33±0.12 |
| Myocardial infarction: | |
| - inferior | 9 |
| - anterior | 4 |
| -both | 1 |
| VT / PVCs | 9/5 |
Fourteen consecutive patients were included in this study. The study was approved by the Institutional Review Committees of both institutions.
Magnetic Resonance Imaging
All patients had MRI studies within two weeks prior to the ablation procedure. The studies were performed on a 1.5 Tesla magnetic resonance imaging scanner (Signa Excite CV/i, General Electric, Milwaukee, Wis.) with a 4- or 8-element phased array coil placed over the chest of patients in supine position. Images were acquired with ECG gating during breath-holds. Dynamic short and long axis images of the heart were acquired using a segmented k-space steady-state free precession pulse sequence (repetition time 4.2ms, echo time 1.8ms, 1.4×1.4mm in-plane spatial resolution, 8mm slice thickness). After a 15 minutes delay following administration of 0.20mmol/kg of intravenous gadolinium DTPA (Magnevist, Berlex Pharmaceuticals, Wayne, NJ), 2-D delayed enhancement imaging was performed using an inversion-recovery sequence (11) (repetition time 6.7ms, echo time 3.2ms, in-plane spatial resolution 1.4×2.2mm, slice thickness 8mm) in the short axis (figure 1) and long axis of the left ventricle at matching cine-image slice locations. The inversion time (250ms-350ms) was optimized to null the normal myocardium.
Figure 1.

Stack of short-axis MRI of the heart illustrating delayed enhancement at the inferoseptal wall; the endocardial areas with delayed enhancement are delineated by the thick white line.
Electrophysiologic Study
After informed consent was obtained, a 6 French electrode catheter was introduced into the right femoral vein and positioned in the right ventricular apex. Programmed right ventricular stimulation was performed using 1-4 extrastimuli. (12) All induced VTs were targeted for radiofrequency ablation. Left ventricular mapping was performed using a retrograde aortic approach. A 3 dimensional mapping system (CARTO, Biosense Webster, Inc. v8.0) with a 4-mm or 3.5 tip electrode and a 2-mm ring electrode separated by 1 mm (Navistar or Thermocool, Biosense Webster) was used in all patients. Systemic heparinization was maintained throughout the procedure with a target activated clotting time of ≥300sec.
A left ventricular voltage map was performed during sinus rhythm (figure 2 left). Electrograms were filtered at 30-400 Hz (bipolar) and 1-240 Hz (unipolar). Bipolar electrograms recorded by the distal electrode pair of the mapping catheter were categorized as normal, fractionated, isolated potentials, or abnormal according to previously reported criteria (13) which were adapted to the mapping and recording system used in this study (14):
Figure 2.
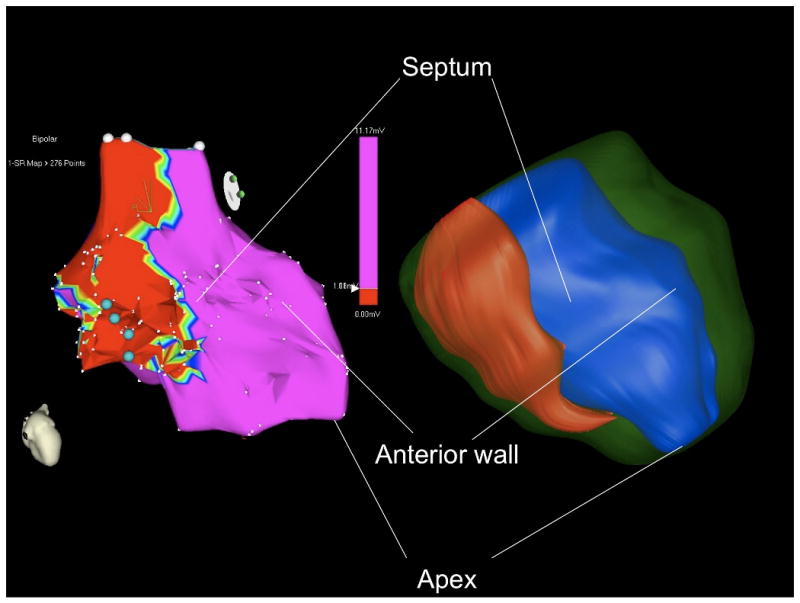
Left: Illustration of a bipolar voltage map using a cut off value of •1.0mV in a patient with prior inferoseptal myocardial infarction (from figure 1). Blue dots indicate critical sites for the targeted VT.
Right: Corresponding three-dimensional surface reconstruction of scar (red), endocardium (blue) and epicardium (green) of the left ventricle based on the MRI contours from figure 1.
normal electrograms: sharp biphasic or triphasic spikes with amplitudes •3mV and duration <70ms, and/or amplitude : duration ratio >0.046
fractionated electrograms: amplitude •0.5mV, duration •133 ms, and/or amplitude : duration ratio <0.005
Isolated potential: a potential separated from the ventricular electrogram by an isoelectric segment, and/or a segment with low amplitude noise (<0.05mV) of >20 ms duration at a gain of 40-80 mm/mV.
The remaining electrograms were defined as abnormal
A fill threshold of 15 mm was used during the mapping procedure. Endocardial sites were classified post hoc by reviewing and measuring electrogram characteristics at each recording site. Areas of low voltage were measured using different bipolar and unipolar values to determine the correlation with MRI derived scar assessment. For measurement of the size of a particular area, only points less than the target voltage were included in the measurement.
Pace-mapping was performed at sites with low voltage (<1.5mV). A VT isthmus was defined in tolerated VTs as a site where: 1) concealed entrainment was present and radiofrequency ablation resulted in VT termination that was subsequently non-inducible; or 2) mechanical termination of VT during catheter manipulation and failure to induce a VT that was reproducibly inducible prior to the ablation catheter being located at a particular site. For non-tolerated VTs, a VT isthmus was defined as a site where there was a match of the QRS morphology of the targeted VT with the pace-map. Although this definition provides no direct proof that a particular site was critical to the VT, prior data confirmed that these findings are present at critical isthmus sites and result in elimination of VT by ablation. (8)
Radiofrequency energy delivery was performed if a VT isthmus was identified. If radiofrequency ablation resulted in non-inducibility of the targeted VT, this was considered to be confirmation that the site was actually within a critical VT isthmus.
Applications of radiofrequency energy were titrated to maintain a target temperature of 60°C. With non-tolerated VT, ablation was performed during sinus rhythm. If an irrigated tip catheter was used, a 10-Ohm impedance drop was targeted.
After ablation, programmed ventricular stimulation was repeated at 2 right ventricular sites. (12)
For frequent post-infarction PVCs, the site of origin was determined by activation mapping. Radiofrequency energy was delivered at the earliest site of endocardial activation.
Post-Processing
All DE-MRI images were analyzed off-line using post-processing software by two independent, experienced cardiac MRI readers blinded to the clinical data and the EA mapping data. Differences were resolved by consensus.
On each of the short axis DE-MRI images, the following contours were manually traced (Cinetool, General Electrics, Milwaukee): endocardial and epicardial contours of the left ventricle and a rough estimate of the areas of abnormal signal corresponding to the scars. The maximum intensity M in the latter regions was computed. The refined contours of the areas of delayed enhancement were then automatically determined by a region growing algorithm as the area encompassing pixels with values ≥ M/2, using the traditional method of Full Width Half Maximum (15). The degree of transmurality of infarct was computed from the tracings, and expressed in term of % of myocardial thickness in a small neighborhood (10 degrees arc of circle). In addition, for further analysis of the subset of the critical points on the EA map, we also used a standard deviation technique to distinguish the core infarct and peri-infarct regions (>3 SDs and 2 to 3 SDs above remote normal myocardium, respectively) as described by Yan (4,15) on the corresponding subset of images.
All contours were processed by the VTK software toolkit (Kitware, New York, NY) to generate endocardial, epicardial and scar 3-D surfaces (Figure 2, right). The same contours were also processed using Matlab (Mathworks, Natick, MA), to generate 2D polar maps representing the circumferential extend of infarct from base to apex of the left ventricle (figure 3a).
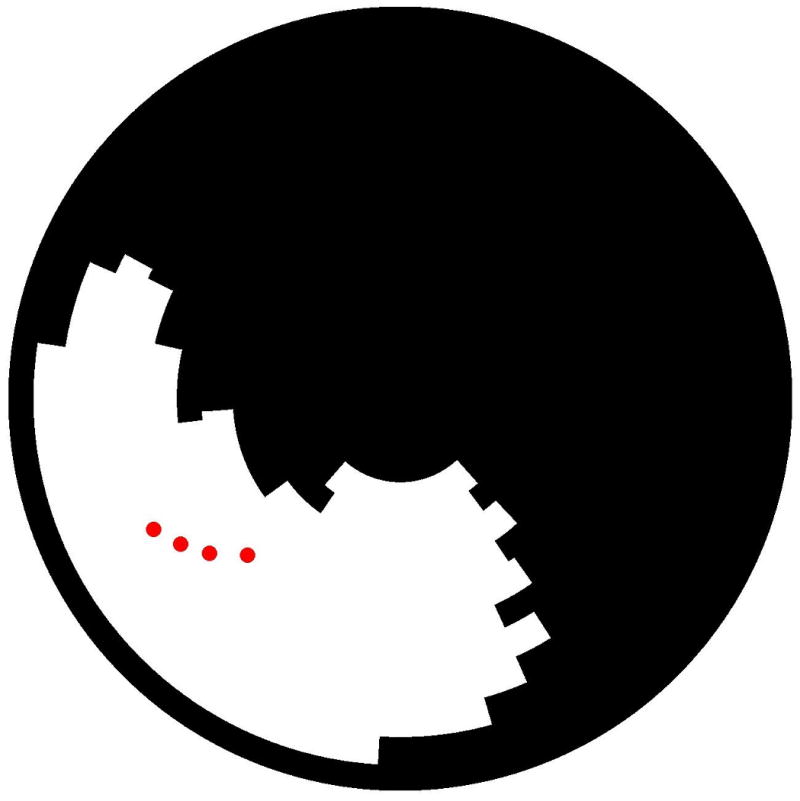
Figure 3.
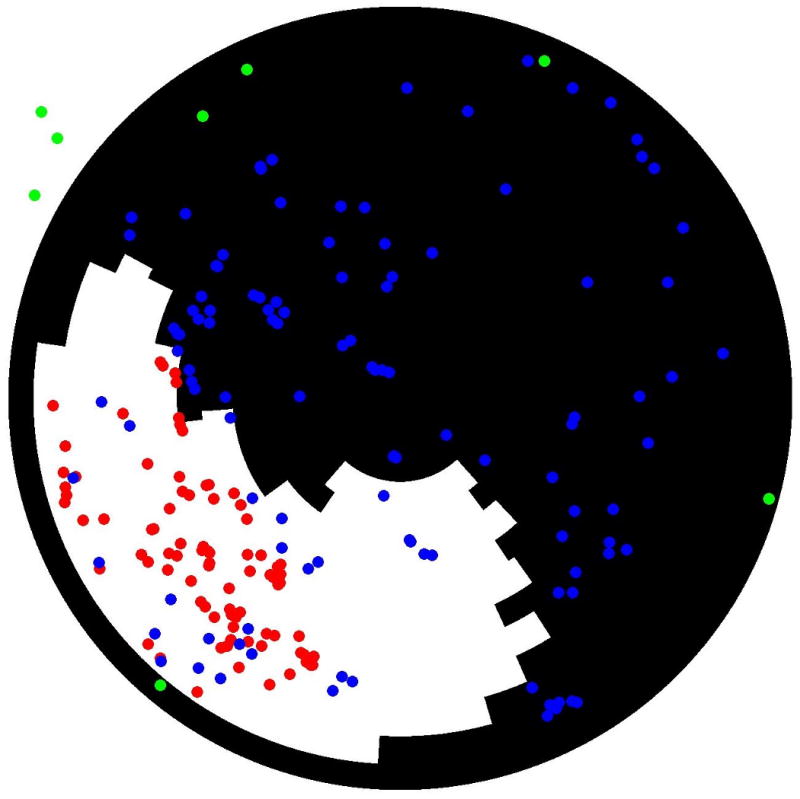
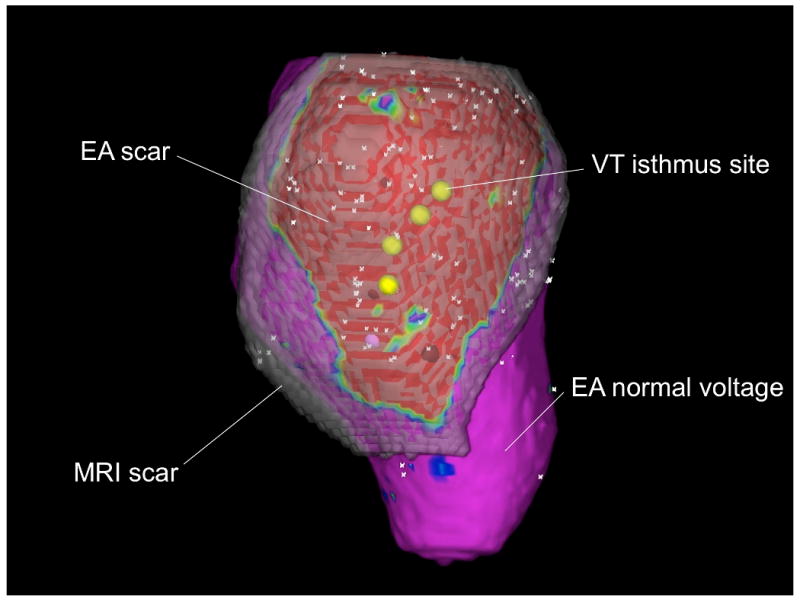
(A) Two-dimensional polar map registration of scar (areas with delayed enhancement in white and normal areas in black) and points obtained from the bipolar electroanatomical map (red tags: sites with voltage •1.0mV; blue tags: areas with voltage >1.0mV; green tags: aortic points and mitral annular points). (B) Three-dimensional registration of scar from figure 1 and 2 into the voltage map from figure 2 (left). The EA map is projected on the MRI endocardial surface. The 3-D MRI scar is in semi-opaque gray. Both the extent and the variation in thickness of the scar on MRI can be appreciated. VT isthmus points are in yellow. Low voltage on the EA map (EA scar) is in red, normal EA voltage is in purple.
3-D registration
Using • 3 fixed reference points (aorta, left ventricular apex and mitral annulus) 3-D registration of DE-MRI data and EA mapping data was performed. The reference points were determined during the EA mapping procedure under fluoroscopic guidance. The VTK generated MRI 3-D surfaces were then transformed into standard DICOM volumetric data, and imported into CARTO MERGE where 3-D MRI surfaces were recreated by segmentation. Initial 3-D registration of the MRI surface and the EA maps was accomplished by matching the reference points from both imaging modalities. Then registration was refined using the CARTO MERGE surface registration function. No subjective visual alignment was performed. Accuracy of the registration was determined by CARTO MERGE using all data points. The EA map was then fused to the 3-D MRI endocardial surface for display purposes (figure 3b). The information gained from the CARTO MERGE registration was also used to combine the EA mapping data to the MRI polar maps. Computation of the false positive match (MRI negative, EA map positive), and of the false negative match of scar area (MRI positive, EA map negative) was performed on the polar maps.
Statistical Analysis
Continuous variables were expressed as the mean ±1 standard deviation and were compared using Student's t-test. Discrete variable were compared using the Fisher exact test or by Chi-square analysis, as appropriate. A two-group t-test was used to compare between pairs of groups with different electrogram characteristics (table 4). Bonferroni adjustments to p values were performed for multiple between-pair comparisons. Cut-off values for normal and subendocardial scar and transmural scar were determined by receiver-operating characteristic (ROC) curves. The area under the ROC curves were compared using a method described by DeLong et al. (16). A p value <0.05 was considered statistically significant.
Table 4.
Comparison of Electrogram Characteristics and DE-MRI
| Normal EGM | Abnormal EGM | Fractionated EGM | EGM with IP | |
|---|---|---|---|---|
| Bipolar amplitude (mV) | 5.33±2.71 | 1.39±0.77 | 0.32±0.16 | 0.16±0.22 |
| Unipolar amplitude (mV) | 11.10±3.85 | 6.55±3.31 | 3.45±1.95 | 1.13±1.55 |
| Transmurality (%) | 0.05±0.18 | 0.32±0.39 | 0.68±0.32 | 0.77±0.29 |
| Width (ms) | 64.2±19.7 | 87.0±22.6 | 119.2±36.0 | 255.2±134.3 |
Abbreviations: as above. In each line, values were compared two by two. The p values are all <0.0001, except for transmurality: IP vs. fractionated (p = 0.002).
Results
Patient Characteristics
The patient characteristics are described in table 1. The subjects of this study were 14 consecutive post-infarction patients referred for radiofrequency ablation of recurrent VT (n=9), or symptomatic frequent premature ventricular complexes (PVCs) (n=5) that were refractory to medical treatment. None of the patients had a cardioverter defibrillator at the time of hospital admission. One patient was being treated with amiodarone and the other patients were not taking antiarrhythmic drugs other than a beta-blocker or calcium channel blocker therapy; these medications with the exception of amiodarone were discontinued 5 half lives before the procedure.
All patients first underwent a DE-MRI study followed by an electrophysiology study with an EA mapping and ablation procedure. A mean of 149±71 endocardial mapping points were acquired during sinus rhythm.
Scar Size
Infarct scar sizes as determined by DE-MRI were compared with infarct scar sizes as determined by the CARTO software using arbitrary thresholds of bipolar and unipolar voltage amplitudes in the EA mapping (Table 2). For bipolar voltage, the arbitrary threshold for scar of 1.3 mV correlated best with scar sizes on the DE-MRI data (43±30 vs. 45±25 cm2, 13% false positive, 5% false negative, for a total error of 18%). For unipolar voltage, the threshold of 5.5 mV correlated best with scar sizes on the DE-MRI data (43±42 vs. 45±25 cm2, 9% false positive, 7% false negative, for a total error of 16%).
Table 2.
Correlation of Infarct Size as assessed by DE-MRI compared to Infarct Size by Voltage Mapping, using different cutoff values.
| Voltage Map cut-offs | Area (cm2) | p-value (t test) | False pos | False neg | Error | |
|---|---|---|---|---|---|---|
| DE-MRI | 45±25 | |||||
| Bipolar | •1.5 mV | 49±33 | 0.72 | 26% | 3% | 29% |
| •1.4 mV | 47±32 | 0.86 | 19% | 3% | 22% | |
| •1.3 mV | 43±30 | 0.85 | 13% | 5% | 18% | |
| •1.2 mV | 41±30 | 0.70 | 12% | 10% | 22% | |
| •1.1 mV | 39±29 | 0.56 | 10% | 15% | 25% | |
| •1.0 mV | 36±27 | 0.37 | 8% | 25% | 33% | |
| •0.5 mV | 16±21 | 0.003 | 3% | 70% | 73% | |
| Unipolar | •7.9mV | 65±42 | 0.14 | 57% | 2% | 59% |
| •6.5mV | 53±46 | 0.57 | 29% | 4% | 33% | |
| •5.5 mV | 43±42 | 0.88 | 9% | 7% | 16% | |
| •4.5 mV | 35±39 | 0.43 | 6% | 29% | 35% | |
Registration accuracy, as assessed by CARTO Merge with a surface-based computation using all the points, was 4.3±3.2 mm.
Electrogram Characteristics and Scar
Sites with low bipolar and/or unipolar voltage correlated with the presence of DE on MR imaging. Based on ROC curves, the optimal voltage threshold between normal myocardium and scar was 1.0 mV bipolar (sensitivity 79%, specificity 84%) and 5.8 mV unipolar (sensitivity 84%, specificity 81%). The area under the ROC curve was similar for unipolar voltage and bipolar voltage (0.89 vs. 0.88, Figure 4)
Figure 4.
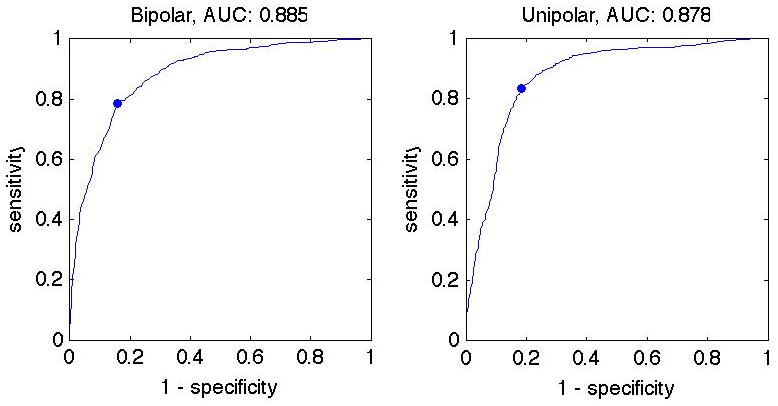
ROC curves for bipolar (left) and unipolar (right) voltages are similar (0.89 vs 0.88). The optimal voltage threshold between normal myocardium and scar was 1.0 mV bipolar (sens. 79%, spec. 84%) and 5.8 mV unipolar (sens. 84%, spec. 81%).
Electrogram characteristics correlated with the presence of delayed enhancement (DE) on DE-MRI (Table 3). Whereas sites with normal electrograms rarely corresponded to areas with DE (7%), sites with abnormal, fragmented electrograms and especially sites with isolated potentials correlated with progressively higher frequencies with DE (44%, 89% and 95% respectively). The different types of electrograms had statistically significant differences in bipolar voltage amplitude, unipolar voltage amplitude and electrogram width (Table 4).
Table 3.
Comparison of sites with and without delayed enhancement
| DE | No DE | |
|---|---|---|
| Number of sites (n) | 855 | 905 |
| Normal EGM | 25/366 (7%) | 341/366 (93%) |
| Abnormal EGM | 408/926 (44%) | 518/926 (56%) |
| Fractionated EGM | 319/360 (89%) | 41/360 (11%) |
| EGM with IPs | 103/108 (95%) | 5/108 (5%) |
| Critical VT sites | 31/31 | 0/31 |
| Bipolar voltage (mV) | 0.74±0.84 | 3.05±2.58 |
| Unipolar voltage (mV) | 3.84±2.51 | 9.16±3.80 |
| Electrogram width (msec) | 119±69 | 80±31 |
Abbreviations: EGM= electrogram; IP= isolated potentials. The p values are all <0.0001.
Electrogram Characteristics and Scar Depth
With respect to infarct scar depth, there was a significant correlation between unipolar voltage and scar depth (R=-0.61, p<0.0001) as defined by DE-MRI. Bipolar voltage showed a weaker correlation with infarct depth (R=-0.47, p<0.0001). Subendocardial infarcts (<50% thickness) did not have statistically different bipolar voltage compared to transmural infarcts (0.89±0.91 mV and 0.73±0.84 mV, p=0.08). However with unipolar voltage mapping, subendocardial infarcts displayed a significantly higher voltage than transmural infarcts (4.55±2.75 mV and 3.77±2.38 mV, p=0.004).
Infarct depth correlated well with various electrogram characteristics (Table 4). Sites displaying isolated potentials were located in areas where the infarct had the highest degree of transmurality on DE-MRI.
Critical Sites for Ventricular Arrhythmias
During the mapping procedure, criteria for a VT isthmus were identified at 31/1770 distinct sites for 21/31 inducible VTs. Isthmus criteria for VT were identified with pace-mapping (n=17), concealed entrainment and VT termination during radiofrequency delivery (n=2), or mechanical termination of VT (n=2). In the 2 patients in whom VT could not be induced due to mechanical termination, pace-mapping showed a 12/12 pace-map with respect to the targeted VT. All VT isthmus sites were located within areas of DE (Figure 5).
Figure 5.
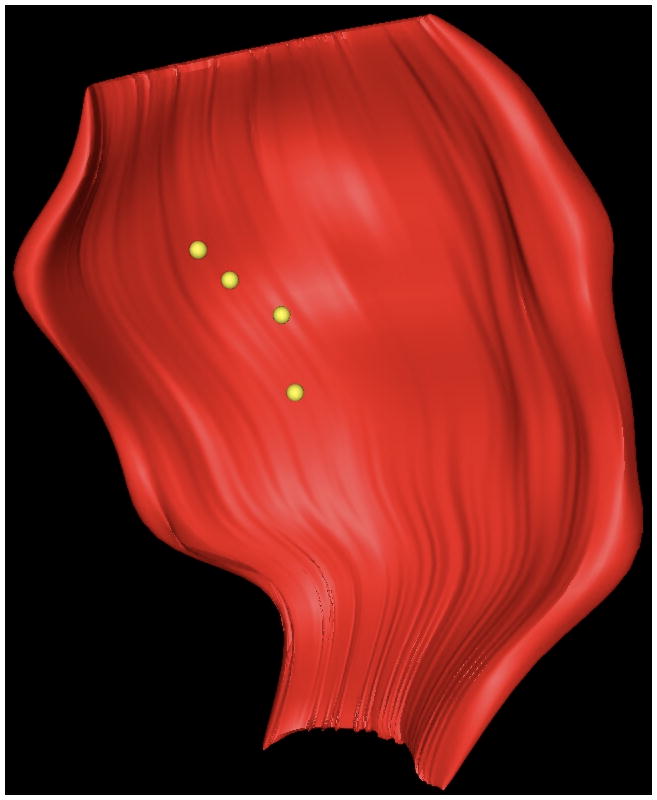
(A) Display of sites meeting VT isthmus criteria (red tags) for VT within the polar map illustrated in figures 1-3. (B) Three-dimensional illustration of the position of the VT isthmus points (in yellow) with respect to the scar (red).
With respect to electrogram characteristics, of the 31 VT isthmus sites, 7 displayed abnormal electrograms, 10 had fractionated electrograms, and 14 had isolated potentials. The mean bipolar voltage of the isthmus sites was 0.6±0.9 mV, and the mean unipolar voltage was 2.0±2.1 mV. The degree of transmurality of isthmus points was 60±38%, similar to that of points with fractionated electrograms and electrograms with isolated potentials. Based on DE-MRI, most of the VT isthmus sites (22/31 sites, 71%) were located within the infarct core. The minority (9/31, 29%) were in the grey peripheral zone. All of the critical sites in the gray peripheral zone were in an area of transmural infarct, with an MRI signal in its endocardial location slightly lower than the three-standard-deviation- cut off defining the core infarct zone.
All sites of origin of the PVCs were confined to areas with delayed enhancement. The mean bipolar and unipolar voltages at the site of origin of the PVCs were 0.4±0.28 mV and 3.5±0.7 mV, respectively. One of 5 sites of origin displayed an isolated potential and the others had fractionated electrograms.
Ablation therapy and follow-up
All patients with VT underwent ICD implantation after the ablation procedure and 1/5 patients with frequent PVCs underwent ICD implantation for primary prevention of sudden cardiac death. A total of 32 VTs (mean cycle length 310±70ms) were inducible in the 9 patients with inducible VT. Twenty-six VTs had a right bundle branch morphology and 6 had a left bundle branch block morphology. After the ablation procedure, 1 VT was still inducible in patient # 2 and the remaining VTs were no longer inducible. None of the clinical VTs were inducible post-ablation. None of the patients were on antiarrhythmic medications after the ablation procedure. One patient was started on amiodarone for inappropriate ICD discharges secondary to atrial fibrillation 6 months post-ablation, and another patient was started on sotalol for recurrent ICD discharges 1.5 years post-ablation.
Two patients had a single appropriate ICD discharge 1-1.5 years post-ablation for VT during a mean follow-up period of 33±8 months. In the 5 patients with frequent PVCs, the predominant PVCs were successfully ablated. The mean PVC burden was reduced from 22.8±10% to 1.0±1.4%% (p=0.01) based on 24 hour Holter monitoring. None of these patients had recurrent palpitations.
Discussion
Main findings
The unique aspect of this study is the demonstration that sites critical to reentrant ventricular arrhythmias in humans are located within areas of delayed enhancement by MRI. Scar can be selectively extracted from DE-MRIs and registered into the EA mapping system using customized software. Areas enhancing with DE-MRI have distinct electrophysiologic characteristics as compared to non-enhancing sites.
Scar Extraction and Registration
This study demonstrated a high degree of correlation between endocardial electroanatomical voltage mapping and scar as characterized by DE-MRI. The concept of selective scar identification, characterization, and extraction out of the DE-MRI data set is new and has not been reported to indicate critical areas of post-infarction arrhythmias. A selective, semi-automated technique for scar identification and reprocessing with image integration into a 3 dimensional mapping system greatly enhances the ability to display not only the endocardial scar but also areas of scar that are deeper and cannot be assessed properly by voltage mapping. Therefore, scar extraction and image registration enable the electrophysiologist to obtain more complete characterization of the arrhythmogenic substrate than available from electroanatomical voltage mapping.
After pre-procedural scar extraction and 3-dimensional reprocessing, the 3-dimensional scar can be registered during the procedure, thereby streamlining the mapping and ablation procedure. A similar approach was used by Dickfeld, et al and Fahmy et al(17,18) using computed tomography and positron emission tomography data. However, the definition of scar by MRI is more accurate (20), includes the degree of transmurality, and allows tissue characterization within the scar.
Electrogram Characteristics and Infarct Architecture
Infarcted tissue is composed of different components that can be differentiated based on electrogram characteristics. (7). Infarct depth as defined by DE-MRI correlates with different electrogram characteristics. Therefore DE-MRI, in addition to providing quantification of infarct depth, also helps to differentiate tissue within the scar. Specifically, isolated potentials were located in scar regions with the highest degree of transmurality. At locations where complex ventricular electrograms were present, the degree of transmurality of scar tissue was greatest.
Unipolar voltage also helped to assess the 3-dimensional character of scar tissue since it correlated significantly with infarct depth. Bipolar voltage was less useful for assessing infarct depth.
Optimal voltage cutoffs between normal myocardium and scar as determined by ROC curves were 1.0 mV bipolar and 5.8 mV unipolar, and as determined by scar area were 1.3 mV bipolar and 5.5 mV unipolar. Because of the limited density of endocardial measurements during EA mapping, as illustrated in Figure 3a, the point-based analysis with the reported ROC curves may yield a more accurate cut-off value between normal and scar tissue compared to a comparison of scar areas as suggested by others.(18)
Critical sites and Correlation with DE-MRI
All critical areas of post-infarction VT and PVCs that were identified during the mapping procedure were located within areas of delayed enhancement. Therefore, DE-MRI scar integration can be used to target post-infarction ventricular arrhythmias. Surviving muscle bundles within subendocardial scar tissue are responsible for ventricular arrhythmias in post-infarction patients. (19,20) Isolated potentials represent the electrophysiologic correlate of surviving muscle bundles within scar tissue. (7) About half of the critical sites identified had isolated potentials.
A larger peri-infarct area with heterogeneity of the enhanced areas in DE-MRI has been reported in patients with increased mortality after chronic myocardial infarction. Yan et al(4) hypothesized that surviving muscle bundles could account for the heterogeneity of the signal intensity of the delayed enhanced images. These areas were found in the periphery and center of the infarct scar. In the present study, critical sites projected on areas with delayed enhancement and were located predominantly within the core infarct. This is supported by prior studies in which VT isthmus sites and sites displaying isolated potentials were located well within the scar rather than in the scar border zone. (8,21) The MRI assessment of the border zone between infarct scar and normal tissue remains to be defined by higher resolution mapping correlating the EA maps with MRI findings.
Prior Studies
Codreanu, et al(10) compared DE-MRI data in post-infarction patients with EA mapping data. Scar delineation however was manually performed and therefore might have been subjective; this inaccuracy might have caused some of the mismatch described in their manuscript. Scar delineation in this study was performed by the method described by Amado et al(15) which has been shown to be accurate and objective. Furthermore, Codrenau, et al did not provide data on accuracy of their registration method nor on the arrhythmogenic substrate that was mapped during the procedure.
Limitations
The main limitation of this study is the small sample size. Also currently MRIs are difficult to perform in patients with ICDs. The study population is inhomogeneous in that patients with VT and PVCs were included. However, all patients had scar tissue as the arrhythmogenic substrate that was displayed by DE-MRI and EA mapping.
Minor mismatches between MRI and EA mapping data can be explained in part by the lack of high-density mapping of the entire endocardial surface on the EA map as compared to the DE-MRI data set. Therefore, the extent of scar tends to be smaller when assessed by EA mapping compared to MRI (as illustrated by figure 3a displaying both MRI and EA mapping data). Another source of inaccuracy between MRI and EA maps might be the difficulty to map and accurately display the entire papillary muscles.
Image registration between both imaging modalities was done post hoc. Real time image registration might improve accuracy. Development and implementation of global registration techniques using maximization of mutual information might also improve accuracy.
The entire reentry circuit of the targeted VTs was not mapped and therefore we were unable to correlate the entire arrhythmogenic substrate with the MRI findings. However, the only identifiable areas of the VT reentry circuits were most often located within the core infarct zone.
Clinical implications
All critical areas identified in this study were located in areas of delayed enhancement. Therefore, the DE-MRI improves efficiency by providing information that allows the operator to focus mapping in areas most likely to contain appropriate target sites for ablation. Scar tissue as defined by DE-MRI contains critical areas of post-infarction VT. The scar can be extracted and imported into an EA mapping system, thereby facilitating the mapping and ablation procedure.
Acknowledgments
Dr Desjardins was supported by NIH grant: 7K23EB006481
Footnotes
Publisher's Disclaimer: This is a PDF file of an unedited manuscript that has been accepted for publication. As a service to our customers we are providing this early version of the manuscript. The manuscript will undergo copyediting, typesetting, and review of the resulting proof before it is published in its final citable form. Please note that during the production process errors may be discovered which could affect the content, and all legal disclaimers that apply to the journal pertain.
References
- 1.Kim RJ, Chen EL, Lima JA, et al. Myocardial Gd-DTPA kinetics determine MRI contrast enhancement and reflect the extent and severity of myocardial injury after acute reperfused infarction. Circulation. 1996;94:3318–26. doi: 10.1161/01.cir.94.12.3318. [DOI] [PubMed] [Google Scholar]
- 2.Kim RJ, Fieno DS, Parrish TB, et al. Relationship of MRI delayed contrast enhancement to irreversible injury, infarct age, and contractile function. Circulation. 1999;100:1992–2002. doi: 10.1161/01.cir.100.19.1992. [DOI] [PubMed] [Google Scholar]
- 3.Mahrholdt H, Wagner A, Holly TA, et al. Reproducibility of chronic infarct size measurement by contrast-enhanced magnetic resonance imaging. Circulation. 2002;106:2322–7. doi: 10.1161/01.cir.0000036368.63317.1c. [DOI] [PubMed] [Google Scholar]
- 4.Yan AT, Shayne AJ, Brown KA, et al. Characterization of the peri-infarct zone by contrast-enhanced cardiac magnetic resonance imaging is a powerful predictor of post-myocardial infarction mortality. Circulation. 2006;114:32–9. doi: 10.1161/CIRCULATIONAHA.106.613414. [DOI] [PubMed] [Google Scholar]
- 5.Gepstein L, Hayam G, Ben-Haim SA. A novel method for nonfluoroscopic catheter-based electroanatomical mapping of the heart. In vitro and in vivo accuracy results. Circulation. 1997;95:1611–22. doi: 10.1161/01.cir.95.6.1611. [DOI] [PubMed] [Google Scholar]
- 6.Gepstein L, Goldin A, Lessick J, et al. Electromechanical characterization of chronic myocardial infarction in the canine coronary occlusion model. Circulation. 1998;98:2055–64. doi: 10.1161/01.cir.98.19.2055. [DOI] [PubMed] [Google Scholar]
- 7.Gardner PI, Ursell PC, Fenoglio JJ, et al. Electrophysiologic and anatomic basis for fractionated electrograms recorded from healed myocardial infarcts. Circulation. 1985;72:596–611. doi: 10.1161/01.cir.72.3.596. [DOI] [PubMed] [Google Scholar]
- 8.Bogun F, Good E, Reich S, et al. Isolated Potentials During Sinus Rhythm and Pace-Mapping Within Scars as Guides for Ablation of Post-Infarction Ventricular Tachycardia. J Am Coll Cardiol. 2006;47:2013–2019. doi: 10.1016/j.jacc.2005.12.062. [DOI] [PubMed] [Google Scholar]
- 9.Perin EC, Silva GV, Sarmento-Leite R, et al. Assessing myocardial viability and infarct transmurality with left ventricular electromechanical mapping in patients with stable coronary artery disease: validation by delayed-enhancement magnetic resonance imaging. Circulation. 2002;106:957–61. doi: 10.1161/01.cir.0000026394.01888.18. [DOI] [PubMed] [Google Scholar]
- 10.Codreanu A, Odille F, Aliot E, et al. Electroanatomic characterization of post-infarct scars comparison with 3-dimensional myocardial scar reconstruction based on magnetic resonance imaging. J Am Coll Cardiol. 2008;52:839–42. doi: 10.1016/j.jacc.2008.05.038. [DOI] [PubMed] [Google Scholar]
- 11.Simonetti OP, Kim RJ, Fieno DS, et al. An improved MR imaging technique for the visualization of myocardial infarction. Radiology. 2001;218:215–23. doi: 10.1148/radiology.218.1.r01ja50215. [DOI] [PubMed] [Google Scholar]
- 12.Hummel D, Strickberger S, Daoud E, et al. Results and efficency of programmed ventricular stimulation with four extrastimuli compared with one, two, and three extrastimuli. Circulation. 1994;90:2827–2823. doi: 10.1161/01.cir.90.6.2827. [DOI] [PubMed] [Google Scholar]
- 13.Josephson ME. Clinical Cardiac Electrophysiology. 3rd. Lippincott Williams & Wilkins; 2002. [Google Scholar]
- 14.Bogun F, Krishnan S, Siddiqui M, et al. Electrogram characteristics in postinfarction ventricular tachycardia: effect of infarct age. J Am Coll Cardiol. 2005;46:667–74. doi: 10.1016/j.jacc.2005.01.064. [DOI] [PubMed] [Google Scholar]
- 15.Amado LC, Gerber BL, Gupta SN, et al. Accurate and objective infarct sizing by contrast-enhanced magnetic resonance imaging in a canine myocardial infarction model. J Am Coll Cardiol. 2004;44:2383–9. doi: 10.1016/j.jacc.2004.09.020. [DOI] [PubMed] [Google Scholar]
- 16.DeLong ER, DeLong DM, Clarke-Pearson DL. Comparing the areas under two or more correlated receiver operating characteristic curves: a nonparametric approach. Biometrics. 1988;44:837–45. [PubMed] [Google Scholar]
- 17.Dickfeld T, Kocher C. The role of integrated PET-CT scar maps for guiding ventricular tachycardia ablations. Curr Cardiol Rep. 2008;10:149–57. doi: 10.1007/s11886-008-0025-1. [DOI] [PubMed] [Google Scholar]
- 18.Fahmy TS, Wazni OM, Jaber WA, et al. Integration of positron emission tomography/computed tomography with electroanatomical mapping: a novel approach for ablation of scar-related ventricular tachycardia. Heart Rhythm. 2008;5:1538–45. doi: 10.1016/j.hrthm.2008.08.020. [DOI] [PubMed] [Google Scholar]
- 19.Bolick DR, Hackel DB, Reimer KA, et al. Quantitative analysis of myocardial infarct structure in patients with ventricular tachycardia. Circulation. 1986;74:1266–79. doi: 10.1161/01.cir.74.6.1266. [DOI] [PubMed] [Google Scholar]
- 20.de Bakker JM, van Capelle FJ, Janse MJ, et al. Slow conduction in the infarcted human heart. ‘Zigzag’ course of activation. Circulation. 1993;88:915–26. doi: 10.1161/01.cir.88.3.915. [DOI] [PubMed] [Google Scholar]
- 21.Arenal A, Glez-Torrecilla E, Ortiz M, et al. Ablation of electrograms with an isolated, delayed component as treatment of unmappable monomorphic ventricular tachycardias in patients with structural heart disease. J Am Coll Cardiol. 2003;41:81–92. doi: 10.1016/s0735-1097(02)02623-2. [DOI] [PubMed] [Google Scholar]