Abstract
Boron (B) toxicity is common in many areas of the world. Plant tolerance to high B varies widely and has previously been attributed to reduced uptake of B, most commonly as a result of B efflux from roots. In this study, it is shown that the expression of genes encoding B efflux transporters in leaves of wheat (Triticum aestivum) and barley (Hordeum vulgare) is associated with an ability of leaf tissues to withstand higher concentrations of B. In tolerant cultivars, necrosis in leaves occurred at B concentrations more than 2-fold higher than in sensitive cultivars. It is hypothesized that this leaf tolerance is achieved via redistribution of B by efflux transporters from sensitive symplastic compartments into the leaf apoplast. Measurements of B concentrations in leaf protoplasts, and of B released following infiltration of leaves, support this hypothesis. It was also shown that under B-toxic conditions, leaching of B from leaves by rain had a strong positive effect on growth of both roots and shoots. Measurements of rates of guttation and the concentration of B in guttation droplets indicated that the impact of guttation on the alleviation of B toxicity would be small.
Boron (B) toxicity affects a wide variety of plants growing on soils with naturally high levels of B or when irrigated with water containing elevated levels of B (Stangoulis and Reid, 2002). Symptoms are most commonly seen as necrosis on leaf margins or leaf tips, depending on the type of leaf venation (Oertli and Kohl, 1961). Plant tolerance to high B varies considerably but is most commonly associated with reduced accumulation of B (Nable et al., 1997). Hayes and Reid (2004) identified differences in B efflux in roots as the primary determinant of the net uptake of B in barley (Hordeum vulgare). Reid (2007) established that this was also the mechanism for differences in B uptake in wheat (Triticum aestivum) and showed that there was a strong correlation between tolerance in both wheat and barley with the expression in roots of the genes TaBOR2 and HvBOR2, which encode B efflux transporters with homology to B efflux transporters in Arabidopsis (Arabidopsis thaliana) and rice (Oryza sativa; Takano et al., 2002; Nakagawa et al., 2007). Since the concentration of B in shoots was closely related to the concentration of B in roots (Hayes and Reid, 2004; Reid, 2007) a simple mechanism of tolerance could be explained. A similar mechanism of tolerance was shown to occur in Arabidopsis when roots overexpressed AtBor4 (Miwa et al., 2007).
Sutton et al. (2007) made a qualitative analysis of the expression in leaves of Bot1 (which is identical to HvBOR2 and to avoid confusion will henceforth be referred to as HvBOR2) and found strong expression associated with hydathodes in the leaf tip. They proposed that in addition to root-based tolerance conferred by pumping of B from roots, that further tolerance could be achieved by excretion of B from hydathodes and its subsequent removal by rain. Oertli (1962) demonstrated that in young barley seedlings, significant amounts of B could be lost from leaves in this way.
In the early work on B tolerance in cereals, it was noted that toxicity for plants grown in the field was generally observed at much lower concentrations of B in leaves than for plants grown in the glasshouse. For example, Nable et al. (1990) found that a 17% reduction in yield of field-grown barley occurred with a shoot B concentration of 62 mg kg−1 dry weight (DW) whereas in the glasshouse the corresponding concentration was 120 mg kg−1 DW. It was concluded that the most likely cause of the difference in shoot B between the growth conditions was leaching of B from leaves by rain in the field. However, an experiment in which a comparison was made between plants on which the leaves were regularly sprayed with water or not sprayed failed to show any difference in growth, despite significant reductions in leaf B in the sprayed plants (Nable et al., 1990).
Jefferies et al. (1999) identified chromosome regions associated with tolerance in barley. They found a major locus on chromosome 4 that was related to reduced B uptake and a decrease in leaf symptoms. This locus was subsequently found to contain HvBOR2 (Sutton et al., 2007), whose expression in roots could explain both reduced B uptake and the decrease in leaf symptoms. In addition to the locus on chromosome 4, there was another locus on chromosome 2 that was associated with leaf symptom score but not associated with whole shoot B concentration (Jefferies et al., 1999).
In this study we have shown that the expression of B efflux transporter genes in leaves results in enhanced tolerance to B, and contrary to previous reports, that rain can significantly reduce B toxicity.
RESULTS
B Concentrations in Necrotic Leaf Patches
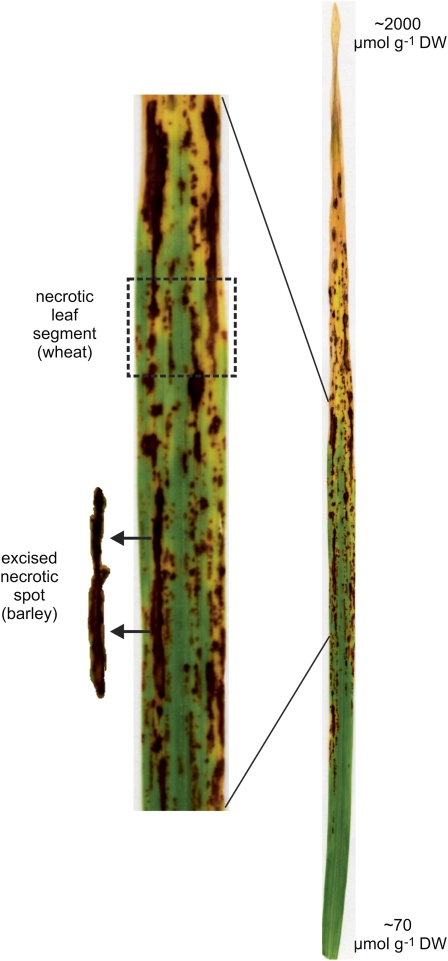
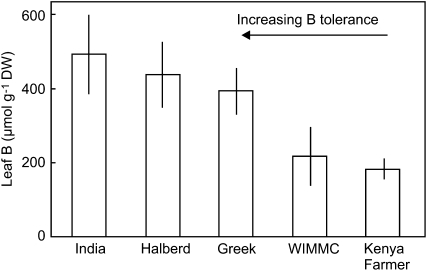
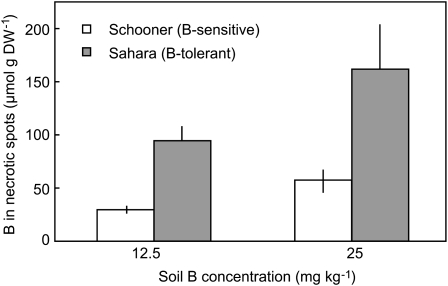
Then general pattern of B toxicity in wheat and barley is shown in Figure 1. The concentrations of B in leaves of five cultivars of wheat and two cultivars of barley grown on toxic concentrations of B were examined. Relative growth of these cultivars under B-toxic conditions is reported in Hayes and Reid (2004) and Reid (2007). In sections of wheat leaves that were completely necrotic, the B concentration in the five cultivars ranged from 960 to 2,390 μmol g DW−1, while in sections with no necrosis the B concentration ranged from 16 to 80 μmol g DW−1. In both cases the variability was high and there was no obvious correlation between tolerance and leaf concentration. The difficulty in sampling totally necrotic parts of leaves is that the area may have been dead for a short period, and therefore have relatively low B, or may have been dead for a long time but still evaporating xylem fluid leading to a high B concentration. Similarly for leaf sections showing no necrosis or chlorosis, it is not known whether the leaf cells are close to developing necrosis or are in a range that causes no metabolic disruption. In contrast, the leaf parts that are just beginning to develop necrosis will better reflect the concentration at which B becomes toxic. Plants were grown in 2 and 5 mm B and sections of wheat leaves were selected that contained both necrotic and live green areas (Fig. 1), with an average necrosis of between 20% and 40%. In these regions the B concentrations ranged from 184 to 496 μmol g DW−1 with a clear correlation between tolerance and leaf B concentration (Fig. 2). In barley because of the larger diameter of the leaves, it was possible to excise the necrotic spots in partially necrotic regions and measure the concentration of B just in the necrotic spots (Fig. 1). In the highly B-tolerant cultivar Sahara, the concentration of B in necrotic spots was 3-fold higher than in similar spots of leaves in the sensitive cultivar Schooner (Fig. 3).
Figure 1.
General pattern of B toxicity on a barley leaf showing the gradation in necrosis from leaf tip to base and the leaf sections selected for analysis of B concentrations in wheat and barley. [See online article for color version of this figure.]
Figure 2.
Concentration of B in necrotic patches of leaves from wheat plants with different tolerance to B toxicity. Each histogram represents the mean ± se B concentration in nine to 13 patches from leaves of three different plants. For each variety the average necrosis was between 22% and 40% of the leaf patch.
Figure 3.
Concentration of B in excised necrotic patches of leaves from barley plants with different tolerance to B toxicity. Each histogram represents the mean ± se B concentration in four extracts from four plants each containing six to 10 patches.
Expression of B Efflux Transporters
The B efflux transporter gene, HvBOR2 was highly expressed in leaves in the B-tolerant barley cultivar Sahara when grown at low B, and was reduced by 60% when grown for 7 d in 5 mm B (Table I). In the B-sensitive cultivar Schooner, HvBOR2 was difficult to detect at both low and high B (Table I). Similarly in wheat, expression of TaBOR2 was high in the tolerant cultivar India, and very low in the sensitive cultivar WIMMC*10 (Table I).
Table I.
Normalized expression of BOR2 genes from wheat and barley cultivars with high and low tolerance to B toxicity
Seedlings were transferred to 5 mm B on day 11 and harvested on day 15. Expression measurements are for three separate RNA extractions each containing leaves from two plants. Data shown as mean ± se.
| Treatment | BOR2 Relative Expression | B in Necrotic Spots (Barley) or Leaf Segments (Wheat) |
|---|---|---|
| μmol g DW−1 | ||
| Barley | ||
| Sahara −B | 1.00 ± 0.13 | |
| Sahara +B | 0.41 ± 0.16 | 1,030 ± 95 |
| Schooner −B | 0.01 ± 0.00 | |
| Schooner +B | 0.01 ± 0.00 | 315 ± 29 |
| Wheat | ||
| India −B | 1.00 ± 0.21 | 496 ± 110 |
| WIMMC*10 −B | 0.06 ± 0.02 | 218 ± 28 |
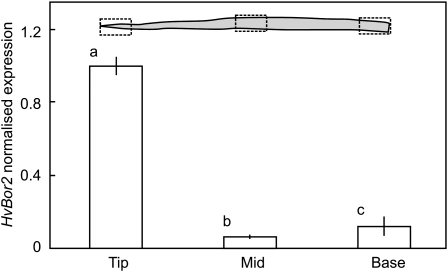
Expression of HvBOR2 at different positions along primary leaves of Sahara is shown in Figure 4. HvBOR2 was expressed all along the leaf but more strongly in the terminal 3 cm.
Figure 4.
Expression of HvBOR2 along a primary leaf of Sahara barley. Plants were grown for 28 d at low B. Leaves were approximately 30 cm long and leaf segments were 3 cm. Each value is the mean ± se of three replicate extractions. Different letters indicate significant differences (P < 0.05).
Leaf Protoplasts from a Tolerant Cultivar Have Lower Intracellular B
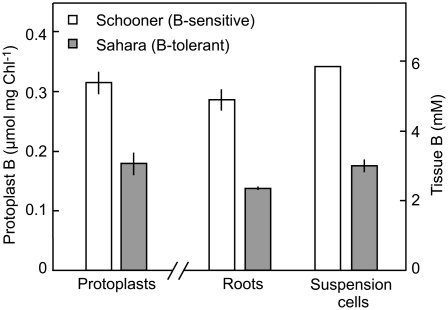
Protoplasts were isolated from the leaves of the two barley varieties, and incubated in solutions containing 10 mm B for 20 min, then briefly rinsed. The concentration of B in protoplasts of the tolerant cultivar Sahara was only 56% of the concentration in the sensitive cultivar Schooner (Fig. 5). This is similar to the reduction of intracellular B observed in roots and in suspension-cultured cells from these cultivars (Fig. 5).
Figure 5.
Concentrations of B in protoplasts, roots, and suspension-cultured cells of Sahara (B-tolerant) and Schooner (B-sensitive) barley. Protoplasts were incubated in 10 mm B and roots and suspension-cultured cells in 5 mm B. Chl, Chlorophyll.
Elution of B from Leaves
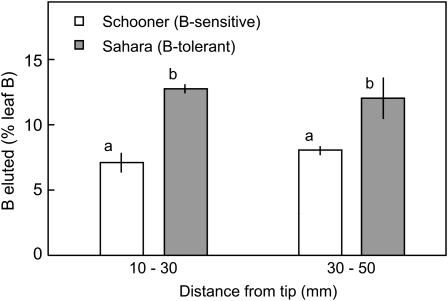
The lower B concentrations in leaf protoplasts and the higher total B concentrations in leaves of tolerant cultivars compared to sensitive cultivars displaying the same degree of toxicity points to a redistribution of B from the cell into the apoplast. It would be difficult to obtain accurate measurements of total apoplastic B because the high permeability of membranes to B would allow efflux into the apoplast during elution. However, if the apoplastic B is much higher in B-tolerant cultivars then it should be possible to see differences in the initial rate of loss from leaves. Leaf segments were subjected to two cycles of vacuum infiltration and centrifugation, lasting a total of 6 min and the eluates collected. When expressed as a percentage of total B in the leaf segment, 75% more B was eluted from the B-tolerant cultivar in the region 10 to 30 mm from the tip (just below the region of necrosis) and 50% more in the region 30 to 50 mm from the tip (Fig. 6). The proportion of leaf B that was eluted was independent of the B content; the percentages were similar in Sahara at 10 to 30 mm and 30 to 50 mm (12.8% and 12.1%, respectively) despite the difference in concentration (7.2 and 3.0 μmol g−1 fresh weight [FW]). Similarly in Schooner the percentage effluxes were 7.1 and 8.0 for leaf concentrations of 11.3 and 3.7 μmol g−1 FW.
Figure 6.
Elution of B from leaves of Sahara (B-tolerant) and Schooner (B-sensitive) barley over 6 min following infiltration and centrifugation of 10-mm leaf segments. Each value is the mean ± se of five determinations. Columns with different letters indicate significant differences between means (P < 0.05).
Effect of Rain on Leaf B and Growth
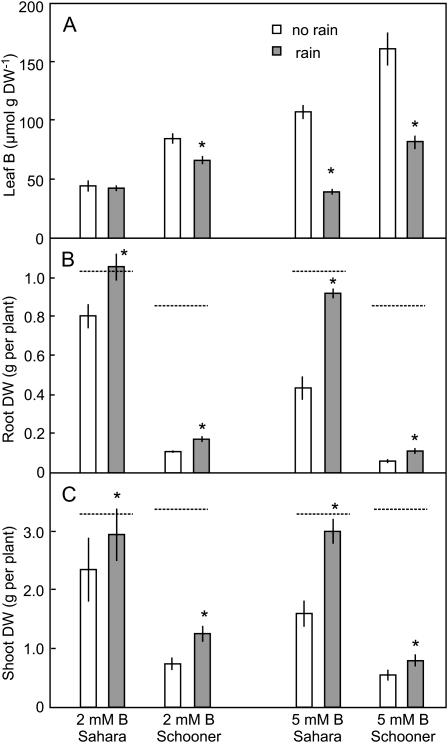
The ability of rain to dissolve and remove B from leaves was examined by periodic spraying of plants growing in slightly toxic (2 mm) and highly toxic (5 mm) B. As in previous experiments (Hayes and Reid, 2004), the concentration of B in leaves increased approximately in proportion to the concentration of B in the external solution, and the concentration in Schooner was much higher than in Sahara. Spraying the leaves with water to simulate rain resulted in substantial decreases in shoot B concentration. At 5 mm B, 63% of leaf B was removed in Sahara and 49% in Schooner (Fig. 7A). At 2 mm B, 28% was lost from Schooner while in Sahara the effect of rain was not significant (Fig. 7A).
Figure 7.
The effect of rain on the concentration of B in whole shoots (A), root DW (B), and shoot DW (C) of two cultivars of barley either sensitive (Schooner) or tolerant (Sahara) to B toxicity. Each value is the mean ± se of three to five replicates. Asterisks indicate significant difference (P < 0.05) compared to the no rain control. The dashed lines indicate weights of plants grown at low B.
Rain had a strong effect on growth under B-toxic conditions. At 5 mm B, root growth was 2-fold higher in both Sahara and Schooner while at 2 mm B, root growth increased by 31% and 57% in Sahara and Schooner, respectively (Fig. 7B). For all treatments there were also significant improvements in shoot growth in the plants subjected to the spray treatment (Fig. 7C).
Guttation
To assess the contribution of guttation to the excretion of B from leaves, guttation fluid was collected from leaves after various periods of exposure to B. In the first experiment, young barley seedlings were transferred to 5 mm B at the start of day 8 and guttation fluid collected during the night period 16 to 24 h later. To create conditions conducive to guttation, plants were placed under high humidity (approximately 90%) in darkness. In these plants no leaf necrosis was observed and guttation droplets were easily collected. The concentration of B in the guttation fluid for plants treated with 5 mm B was 3.8 ± 1.9 mm for Sahara and 9.4 ± 3.5 mm for Schooner. The plants were then returned to the growth chamber (humidity approximately 55%) and grown for a further 3 d. Guttation fluid was again collected during the night period of day 4. By this stage, leaf tips of Schooner were necrotic but droplets still formed on many leaves. The concentration of B in these droplets was approximately 50 mm and similar for both cultivars (Table II). At both sampling times the transpiration rate over 24 h was measured and tended to be higher in Sahara but this was partly obscured by the high variability (Table II). Similarly guttation appeared to be higher in Sahara but high variability between plants rendered the difference nonsignificant (Table II).
Table II.
Excretion of B in guttation fluid from leaves of barley following addition of 5 mm B to the treatment solutions
Values are means ± se (n = 6). Values followed by the same letter within a column are not significantly different (P < 0.05).
| Cultivar | Age | B Treatment | Transpiration | Guttation | B in Guttation Fluid |
|---|---|---|---|---|---|
| d | g g−1root FW d−1 | mm | |||
| Sahara | 8 | 1 | 10.5 ± 1.8 a | 0.099 ± 0.039 a | 3.8 ± 1.9 a |
| Schooner | 8 | 1 | 5.0 ± 0.8 b | 0.060 ± 0.021 a | 9.4 ± 3.5 b |
| Sahara | 11 | 4 | 17.0 ± 1.6 c | Not recorded | 59.1 ± 2.3 c |
| Schooner | 11 | 4 | 12.8 ± 3.2 c | Not recorded | 52.0 ± 1.1 c |
| Sahara | 28 | 4 | 9.7 ± 0.7 d | Nil | |
| Schooner | 28 | 4 | 9.5 ± 1.4 d | Nil | |
In older plants grown for 25 d then exposed to 5 mm B for 4 d, no guttation was observed, even on the youngest leaves. Transpiration rates were the same for both cultivars (Table II).
DISCUSSION
Expression of B Efflux Transporters in Leaves
Previous research has shown that B-tolerant cultivars accumulate less B in their leaves, which is easily explained by the expression of genes encoding B efflux transporters in roots of tolerant cultivars since shoot B concentration is strongly correlated with root B concentration (Hayes and Reid, 2004; Reid, 2007). We have shown here that the same efflux transporters are expressed in leaves, and that the B concentrations needed to induce necrosis are higher in cultivars with high transporter expression. It has been clearly demonstrated that B efflux generated by BOR2 is capable of lowering the intracellular B concentration in roots of barley by more than 50% and in roots of wheat by 30% by pumping B back into the surrounding medium (Hayes and Reid, 2004; Reid, 2007). In leaves, efflux pumping cannot reduce the total leaf B content, but redistribution of B from sensitive symplastic compartments into the apoplast could mitigate the toxic effects of B on growth and metabolism. When incubated in high B solutions, protoplasts prepared from leaves of the B-tolerant barley cultivar Sahara had much lower B concentrations than protoplasts from the B-sensitive cultivar Schooner, consistent with a higher capacity for B efflux in the tolerant cultivar. The difference in concentration in the leaf protoplasts was similar to the differences observed in roots for these cultivars. It was also shown that suspension-cultured cells from Sahara were able to reduce their intracellular B concentration to a similar extent to roots, suggesting that efflux pumping of B in this cultivar may be a feature of all cells in the plant.
Further evidence for redistribution of B between symplast and apoplast was obtained by rapid elution of leaf segments. In Sahara, 50% to 75% more B was eluted in the first 6 min compared to Schooner, which is consistent with their being a higher proportion of B in the apoplast of Sahara.
The higher expression of BOR2 genes is a constitutive trait in tolerant cultivars and is not induced in response to high B. The normal physiological function of these genes remains obscure but the transporters they encode could feasibly act to facilitate delivery of B to the developing cell wall where B is required as a structural component of the rhamnogalacturonan II complex (Matoh, 1997). The reason for the higher expression in B-tolerant cultivars is also uncertain but the suggestion by Sutton et al. (2007) that it is a consequence of an increase in copy number caused by accidental amplification of the genes seems reasonable. The reasons for the higher expression in barley in the leaf tip also remain unclear since the expression was not correlated with more B collected in guttation droplets.
Leaf B and Rainfall
Nable et al. (1990) have previously shown that spraying leaves to simulate the effects of rain can significantly reduce the concentration of B in leaves. However, they found that the reductions in leaf B concentration were not associated with improvements in growth. The problem with those experiments was that they were conducted at B concentrations that were only marginally toxic, therefore it would have been difficult to demonstrate any positive effect on growth. In our experiments using higher B concentrations, the proportion of B leached from the leaves (Fig. 5A) was similar to that obtained by Nable et al. (1990), and was associated with a marked improvement in growth, not only of the shoots but also the roots. This suggests that one component of the inhibition of root growth under high B conditions is a limitation in supply of photosynthate to roots as the leaves become necrotic.
There was no obvious relationship between the amount of B removed by rain and the expression of B transporters; the proportions in the sensitive and tolerant cultivars were similar (Fig. 7). In root cells B exchanges with B in the external solution with a half-time of less than 10 min (Hayes and Reid, 2004) and if this is similar in leaves, efflux pumping into the leaf apoplast may not make leaf B much more available for leaching.
The pattern of rainfall varies substantially between and within seasons and therefore the impact of B leaching from leaves will vary accordingly. It is frequently asserted that B toxicity is more severe in low rainfall areas because B is not leached down the soil profile, but equally, low rainfall will reduce leaching of B from leaves and increase toxicity.
Guttation
In addition to efflux pumping of B from leaf cells into the apoplast, and leaching of B by rain, excretion of B through guttation could potentially reduce B toxicity. Oertli (1962) reported that as much as 60% of B could be removed from barley leaves by guttation. Sutton et al. (2007) found high expression of HvBOR2 in hydathodes of a B-tolerant barley cultivar and proposed that efflux pumping in this tissue could contribute to excretion in the guttation fluid, and partly explain the differential tolerance in B-tolerant versus B-sensitive cultivars. Our measurements of expression levels of HvBOR2 along a barley leaf are in agreement with the pattern observed by in situ hydridization by Sutton et al. (2007) with higher expression observed at the tip. However, our results (Table II) generally argue against efflux pumping in hydathodes, and guttation in particular, as making a significant contribution to B removal from leaves. First, the B-sensitive cultivar Schooner, which has negligible expression of HvBOR2 in leaves, actually had higher or similar concentrations of B in its guttation fluid than Sahara, depending on the duration of B treatment. Additionally, the cells of the leaf tip became necrotic even under mildly B-toxic conditions, which would eliminate any capacity for active excretion. Second, the volume of guttation fluid is small in comparison to the volume lost through the remainder of the leaf by transpiration; most B would therefore be delivered by the transpiration stream to those parts of the leaf where evaporation is highest, which is usually the tissues that are most photosynthetically active. Third, for guttation to effectively reduce leaf B content, the guttation fluid would need to be completely removed from the leaf. While guttation probably occurs at any time when the stomates are closed, guttation droplets are only observed under very humid conditions; at other times the exuded fluid most likely evaporates and B becomes concentrated at the end of the leaf, which would precipitate the death of cells in the leaf tip. In many cases, the guttation droplets, once sufficiently formed, simply ran back down the vertical leaf, thereby redistributing B back toward the meristematic basal tissues that are more sensitive to B toxicity than the mature tissues (Reid et al., 2004). To place these results in the context of Oertli's (1962) experiments, the differences are mainly due to the way in which these earlier experiments were conducted. In that study, young seedlings were maintained under saturating humidity with low transpiration and guttation droplets were continuously removed. When the humidity was reduced to 50%, no guttation occurred, as was observed in our own experiments (Table II). Thus, while the experiments of Oertli (1962) demonstrated the capacity of guttation to remove B from leaves, it could only be realized under conditions that occur in the field transiently, aided by physical removal of the guttation fluid. The latter could potentially be effected by rain, but as we have also demonstrated, B can just as easily be leached from whole leaves by rain.
Relative Contributions of Root Efflux Transporters, Shoot Efflux Transporters, Rain, and Guttation to Alleviation of B Toxicity
Reid (2007) reported a 2-fold reduction in shoot B between the most sensitive and most tolerant wheat cultivars, which was interpreted as being due to efflux pumping of B from the roots and the subsequent reduction in B transport to the shoot. In comparison, there was a 2.8-fold increase in the concentrations of B at which necrosis occurred in leaves in tolerant compared to sensitive cultivars (Fig. 2), which is interpreted as being due to efflux pumping from symplast to apoplast in leaves. Similarly, rain reduced shoot B concentrations more than 2-fold in barley leaves treated with 5 mm B (Fig. 7). Thus, the three processes (1) efflux of B from roots, (2) redistribution of B in leaves, and (3) leaching by rain, all have the capacity to substantially mitigate the toxic effects of high B. It is more difficult to quantify the effects of guttation but from the data presented here it seems unlikely that it could make a significant contribution to the alleviation of B toxicity.
MATERIALS AND METHODS
Seeds of barley (Hordeum vulgare) and wheat (Triticum aestivum) were germinated on moist filter paper for 3 to 4 d then grown hydroponically in solution or on vermiculite in a nutrient solution containing (in mm) 3.75 NO3-N, 1.2 K, 1 Ca, 0.4 Mg, 0.4 S, and 0.2 P; and (in μm): 6.8 Na, 3.7 Cl, 3.6 Fe-EDTA, 1.8 Mn, 0.21 Mo, 0.15 Zn, 0.06 Cu, and 11.7 B. In toxicity studies this solution was supplemented with 2 or 5 mm B. Plants were grown in the laboratory on a 16/8-h day/night cycle at 22°C and illuminated at a flux density of 240 μmol m−2s−1. For growth longer than 8 d, the plants were then transferred to a growth chamber on a 12/12-h 25°C/20°C day/night cycle at a flux density of approximately 400 μmol m−2s−1.
B toxicity was also assessed for barley growing in soil. B was added to sandy loam at 12.5 and 25 mg kg−1 with nutrient solution as described above.
Expression Analysis of Bor Genes
The expression of TaBor2 (accession no. EU220225) and HvBor2 (accession no. EU223365) was measured by real-time PCR. RNA was extracted from root and shoot tissues using TRIzol (Invitrogen), following the protocol provided by the supplier. RNA was reverse transcribed using Superscript II (Invitrogen) or Omniscript (Qiagen) reverse transcriptases and polydT for barley and gene-specific primers for wheat. Real-time PCR analysis was conducted on a Corbett Rotor-Gene 6000 using Platinum SYBR Green (Invitrogen). Forward and reverse primers 5′AATCGTGGGCGAGTTCAGTA3′ and 5′CCCAAGTAGGCCATTGACAT3′ were used for barley and 5′GATGGGTCTGCATTTGGACT3′ and 5′CCAAAAAGCTCTCCTGCAAC3′ for wheat. Expression was normalized against tubulin 1 beta for barley (accession no. AM502849) and tubulin 2 beta (accession no. U76745) for wheat using primers 5′AGTATGCCACTCCCTTGGTG3′ and 5′GGTGAGGGGAACACTGAGAA3′ for both genes.
Preparation of Leaf Protoplasts and Suspension-Cultured Cells
Leaf protoplasts were isolated by density gradient centrifugation of leaves following digestion with cell wall degrading enzymes. All solutions contained 10 mm MES, 1 mm CaCl2 adjusted to pH 5.6 with KOH. The densities of the solutions were varied using either 600 mm Suc (PSuc), 600 mm sorbitol (PSor), or 600 mm Gly-betaine (PGB). The epidermis was peeled from leaves of 7-d-old barley plants and the leaves were then incubated in 2% cellulose (Onozuka R10, Yakult) and 1% pectinase (Yakult) in PSor at 30°C for 3 h. The digested tissue was filtered through a fine mesh strainer and transferred to 10-mL centrifuge tubes. Approximately 1 mL of PSuc was layered into the bottom of each tube and 0.5 mL of PGB was layered on the top and the tubes centrifuged at 190g for 10 min at 4°C. The upper layers were aspirated away down to the protoplasts that formed at the boundary between the PSor and PSuc layers. Approximately 3 mL of PSuc was added and mixed into the protoplasts. A layer (approximately 2 mL) of PSor:PSuc (1:1) was placed on top followed by 0.5 mL of PSor. The tubes were centrifuged at 190g for 10 min at 4°C and the protoplasts that formed at the boundaries between the layers were removed and combined.
Callus tissue was prepared from barley embryos according to the protocol described by Ohkoshi et al. (1991) then transferred to liquid medium with shaking according to Singh et al. (1997) to generate suspension-culture cells.
Measurement of B Uptake in Barley
Roots and solution cultured cells were equilibrated in their respective growth solutions containing 5 mm B for 20 h. Roots were then blotted without rinsing and suspension-cultured cells were sedimented by centrifugation. B was extracted in water at 98°C for 30 min.
Uptake into protoplasts was measured by mixing 50 μL of protoplast preparation in PGB (approximately 106/mL) with 25 μL of 30 mm B in PGB to give a final concentration of 10 mm B. After 20 min, 1 mL of PGB was added and the protoplasts sedimented by centrifugation at 5,000g for 30 s. The pellet was rinsed twice by addition of 1 mL of PGB and centrifugation at 5,000g for 30 s. Total rinse time was approximately 3 min. The pellet was extracted in water at 98°C for 30 min and the B content measured and expressed on a chlorophyll basis. Leaf chlorophyll content was similar for both barley cultivars (data not shown).
Elution of B from Leaves
Comparison of leaf apoplastic B concentrations between barley cultivars was done by measuring the initial release of B from leaf segments following vacuum infiltration. Because efflux pumping in roots has a major effect on leaf B concentrations, it was necessary to grow Sahara at 5 mm B and Schooner at 2 mm B to obtain plants with similar B concentrations in leaves.
Lohaus et al. (2001, and refs. therein) describe various methods for the measurement of apoplastic solute concentrations in leaves, involving infiltration with various solutions, centrifugation, or a combination of the two. While no consensus has been reached about which method is most effective, it appears that infiltration is necessary to provide a pathway for diffusive or convective flow of solutes from the intercellular spaces. To minimize contamination of apoplastic B with B effluxing across the cell membrane, a rapid elution procedure was employed involving two cycles of 1 min infiltration followed by a brief centrifugation. The method for infiltration is similar to that described in Lohaus et al. (2001). Approximately 0.1 g of 10-mm leaf slices was placed in a 1.5-mL Eppendorf tube with 1 mL of deionized water and inserted into a 60-mL syringe. A partial vacuum was achieved by pulling on the plunger. The reduced pressure was released after 30 s then reapplied for a further 30 s. The solution around the leaves was removed and the tube centrifuged at 2,000g for approximately 5 s. The remaining solution was collected, 1 mL of deionized water added to the leaves, and the infiltration and centrifugation steps repeated. The eluates were combined and the B concentration measured.
Rain Experiment
To simulate the effect of rain on leaves, pots containing barley seedlings were arranged in a measured area and were sprayed with water in a fine mist. Seedlings were grown for 8 d then transferred to solutions with or without supplemental B. Spray treatments commenced on day 13 and were applied morning and evening every second day for 16 d. The amount of rain applied was calibrated according to the surface area of the assembled pots to deliver a volume equivalent to 65 mm per month, which is typical of rainfall in many cereal growing districts of southern Australia in August, the time in which early growth of winter cereals occurs in this region. Infiltration of the spray into the nutrient solution was prevented by the lids on the pots and closed-cell foam around the stems of the plants. B concentrations were measured for the whole shoot at the end of the treatment period.
Transpiration and Guttation Measurements
Water loss from barley leaves was measured gravimetrically. The plants were incubated in nutrient solution containing 5 mm B and transpiration recorded for 24 h. During the 8-h night period, plants were induced to guttate by placing them in a chamber at approximately 90% humidity and 22°C. Guttation fluid was collected for 8 h and the B concentration in the guttation fluid was measured.
Tissue B Analyses
Soluble B in tissue extracts was measured by a colorimetric assay based on the reaction between B and azomethine-H (Gains and Mitchell, 1979).
Sequence data from this article can be found in the GenBank/EMBL data libraries under accession numbers EU220225 (TaBor2) and EU223365 (HvBor2).
Acknowledgments
The authors are grateful to Julie Hayes for the measurements of B uptake in suspension-cultured cells. The technical assistance of Yuta Kawamata is gratefully acknowledged.
This work was supported by the Australian Research Council.
The author responsible for distribution of materials integral to the findings presented in this article in accordance with the policy described in the Instructions for Authors (www.plantphysiol.org) is: Rob Reid (robert.reid@adelaide.edu.au).
Some figures in this article are displayed in color online but in black and white in the print edition.
References
- Gains TP, Mitchell GA (1979) Boron determination in plant tissue by azomethine-H method. Commun Soil Sci Plan 10 1099–1108 [Google Scholar]
- Hayes JE, Reid RJ (2004) Boron tolerance in barley is mediated by efflux of boron from the roots. Plant Physiol 136 3376–3382 [DOI] [PMC free article] [PubMed] [Google Scholar]
- Jefferies SP, Barr AR, Karakousis A, Kretschmer JM, Manning S, Chalmers KJ, Nelson JC, Islam AKMR, Langridge P (1999) Mapping of chromosome regions conferring boron tolerance in barley (Hordeum vulgare L.). Theor Appl Genet 98 1293–1303 [Google Scholar]
- Lohaus G, Pennewiss K, Sattelmacher B, Hussmann M, Muehling KH (2001) Is the infiltration-centrifugation technique appropriate for the isolation of apoplastic fluid? A critical evaluation with different plant species. Physiol Plant 111 457–465 [DOI] [PubMed] [Google Scholar]
- Matoh T (1997) Boron in plant cell walls. Plant Soil 193 59–70 [Google Scholar]
- Miwa K, Takano J, Omori H, Seki M, Shinozaki K, Fujiwara T (2007) Plants tolerant of high boron levels. Science 318 1417. [DOI] [PubMed] [Google Scholar]
- Nable RO, Banuelos GS, Paull JG (1997) Boron toxicity. Plant Soil 193 181–198 [Google Scholar]
- Nable RO, Paull JG, Cartwright B (1990) Problems associated with the use of foliar analysis for diagnosing boron toxicity in barley. Plant Soil 128 225–232 [Google Scholar]
- Nakagawa Y, Hanaoka H, Kobayashi M, Miyoshi K, Miwa K, Fujiwara T (2007) Cell-type specificity of the expression of Os BOR1 a rice efflux boron transporter gene is regulated in response to boron availability for efficient boron uptake and xylem loading. Plant Cell 19 2624–2635 [DOI] [PMC free article] [PubMed] [Google Scholar]
- Oertli J (1962) Loss of boron from plants through guttation. Soil Sci 94 214–219 [Google Scholar]
- Oertli J, Kohl H (1961) Some considerations about the tolerance of various plant species to excessive supplies of boron. Soil Sci 92 246–247 [Google Scholar]
- Ohkoshi S, Komatsuda T, Enomoto S, Taniguchi M, Ohyama K (1991) Variations between varieties in callus formation and plant regeneration from immature embryos of barley. Bull Natl Inst Agrobiol Resour 6 189–207 [Google Scholar]
- Reid R (2007) Identification of boron transporter genes likely to be responsible for tolerance to boron toxicity in wheat and barley. Plant Cell Physiol 48 1673–1678 [DOI] [PubMed] [Google Scholar]
- Reid RJ, Hayes JE, Post A, Stangoulis JCR, Graham RD (2004) A critical analysis of the causes of boron toxicity in plants. Plant Cell Environ 27 1405–1414 [Google Scholar]
- Singh R, Kemp JA, Kollmorgen JF, Qureshi JA, Fincher GB (1997) Fertile plant regeneration from cell suspension and protoplast cultures of barley (Hordeum vulgare cv. Schooner). Plant Cell Tiss Org 49 121–127 [Google Scholar]
- Stangoulis JCR, Reid RJ (2002) Boron toxicity in plants and animals. In H Goldbach, B Rerkasem, M Wimmer, PH Brown, M Thelier, R Bell, eds, Boron in Plant and Animal Nutrition. Kluwer, Dordrecht, The Netherlands, pp 227–240
- Sutton T, Baumann U, Hayes J, Collins NC, Shi B-J, Schnurbusch T, Hay A, Mayo G, Pallotta M, Tester M, et al (2007) Boron-toxicity tolerance in barley arising from efflux transporter amplification. Science 318 1446–1449 [DOI] [PubMed] [Google Scholar]
- Takano J, Noguchi K, Yasumori M, Kobayashi M, Gajdos Z, Miwa K, Hayashi H, Yoneyama T, Fujiwara T (2002) Arabidopsis boron transporter for xylem loading. Nature 420 337–339 [DOI] [PubMed] [Google Scholar]


