

Abstract
Adaptation is a central focus of biology, although it can be difficult to identify both the strength and agent of selection and the underlying molecular mechanisms causing change. We studied cryptically colored deer mice living on the Nebraska Sand Hills and show that their light coloration stems from a novel banding pattern on individual hairs produced by an increase in Agouti expression caused by cis-acting mutation(s), which either is, or is closely linked to, a single amino acid deletion in Agouti that appears to be under selection. Furthermore, our data suggest that this derived Agouti allele arose de novo after the formation of the Sand Hills. These findings reveal one means by which genetic, developmental, and evolutionary mechanisms can drive rapid adaptation under ecological pressure.
Introduction
To unravel evolutionary mechanisms in the wild, we must estimate the fitness advantage of adaptive alleles and infer their source, either as new or preexisting variation. In the Sand Hills of Nebraska, deer mice (Peromyscus maniculatus) have evolved a dorsal coat that closely matches their local habitat (Fig. 1A; Fig. S1). The Sand Hills are a dune field with soil mostly comprised of quartz grains (1, 2) that are lighter in color than the surrounding soils. P. maniculatus coat color is correlated with this soil color (3) likely due to selection against avian predation (4). Because light-colored mice are conspicuous prey on dark soils (5) and because the Sand Hills are geologically young—dating between the end of the Wisconsin glacial period (10-15,000 years ago) to within the last 8,000 years (6, 7)—the light coat coloration in Sand Hills mice represents a recent adaptation.
Fig. 1.
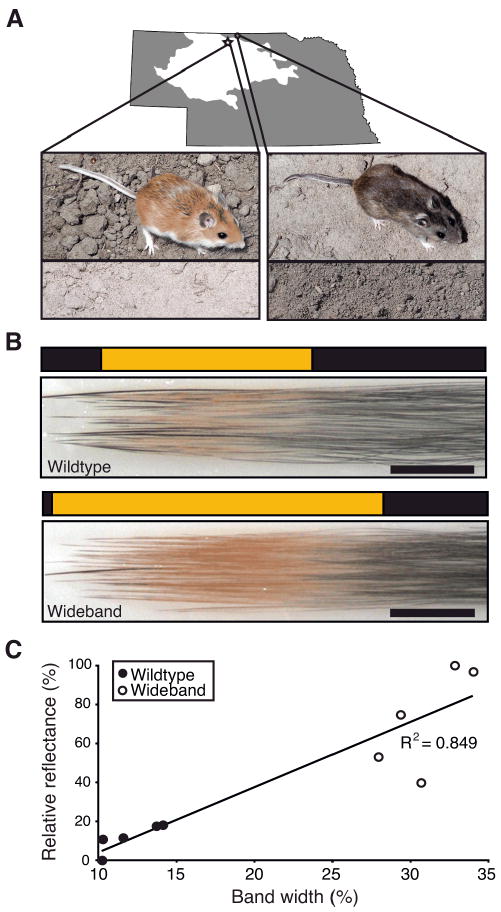
Soil and mice are brighter on the Sand Hills due to band width. (A) Approximate location of Sand Hills within Nebraska. Typical soil (bottom) and mouse (top) colors for populations sampled on (star) and off (circle) the Sand Hills. Mice are shown on contrasting soil backgrounds. (B) Hairs from the dorsum of wideband mice have a wider band of pheomelanin than those from wildtype mice. Scale bar is 1.0 mm. (C) Larger band area is significantly correlated with reflectance as measured with a spectrophotometer.
Wider hair bands make lighter mice
To a large extent, variation in mammalian pigmentation can be explained by the distribution and relative amounts of brown-black eumelanin and yellow-red pheomelanin pigments in individual hairs (8, 9). Pigment-producing cells (melanocytes) at the base of hair follicles can switch between the production of these pigments during hair growth, resulting in hairs with different banding patterns. Many mammals, including laboratory mice, can have hairs containing a subapical band of pheomelanin on an otherwise eumelanic hair. In Peromyscus, this pheomelanic band is markedly wider in Sand Hills mice than in their darker conspecifics (Fig. 1B). Accordingly, the light Sand Hills phenotype has been dubbed “wideband” (10).
To evaluate the relationship between a mouse's overall lightness and the size of pheomelanic bands on its dorsal hairs, we compared band width and brightness in five wideband and five wildtype P. maniculatus (Fig. 1C). Band width was measured by excising skin plugs from the dorsum and measuring the relative areas of yellow and black pigments in micrographs of the attached hairs [e.g., Fig. 1B; (11)]. We quantified pelt brightness by measuring the percentage of light reflected using a spectrophotometer and found that band width and reflectance were strongly correlated (R2=0.849; ANOVA, N=10, p=0.00015; Fig. 1C). Thus, the increased width of the subapical pheomelanic band on dorsal hairs is, to a large degree, responsible for the overall lighter color in mice derived from the Sand Hills.
Agouti is responsible for the wideband phenotype
Given its role in producing pheomelanin and its known phenotypic effects, Agouti is a strong candidate for the gene causing the wideband phenotype. In Mus musculus, knockouts of Agouti result in eumelanic (dark colored) mice, overexpression of Agouti results in pheomelanic (light colored) mice, and light alleles are generally dominant to dark ones (12-14). Consistent with this dominance hierarchy, we found that all offspring from a cross between pure wideband (awb/awb) and pure wildtype (a+/a+) Peromyscus maniculatus were phenotypically wideband (N=31). Furthermore, a pulse of Agouti expression during hair growth in wildtype M. musculus correlates with the production of subapical pheomelanic bands (12,15). To determine if the wideband phenotype in Peromyscus is caused by Agouti, we intercrossed P. maniculatus that were heterozygous for nonagouti (a-) (16), a melanic strain resulting from a recessive 125-kb deletion lacking Agouti expression (17). The resulting ratio of wideband:nonagouti phenotypes among the offspring did not differ significantly from 3:1 (Table S1; X2 test, N=49, p=0.46), suggesting that the wideband phenotype segregates as a single dominant Agouti allele [see also (18)]. Furthermore, the 125-kb deletion segregated perfectly with coat color phenotype among the offspring; markers for other pigmentation genes (attractin and tyrosinase-related protein 1) did not (Table S1). Finally, no sequence differences were observed between wildtype, wideband, and nonagouti P. maniculatus in the melanocortin-1 receptor (Mc1r) coding region (N=7 awb/a-; N=2 a-/a-, N=1 a+/a+).
Agouti mRNA levels in wideband/nonagouti P. maniculatus were significantly higher than in wildtype/nonagouti mice (Fig. 2A; awb/ a- vs. a+/ a- t-test, N=8, p=0.0069 one-tailed). This expression difference persisted when abundance of both alleles was measured separately in awb/a+ heterozygotes (Fig. 2A; awb vs. a+ t-test, N=8, p=0.00031 one-tailed), demonstrating that mutation(s) acting in cis lead to an increase in Agouti expression (19). These data indicate that cis-acting mutation(s) in, or linked to, the Agouti gene are responsible for the wideband phenotype.
Fig. 2.
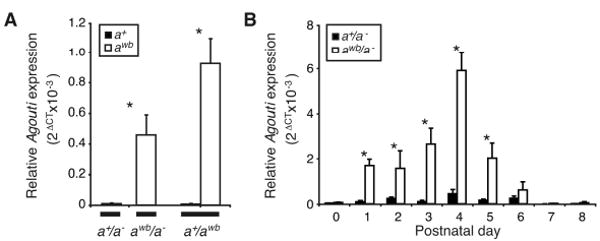
A cis-acting mutation(s) increases Agouti expression and causes the wideband phenotype. (A) Quantitative RT-PCR assays show that P. maniculatus with the wideband allele (awb) express Agouti at a higher level than those with the wildtype allele (a+). In heterozygotes (a+/awb), the awb allele is expressed at a higher level than a+ allele, suggesting that the causal mutation(s) acts in cis. (B) Expression of Agouti transcript is significantly higher in wideband mice from postnatal day 1 (p1) to p5 (asterisks denote significance at p<0.05, t-test, N=3-6 for each genotype and time point). Agouti expression was measured relative to β-actin; data are mean +/- SEM.
We also measured Agouti mRNA levels over a synchronized hair cycle (i.e., as hairs first emerge simultaneously in newborn mice) in neonatal wideband and wildtype P. maniculatus. Because Agouti initiates the production of the pheomelanic hair band due to a pulse of expression occurring postnatally from day three (p3) to seven (p7) in Mus musculus (15), we measured Agouti expression between p0 and p8 in wideband and wildtype P. maniculatus (Fig. 2B). Between p1 and p5 inclusive, Agouti mRNA was significantly more abundant in wideband mice than wildtype (Fig. 2B; t-tests, N=7-9, p<0.05 one-tailed). While Agouti expression peaks at p4 in both wideband and wildtype mice, in wideband mice expression peaks above wildtype levels by p1 and remains at or above this level until p7 (Fig. 2B). Thus, the pulse of Agouti expression during hair growth is both longer and higher in wideband postnatal mice, suggesting that increased Agouti expression is the underlying cause of the wideband phenotype in P. maniculatus.
Agouti produces two transcriptional isoforms, each with a different expression profile (15, 20). The hair-cycle specific isoform that produces the hair band in Mus, contains untranslated exons 1B or 1C and is expressed in a timed pulse during hair growth (15). We sequenced exons 1B, 1C, 2, 3, and 4 in four wideband and four wildtype P. maniculatus and compared these to a P. maniculatus rufinus individual with a wildtype phenotype, as an outgroup. Within the transcript expressed in the hair-cycle, we identified 20 nucleotide differences between wideband and wildtype mice; 11 of which were derived relative to the outgroup in wideband mice (Fig. 3A). Seven differences (four derived) were observed within the coding region of which two resulted in amino acid changes in wideband mice, a conservative amino acid substitution (Arg37Lys) and a serine deletion (residue 48), both in exon 2. All polymorphisms were perfectly associated with the wideband phenotype in laboratory populations of Peromyscus.
Fig. 3.
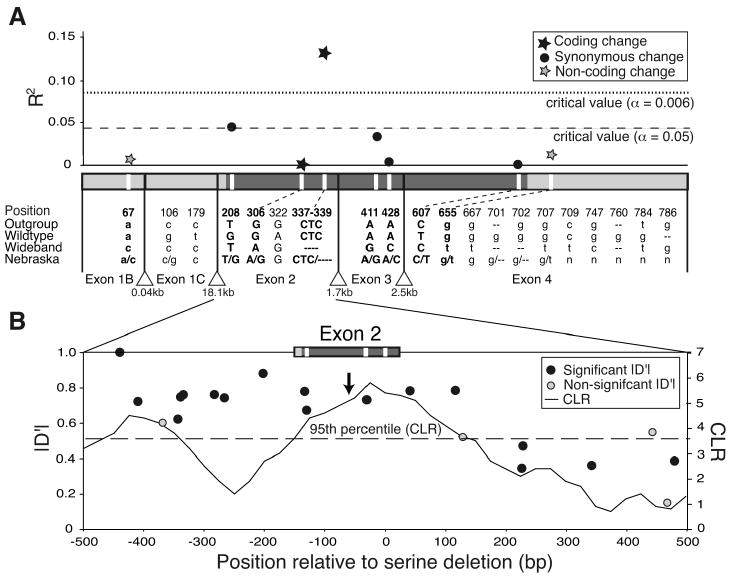
A coding deletion in exon 2 is associated with band width and sweep-like patterns of genetic variation. (A) The correlation (R2) between genotype and phenotype (band width) in a natural population. Hair-cycle transcript exons (x-axis) are drawn to scale and coded as follows: translated regions (dark gray; uppercase), untranslated regions (light gray; lowercase), introns (triangles). Significance thresholds are before (α=0.05) and after Bonferroni correction (α=0.006). Listed are all sites that differed between wideband and wildtype mice, along with an outgroup (P. maniculatus rufinus), and the consensus sequence for 91 wild-caught individuals (Nebraska). R2 is plotted for 8 polymorphic sites (MAF >2%) (white vertical bars; bolded letters) in the Nebraska population. Length heterozygosity resulted in some missing data; these sites were excluded from analysis. A derived amino acid deletion in exon 2 explains 13% of the phenotypic variation in Nebraska mice. (B) Linkage disequilibrium (LD; left axis) and signature of selection (right axis) across exon 2 flanking region. Position relative to exon 2 (top) or to the exon 2 serine deletion (bottom) is given. Each point is pairwise LD (|D′|, left axis) between a common polymorphism (MAF > 10%) and the serine deletion; black points are significant via chi-square tests after Bonferroni correction. Also given is the composite likelihood ratio (CLR, right axis) as a function of position (solid line) for the wideband haplotype. The dotted line corresponds to the 95th percentile of the CLR (3.62); the arrow indicates the position that maximizes the ω–statistic (i.e., ωmax). SFS and LD based analyses both point to the serine deletion as the putative target of selection.
Wideband allele frequency in natural populations
To test if any of these Agouti polymorphisms were associated with the wideband phenotype in nature, we captured 91 individuals from two phenotypically variable populations near the edge of the Sand Hills (Fig. 1A; Table S2). We collected phenotypic (band width and brightness) and genotypic (Agouti hair-cycle transcript sequence and alleles at 7 microsatellite markers) data for each individual. We pooled individuals from the two locations for association tests because we did not detect differences in color among the populations (brightness: t-test, N=91, p=0.90 two-tailed). Moreover, while the program STRUCTURE (21, 22) identified 2 genetic clusters (K=2), which corresponded to geography (Fisher's exact test, N=85, p=0.0039; mean FST across 7 microsatellite loci was 0.020 +/- 0.003 SEM), there was no correlation with phenotype (brightness: t-test, N=91, p=0.89 two-tailed). These results suggest that mice do not mate assortatively on the basis of coat color and that dark-colored mice are not recent, genetically distinct migrants. Therefore, we hypothesized that light and dark mice interbreed with ample opportunity for recombination between the wideband and wildtype alleles.
Because band width and brightness were more variable in Sand Hills mice than in the laboratory populations (Fig. S2A,B) we used quantitative measures of both band width and brightness, rather than discrete categories, for association tests. At the Agouti locus, most of the hair-cycle transcript polymorphisms identified in the lab were also variable among Sand Hills mice (Fig. 3A). Of these candidate polymorphisms, only the serine deletion in exon 2 explained variation in band width (13.2% of the observed variation) and in overall brightness (8.8% of variation) after correction for multiple comparisons (Fig. 3A) and was consistent with observed dominance patterns from laboratory crosses. Specifically, individuals with one or more copies of the deletion (aΔSer/-) were significantly lighter than those without (a+/a+) (t-tests, N=91; band width: p=0.00020 one-tailed; brightness: p=0.0022 one-tailed), while heterozygotes (aΔSer/a+) and homozygotes (aΔSer/aΔSer) were phenotypically indistinguishable (t-tests, N=62; band width: p=0.81 two-tailed; brightness: p=0.39 two-tailed).
This serine deletion occurs in an evolutionarily conserved region of the Agouti protein that interacts with Attractin, an accessory receptor thought to facilitate Agouti's role in pigment-switching (23). It is therefore possible that the serine deletion is directly responsible for the wideband phenotype. Alternatively, the deletion could be in linkage disequilibrium (LD) with the causal mutation(s). We thus examined patterns of LD upstream and downstream of the deletion. We observed significant LD across the entire 1 kb region flanking exon 2 and found that LD rapidly decays downstream (3′), but not upstream (5′), of the deletion (Fig. 3B) when we examined high frequency polymorphisms (minor allele frequency >10%). Additionally, LD persisted as far as 19 kbp upstream of the deletion, but not past 600 bp downstream (Table S3). On the basis of these results, we cannot determine whether the serine deletion or a linked mutation or both causes wide bands and light coats. Given the rapid decay of LD downstream of the deletion, the observed extended upstream LD may be due to epistatic selection on multiple, coadapted mutations [e.g., (24, 25)]. Nonetheless, the haplotype containing the serine deletion (hereafter, “wideband haplotype or allele”) explains a significant amount of ecologically-relevant phenotypic variation.
Selection on the wideband haplotype
To compare putatively adaptive (i.e., wideband or aΔSer) and neutral (i.e., wildtype or a+) haplotypes, we examined nucleotide variation in the two haplotype classes. A significant reduction in variation, consistent with patterns expected under a selective sweep, were observed in the wideband haplotype compared to the wildtype haplotype (Fig. 4A; S = 52 and π=0.0081 for N=80 wideband vs. S = 80 and π=0.0133 for N=102 wildtype). We also found that the shape of the full site frequency spectra (SFS) for the haplotype classes differed between wildtype and wideband haplotypes (Fig. S3). The wildtype haplotype was not distinguishable from that predicted under a neutral equilibrium model while the wideband haplotype showed a strong skew in the SFS, matching a hitchhiking model (i.e., a U-shaped SFS).
Fig. 4.
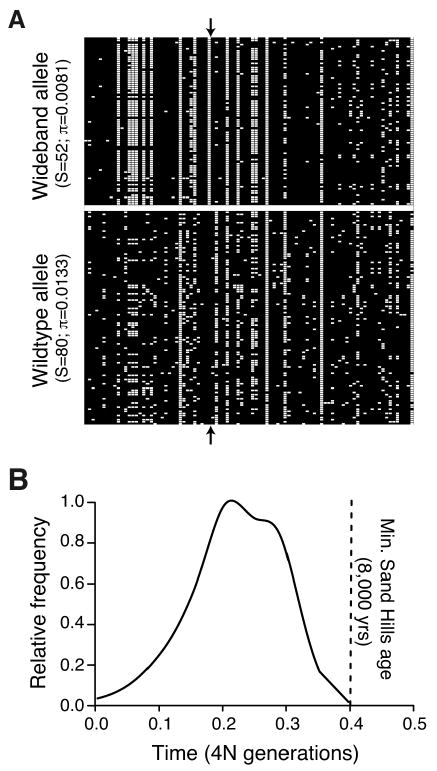
The wideband mutation arose de novo after formation of the Sand Hills. (A) Variation in exon 2 flanking region for wideband (aΔSer, N=80) and wildtype (a+, N=102) alleles. Rows are observed haplotypes; columns are variable nucleotide sites (ancestral=black; derived=white; outgroup=P. maniculatus rufinus). Arrows indicate the derived serine deletion. Number of segregating sites (S) and nucleotide diversity (π) are given for both haplotypes. Reduced variation among wideband alleles matches pattern expected under selection on a de novo mutation. (B) Posterior probability distribution for the age (in 4N generations) of the beneficial wideband allele (aΔSer), and minimum age of the Sand Hills (8,000 years, or 0.4 4N generations assuming N=10,000 and 2 gen/year).
To distinguish between selective and neutral models, we performed a composite likelihood ratio (CLR) test (26), and separately evaluated the evidence for selection on the wideband and wildtype haplotypes [following ref. (27)]. A significant signature of positive selection was observed for the wideband haplotype (CLRT p-value = 0.012), but not on the remaining chromosomes (CLRT p-value = 0.123). We then used the goodness-of-fit (GOF) test (28) on the wideband haplotype and found that the hitchhiking model could not be rejected (GOF p-value = 0.813). Finally, we employed the ωmax statistic (29, 30) and found that the LD patterns across the wideband haplotype were significantly different from those expected under neutrality (ωmax p-value = 0.041), while LD patterns for the wildtype haplotype classes were not (ωmax p-value = 0.345). Together, these results demonstrate that selection is likely acting on the wideband Agouti haplotype.
Additionally, these analyses identified a location at or near the serine deletion that is the nucleotide site that maximizes the significance of the CLR and ω test statistics (26, 29)—and thus is the most likely target of selection in our data (Fig. 3B). Since patterns of variation around a selected site may only be expected to be symmetric on average, but not in any individual realization (26), the noted patterns of asymmetric LD surrounding the deletion are consistent with our conclusion (see Fig. 3B).
Strength and timing of selection
To estimate the selection coefficient acting on the wideband haplotype, we obtained maximum likelihood estimates of α = 2Ns via maximization of the composite likelihood function (26) and found an estimate of α =112. Assuming an N = 10,000 (31), this corresponds to an estimated selection coefficient of s = 0.0056. Using a parametric bootstrap (32), we obtained a 95% confidence interval (constructed with the percentile method) that spans from α = 56 to α = 207 (s = 0.0028 to 0.0104). Based on owl predation experiments (4) and the observed Agouti allele frequencies, we estimated that wideband mice have a selective advantage s = 0.102 when on light soil compared to darker mice. This is certainly an overestimate of selection, given that predation rates were most likely artificially inflated in the enclosed arena tested (4) and that other loci likely contribute to the Sand Hills mouse phenotype. Nevertheless, both population genetic data and predation experiments suggest that selection for light color is strong, and our estimates fall within the range of selection coefficients for other color polymorphisms, including in beach mice (33), pocket mice (5), ladybirds (34), and land snails (35).
Based on our estimates of the selection strength acting on the wideband allele, we inferred the timing of selection on this allele. From our 95% CI of s and calculation of ∼2ln(2N)/s (36), we predict that the wideband allele should reach fixation (100% frequency) in 0.05 to 0.18 4N generations. These estimates were also similar to those obtained with a Bayesian approach (37), in which we found that over 99.9% of the posterior probability density falls on 0.5 ≥ T, ∼85.4% on 0.25 ≥ T, and ∼3.7% on 0.01 ≥ T, where T is the age of the beneficial allele in 4N generations (Fig. 4B). Given that the estimated age of the Sand Hills is 8-10,000 years (or ∼0.4-0.5 4N generations), our estimates suggest this allele arose and underwent an incomplete sweep sometime after the formation of the Sand Hills.
Multiple lines of evidence suggest that the wideband allele arose de novo and was not a preexisting allele. First, the haplotype carrying the deletion has greatly reduced variation relative to the wildtype (Fig. 4A), inconsistent with a model in which the causative mutation was neutrally segregating in the population prior to any selective pressure (38). Second, the U-shaped SFS is most consistent with a model in which selection acts upon a newly arising mutation (Fig. S3). If the beneficial mutation existed on multiple haplotypes prior to the selective pressure, we would expect to see an excess of intermediate frequency mutations, which was not observed (38). Finally, the posterior probability density of the allele age falls entirely within the estimated age of the Sand Hills (Fig. 4B).
Taken together, our results demonstrate that variation at the Agouti locus is responsible for adaptive coloration in deer mice living on the Nebraska Sand Hills. While it is clear that a derived increase in Agouti expression leads to wider hair bands and lighter camouflaging color, whether and by which mechanism an amino acid deletion (aΔSer) leads to a change in gene expression and ultimately phenotypic evolution is still unknown. From our estimates of the strength and timing of selection acting on this adaptive allele, we conclude that the wideband Agouti allele arose de novo after the colonization of a novel selective environment, counter to recent studies demonstrating adaptation arising from standing genetic variation (39-41). This suggests that rapid adaptive change – such as the recent evolution of cryptic coloration in Sand Hill mice – need not always rely on preexisting genetic variation.
Supplementary Material
Acknowledgments
We thank J. Crossland and M. Dewey for assistance with crosses; W. Dawson for his advice; M. Chin, B. Hehli, and K. Hogan for laboratory assistance; J. Chupasko, E. Kay, M. Manceau, and J. Weber for field assistance; J. Demboski and the Denver Museum of Nature and Science for logistical support; J. Losos and B. Payseur for comments; and G. Barsh for ongoing discussion about Agouti. CRL was supported by a Ruth Kirschstein National Research Service Award from the National Institutes of Health; JDJ was supported by a National Science Foundation Biological Informatics Postdoctoral Fellowship. Laboratory and fieldwork was funded by the National Science Foundation and the Museum of Comparative Zoology at Harvard University. P. maniculatus were collected under the Nebraska Game and Parks Commission Scientific and Educational Permit #901, and voucher specimens were deposited in the Mammal Department at the Museum of Comparative Zoology. Sequence data was deposited in GenBank (accession numbers: GQ337976-GQ337987 and GQ340804-GQ340896).
Footnotes
This manuscript has been accepted for publication in Science. This version has not undergone final editing. Please refer to the complete version of record at http://www.sciencemag.org/. The manuscript may not be reproduced or used in any manner that does not fall within the fair use provisions of the Copyright Act without the prior, written permission of AAAS.
Supporting Online Material: Materials and Methods, Figs. S1-S3, Tables S1-S5, References
References and Notes
- 1.Lewis DT. In: An Atlas of the Sand Hills. Bleed A, Flowerday C, editors. Conservation and Survey Division, University of Nebraska-Lincoln; Lincoln: 1989. p. 57. [Google Scholar]
- 2.Ahlbrandt TS, Fryberger SG. In: Recent and Ancient Nonmarine Depositional Environments. Ethridge FG, Flores RM, editors. Society of Economic Paleontologists and Mineralogists; Tulsa, OK: 1981. pp. 293–314. [Google Scholar]
- 3.Dice LR. Contrib Lab Vertebrate Genet Univ Michigan. 1941;15:1. [Google Scholar]
- 4.Dice LR. Contrib Lab Vertebrate Biol Univ Michigan. 1947;34:1. [Google Scholar]
- 5.Hoekstra HE, Drumm KE, Nachman MW. Evolution. 2004;58:1329. doi: 10.1111/j.0014-3820.2004.tb01711.x. [DOI] [PubMed] [Google Scholar]
- 6.Swinehart JB. In: An Atlas of the Sand Hills. Bleed A, Flowerday C, editors. Conservation and Survey Division, University of Nebraska-Lincoln; Lincoln: 1989. pp. 43–56. [Google Scholar]
- 7.Loope DB, Swinehart J. Gt Plains Res. 2000;10:5. [Google Scholar]
- 8.Jackson IJ. Annu Rev Genet. 1994;28:189. doi: 10.1146/annurev.ge.28.120194.001201. [DOI] [PubMed] [Google Scholar]
- 9.Hoekstra HE. Heredity. 2006;97:222. doi: 10.1038/sj.hdy.6800861. [DOI] [PubMed] [Google Scholar]
- 10.McIntosh WB. Contrib Lab Vertebrate Biol Univ Michigan. 1956;73:1. [Google Scholar]
- 11.Materials and methods are available as supporting material on Science Online.
- 12.Bultman SJ, Michaud EJ, Woychik RP. Cell. 1992;71:1195. doi: 10.1016/s0092-8674(05)80067-4. [DOI] [PubMed] [Google Scholar]
- 13.Miltenberger RJ, et al. Genetics. 2002;160:659. doi: 10.1093/genetics/160.2.659. [DOI] [PMC free article] [PubMed] [Google Scholar]
- 14.Miller M, et al. Genes Dev. 1993;7:454. doi: 10.1101/gad.7.3.454. [DOI] [PubMed] [Google Scholar]
- 15.Vrieling H, Duhl D, Millar S, Miller K, Barsh G. Proc Natl Acad Sci USA. 1994;91:5667. doi: 10.1073/pnas.91.12.5667. [DOI] [PMC free article] [PubMed] [Google Scholar]
- 16.Horner BE, Potter GL, Van Ooteghem S. J Hered. 1980;71:49. [Google Scholar]
- 17.Kingsley EP, Wiley CD, Hoekstra HE. PLoS ONE. doi: 10.1371/journal.pone.0006435. in press. [DOI] [PMC free article] [PubMed] [Google Scholar]
- 18.K. M. Dodson, University of South Carolina (1982).
- 19.Wittkopp PJ, Haerum BK, Clark AG. Nature. 2004;430:85. doi: 10.1038/nature02698. [DOI] [PubMed] [Google Scholar]
- 20.Bultman S, et al. Genes Dev. 1994;8:481. doi: 10.1101/gad.8.4.481. [DOI] [PubMed] [Google Scholar]
- 21.Pritchard JK, Stephens M, Donnelly P. Genetics. 2000;155:945. doi: 10.1093/genetics/155.2.945. [DOI] [PMC free article] [PubMed] [Google Scholar]
- 22.Falush D, Stephens M, Pritchard JK. Genetics. 2003;164:1567. doi: 10.1093/genetics/164.4.1567. [DOI] [PMC free article] [PubMed] [Google Scholar]
- 23.Jackson P, et al. Chem Biol. 2006;13:1297. doi: 10.1016/j.chembiol.2006.10.006. [DOI] [PMC free article] [PubMed] [Google Scholar]
- 24.Storz J, et al. PLoS Genet. 2007;3:e45. doi: 10.1371/journal.pgen.0030045. [DOI] [PMC free article] [PubMed] [Google Scholar]
- 25.McGregor AP, et al. Nature. 2007;448:587. doi: 10.1038/nature05988. [DOI] [PubMed] [Google Scholar]
- 26.Kim Y, Stephan W. Genetics. 2002;160:765. doi: 10.1093/genetics/160.2.765. [DOI] [PMC free article] [PubMed] [Google Scholar]
- 27.Meiklejohn C, Kim Y, Hartl D, Parsch J. Genetics. 2004;168:265. doi: 10.1534/genetics.103.025494. [DOI] [PMC free article] [PubMed] [Google Scholar]
- 28.Jensen J, Kim Y, DuMont V, Aquadro C, Bustamante C. Genetics. 2005;170:1401. doi: 10.1534/genetics.104.038224. [DOI] [PMC free article] [PubMed] [Google Scholar]
- 29.Kim Y, Nielsen R. Genetics. 2004;167:1513. doi: 10.1534/genetics.103.025387. [DOI] [PMC free article] [PubMed] [Google Scholar]
- 30.Jensen J, Thornton K, Bustamante C, Aquadro C. Genetics. 2007;176:2371. doi: 10.1534/genetics.106.069450. [DOI] [PMC free article] [PubMed] [Google Scholar]
- 31.Laurie C, et al. PLoS Genet. 2007;3:e144. doi: 10.1371/journal.pgen.0030144. [DOI] [PMC free article] [PubMed] [Google Scholar]
- 32.Jensen J, Thornton K, Aquadro C. Mol Biol Evol. 2008;25:438. doi: 10.1093/molbev/msm273. [DOI] [PubMed] [Google Scholar]
- 33.Mullen LM, Hoekstra HE. Evolution. 2008;62:1555. doi: 10.1111/j.1558-5646.2008.00425.x. [DOI] [PubMed] [Google Scholar]
- 34.Creed E. Proc R Soc Lond B. 1975;190:135. [Google Scholar]
- 35.Clarke B, Murray J. Heredity. 1962;17:445. [Google Scholar]
- 36.Stephan W, Wiehe T, Lenz M. Theor Popul Biol. 1992;41:237. [Google Scholar]
- 37.Przeworski M. Genetics. 2003;164:1667. doi: 10.1093/genetics/164.4.1667. [DOI] [PMC free article] [PubMed] [Google Scholar]
- 38.Przeworski M, Coop G, Wall J. Evolution. 2005;59:2312. [PubMed] [Google Scholar]
- 39.Feder JL, et al. Proc Natl Acad Sci USA. 2003;100:10314. doi: 10.1073/pnas.1730757100. [DOI] [PMC free article] [PubMed] [Google Scholar]
- 40.Colosimo P, et al. Science. 2005;307:1928. doi: 10.1126/science.1107239. [DOI] [PubMed] [Google Scholar]
- 41.Barrett R, Schluter D. Trends Ecol Evol. 2007;23:38. doi: 10.1016/j.tree.2007.09.008. [DOI] [PubMed] [Google Scholar]
Associated Data
This section collects any data citations, data availability statements, or supplementary materials included in this article.