

Abstract
The study examined the timing of modulation of activator protein 1(AP-1):DNA binding and production of AP-1 constituent proteins by ultraviolet B (UVB) radiation and effect of dietary energy restriction [DER, 40% calorie reduction from fat and carbohydrate compared to control ad-libitum (AL) diet] in SKH-1 mouse epidermis. AP-1:DNA binding by electromobility shift assay (EMSA) was increased in a biphasic manner after treatment with a tumor promoting suberythemal dose (750mJ/cm2) of UVB light (311-313nm) with peaks at 3 and 18 hours post irradiation. DER overall reduced AP-1:DNA binding in mock-treated and UVB treated skin at 3 and 18 hours after UVB treatment. The timing of modulation of production of AP-1 constituent proteins by western blot analysis was examined at 0hr (mock treatment), 3hr, 9hr, 18hr, and 24hr. We found that c-jun (9 hr), jun-B (9 and 18hrs), phosphorylated c-jun (3hr), and fra-1 (18hr) protein levels were increased after UVB treatment compared to mock controls. In a follow-up diet experiment, animals were placed on DER or AL diet for 10-12 weeks and treated with UVB as before. DER was found to completely block the UVB induced increase in phosphorylated c-jun protein levels and decrease in fra-2 protein levels at 18hr. In addition, DER enhanced UVB-induced increase in jun-B levels and lowered basal levels of c-fos seen 18 hours after UVB. These data suggest that DER may be able to assist in the prevention of UVB induced skin carcinogenesis by modulating AP-1:DNA binding and AP-1 constituent protein levels.
Keywords: UV light, Activator Protein 1, Dietary energy restriction, Mouse, skin
Introduction
Skin cancer incidence is increasing in the U.S. and around the world [1;2]. The Centers for Disease Control (CDC) predicts that more than 1 million new cases of skin cancer will be diagnosed in the United States this year alone. As this disturbing trend increases, it is apparent that more information is needed on the mechanism of ultraviolet (UV) induced carcinogenesis and strategies for prevention must be devised. Previous studies using cell culture and animal models have suggested that the nuclear transcription factor activator protein 1 (AP-1) may play an important role in the development of skin cancer [3-5]. AP-1 is important as a transcription factor because it regulates a number of genes important for cell growth and tissue remodeling, including cyclin D1, type 1 collagenase, and several matrix metalloproteinases (MMP’s). Experiments using the JB6 cell model have demonstrated that AP-1 activation is necessary for promotion of these cells [3;6]. Cell culture models have also revealed that expression of a transcriptionally inactive form of c-jun in cells inhibits AP-1 transactivation and results in decreased anchorage independent growth [7;8]. Studies in mice that express this same transcriptionally inactive form of c-jun have shown that 12-O-tetradecanoylphorbol 13-acetate (TPA) induced AP-1 activation is inhibited. This inhibition is accompanied by decreased papilloma incidence [9]. These studies documented that AP-1 transactivation was necessary for the growth of chemically induced skin tumors.
Previous studies in our laboratory have shown that dietary energy restriction (DER, a 40% reduction in the number of calories consumed) can inhibit the activation of AP-1 by TPA and decrease papilloma and carcinoma formation [4;10;11]. AP-1 has been shown to be transcriptionally active as a jun family homodimer or a jun/fos heterodimer [12;13]. It has been shown that the constituents of the dimer may lend differential activating ability to the AP-1 transcription factor in multiple tissues [14;15]. Because of this data and the fact that UV light has been implicated in human skin cancer, we hypothesized that DER may inhibit cancer formation by modulating the ability of UVB to alter AP-1:DNA binding and change the levels of the jun and fos family proteins in the epidermis of SKH-1 hairless, immunocompetent mice. In addition, it was hypothesized that DER may be able to increase the basal levels of potential negative growth regulating AP-1 constituent proteins (jun B, fra-2, jun D) and decrease basal levels of potential positive growth regulating AP-1 constituent proteins (c-jun, c-fos). Changes in AP-1 constituent protein levels were measured by western blot. Effects of DER on AP-1:DNA binding were measured by electrophoretic mobility shift assay. We first determined a 32 hour time-course of AP-1:DNA binding and 24 hour time course of protein level changes following UVB treatment. Then the effect of DER on AP-1:DNA binding and the levels of AP-1 constituent protein were assessed at 3 and 18 hours in UVB and mock treated animals.
Materials and Methods
Animals and Diet
Female SKH-1 mice were purchased from Charles River Labs (Wilmington, MA). The mice were housed individually in a 73°F, 40% humidity room on a 12hr light/dark cycle. Tap water was available at all times. Diets were prepared using ingredients purchased from Harlan Teklad Premier Laboratory Diets (Madison, WI) or prepared according to our specifications by Harlan Teklad Premier Laboratory Diets (Madison, WI) [16]. Diets were stored at -20°C and were used within 6 (time course) or 3 (diet studies) months of purchase. Mice in the time course studies were fed the control ad libitum (AL) diet. Animals in the diet studies were fed the AL diet for 2 weeks after arrival for an acclimatization period, after which the AL diet was continued (control) or the DER diet was administered. DER diets were formulated so DER mice received 60% of the total calories that AL animals consumed, with the removal of calories coming from a reduction in fat and carbohydrates. All micronutrients were consistent between the two diets. Mice on ad libitum diets were given fresh diet weekly and the food consumption of these animals was monitored. DER mice were fed daily an amount of diet that corresponded to 40% fewer calories than the AL mice. Animals were fed daily at 5:00 p.m.
Treatments
Six individually caged SKH-1 mice were treated with UVB by placing 6 plastic cages at a time into a custom-made UVB exposure box equipped with a ventilating fan and placed in a fume hood. Exposures of 450-500 uWatts resulted from 4 GE sunlamp bulbs for 26 min for a total dose of ∼750mJ/cm2 (ie. 1uW × 60 sec = 60 mJ/cm2) were confirmed with a UVX radiometer using a 302nm sensor (UVP Inc., Upland, CA). All cages were treated with the wire lids on but the diet and water bottles were removed. Mock treatment was performed by placing 6 cages at a time into the UV exposure box for 26 min without turning on the UVB bulbs. Diets and water were returned to the cages. At the indicated times after UVB exposure, animals were killed by cervical dislocation and the skins were excised and the fat layer scraped off for isolation of nuclear extracts and whole cell lysates.
Isolation of Nuclear Proteins
Nuclear proteins were isolated from the epidermal tissue of mice that had been treated with 750 mJ/cm2 UVB or mock treated as previously described [4]. Briefly, the dorsal skin was excised, subcutaneous fat was removed, and the skin was placed in Hank’s balanced salt solution containing 0.08% EDTA (HBSSE, 5.33mM KCl, 0.336mM Na2HPO4, 0.441mM KH2PO4, 4.2mM NaHCO3, 138mM NaCl, 5.6mM D-glucose (Dextrose) and 2.15mM EDTA). After removing the dermal cell layers with 0.25% trypsin HBSSE, the epidermal cells were collected by scraping with a scalpel. The cells were washed in PBS and swollen in a hypotonic buffer (10mM HEPES, 1.5mM MgCl2, 10mM KCl, 0.5mM phenylmethylsulfonyl fluoride (PMSF) & 0.5mM DTT) and homogenized with a Dounce tissue grinder. The nuclei were spun in a microcentrifuge to form a pellet and resuspended in nuclear protein buffer (20mM HEPES 25% glycerol, 0.42M NaCl, 0.2 mM EDTA, 0.5mM DTT, 0.5mM PMSF) and centrifuged again. Nuclear proteins from the supernatant were quantified using the Coomassie Plus-200 assay (Pierce Chemical Company, Rockford, IL).
Electrophoretic Mobility Shift Assay (EMSA)
AP-1:DNA binding and the proteins comprising the active AP-1 complex were examined using an EMSA method modified from one previously described [4]. Binding reactions, consisting of approximately 150,000 cpm of 32P-radiolabeled AP-1 consensus sequence, 0.5ug poly(dIdC) and 15μg nuclear protein from a single mouse, were incubated at room temperature for 10 min and loaded onto a pre-run 5% non-denaturing polyacrylamide gel, electrophoresed and the resulting gel was dried and exposed to a phosphoscreen overnight prior to detection by a Molecular Dynamics Phosphorimager (Sunnyvale, CA) in phosphor mode and quantitated using ImageQuant software.
Collection of Epidermal Whole Cell Lysates
Epidermal whole cell lysates were collected from SKH-1 mouse dorsal skin that had been treated with 750mJ/cm2 UVB light or mock treated. Samples were collected by excising the dorsal skin and removing the subcutaneous fat layer. The skin was then placed in liquid nitrogen and the epidermis was removed by scraping with a single edge razor blade. Scrapings were then placed in lysis buffer and homogenized. Samples were centrifuged and supernatants collected. A more detailed description was published previously [17].
Western Blot Analysis
The protein concentration in each lysate was determined using the bicinchoninic acid and copper sulfate protein assay (Sigma, St. Louis, MO). For the western blot separation, an equal amount of protein from each lysate (from 25-100μg, depending on the protein) was diluted with 2X Laemmli sample buffer (125mM Tris HCl pH 6.8, 4% sodium dodecyl sulfate, 20% glycerol, 2% β-mercaptoethanol and 0.001% bromophenol blue) and denatured in a steam bath for 3-5 min. Separation of the AP-1 constituent proteins was carried out on a discontinuous (4% stacking, 10% resolving) sodium dodecyl sulfate-polyacrylamide (30% acrylamide/bis solution, BioRad, Hercules, CA) gel, followed by transfer to a PVDF membrane (BioRad) at 80-100V for 3 hours. For c-jun, jun b, jun d, fra-1, fra-2 and phosphorylated c-jun (p-c-jun), rabbit polyclonal antibodies (Santa Cruz Biotechnology, Santa Cruz, CA) were diluted 1:200 with 5% non-fat dry milk in TBST (20mM Tris, 137mM sodium chloride, 0.1% Tween-20). P-c-jun is c-jun that has been phosphorylated at Ser 63 and/or Ser 73. C-fos rabbit polyclonal antibody (Oncogene, Cambridge, MA) was also used at 1:200 dilution. The secondary antibody (goat, anti-rabbit IgG, HRP conjugated, Santa Cruz Biotechnology, Santa Cruz, CA) was diluted 1:1000. Detection was accomplished using ECLPlus® reagent (Amersham Biosciences, Piscataway, NJ) and the Storm 840 Molecular Dynamics imager in chemiluminescence mode. Bands were quantified using ImageQuant software (Molecular Dynamics). Specificity was verified using commercially available positive controls known to contain the protein of interest for each protein (Santa Cruz Biotechnology, Santa Cruz, CA). Protein levels in different gels were normalized by using a repeat control, known to contain the protein of interest, in each gel. Experiments were conducted to verify that values fell within the linear range of protein concentration for the amount of each antibody used.
Statistics
Changes in body weight over time were analyzed by one-way analysis of variance (ANOVA) and differences between mean values were examined by t-test. In the time course experiments, differences between times (mock treatment or UVB treatment followed by sacrifice at the times after treatment) for each endpoint were analyzed by one-way ANOVA. If the ANOVA analysis showed that the means were significantly different, Dunnett’s test was used to determine differences between various time periods. For AP-1:DNA binding, the natural logarithm of each response was normalized from two experiments by dividing by the mean response at time zero and analyzed by the GLM procedure in SAS. In instances where Bartlett’s test showed that the variances between time points were significantly different and thus the data could not be analyzed by ANOVA, the Kruskal-Wallis test and Dunnett’s multiple comparison tests were used in place of one-way ANOVA and Dunnett’s test, respectively. In the diet experiment, two-way ANOVA was used to examine interactions between treatment and diet and to test for differences due to diet and UVB treatment. Differences between group means (or natural logarithms of means for AP-1:DNA binding results) were analyzed by t-test. Statistical significance for all measurements was set at P<0.05. All ANOVA tests were done using GraphPad Prizm software (San Diego, CA).
Results
DER experiment body weights
Body weights of both ad libitum (AL) fed and dietary energy restricted (DER) SKH-1 mice are shown in Figure 1. Both groups gained weight during the two-week adjustment period (-2 to 0 weeks, data not shown). The AL animals continued to gain weight throughout the end of the study (increase of 21% from week 0 to week 12 of the experiment). DER animals rapidly lost weight for the first 3 weeks of energy restriction (weeks 0-3 of the experiment). From week 0 to week 12, DER animals lost 18% of their body weight. At the end of the study, mice on the DER diet weighed significantly less than those in the AL diet group (41% difference, P<0.001).
Figure 1. Body weights of ad libitum and dietary energy restricted mice.

Values represent the mean ± SEM of 22 AL-fed animals and 16 DER animals and values without visible error bars had error bars smaller than the symbols. Week 0 corresponds to 8 weeks of age. Animals in the DER group were placed on dietary energy restriction at week 0. Analysis of body weight by single factor ANOVA revealed a statistically significant difference between AL and DER fed animals (P<0.0001). T-test showed the mean body weights were different at week 1 of the experiment and remained that way until the end of the experiment (P<0.0001). AL (■) and DER (◘).
Timing of AP-1:DNA binding changes following UVB treatment
Figure 2A shows EMSA images in support of the specificity of the shifted band for AP-1. Figure 2B provides an example image of an EMSA gel showing AP-1:DNA binding in nuclear extracts from SKH-1 mouse dorsal skins treated with UVB. Figure 2C provides the quantitated values from the series of studies where the AP-1:DNA binding was increased bi-modally following treatment with UVB. There was a significant increase over mock treatment (0hr) at 3 hours after UVB treatment (P<0.0001). At 9 hours after the UVB treatment there was no difference from the mock treated control group. However, there was a significant increase in AP-1:DNA binding at 12 hours (P<0.002), 18 hours (P<0.0001), and 24 hours (P<0.001) after treatment with UVB. By 32 hours, AP-1:DNA binding appeared to return to a level near that of the untreated control (Figure 2C).
Figure 2. Changes in AP-1:DNA binding over a 32 hour period following UVB treatment.

A, Electrophoretic mobility shift assay (EMSA) image of AP-1 competition experiment showing that the AP-1 shifted band (arrow) is AP-1 specific because it is competed out by excesses of unlabeled AP-1 consensus oligonucleotide (lane 1 compared to lanes 4 or 5) and that decreasing amounts of nuclear extract (NE) from mouse skin treated with UVB decreases the AP-1 shifted band (lanes 1-3). B, Example image of an EMSA gel showing AP-1:DNA binding in nuclear extracts from SKH-1 mouse dorsal skins treated with 750mJ/cm2 UVB or mock treated and harvested after the indicated times (lanes 7-13). Each lane contains about 100,000 cpm of labeled AP-1 oligo, 0.5 ug poly(dI-dC) and 15ug mouse epidermal NE from one mouse per lane. B. Values, ± SEM for 8-16 observations per group, represent the fold induction of AP-1:DNA binding obtained by dividing each individual measurement of radioactivity of the AP-1 shifted band at each time from one mouse by the mean measurement at time 0 for two experiments.. Each measurement of radioactivity (in arbitrary units) was normalized for gel to gel variation using a factor derived from a control mouse sample loaded onto each of 3-4 gels. Time points that do not share common letters are significantly different (P < 0.05) by SAS software using the GLM method.
Effect of DER on AP-1:DNA binding
DER inhibited AP-1:DNA binding in both UVB treated and mock treated groups (Figure 3a and 3b). Analysis by two-way ANOVA revealed that there was a statistically significant difference due to the diet at 3 hours (p<0.03) and at 18 hours (P<0.002). There was no difference due to UVB treatment and there was no interaction between diet and treatment. T-test analysis showed that there were no differences between individual treatment groups at 3 hours or the mock mice at 18 hours.
Figure 3a and 3b. Effect of UVB treatment and DER on AP-1:DNA binding 3 (A) and 18 (B) hours after treatment with UVB.

Values represent the mean measurement of radioactivity ± SE of 8-11 mice/group normalized as noted in Fig 2. Analysis by two-way ANOVA of the mean of the natural logarithms of radioactivity for the experimental groups showed a significant difference due to diet for the 3 h UVB groups (P < 0.03) and 18 h UVB groups (P < 0.002). Posthoc Tukey-Kramer t-test analysis of the least squares from the two-way ANOVA showed a difference between AL/UVB and DER/UVB groups in the 18h UVB experiment (a>b, P < 0.05).
Timing of UVB induction of AP-1 constituent protein levels
The objective of this experiment was to determine the impact of UVB treatment on the constituents of the AP-1 transcription factor from 0-24 hours following UVB treatment. Results from typical western blots were published previously [18]. The results for 8-11 observations per time point of all AP-1 proteins tested are shown graphically in Figure 4 panels A and B. One-way ANOVA showed a difference in mean protein levels between mock treated (t = 0) and the indicated times for c-jun (t = 9, P<0.03) and jun B (t = 9,18, P<0.004). Kruskal-Wallis analysis revealed differences in mean protein levels between times in phosphorylated c-jun (p-c-jun, t = 3, P<0.03) and fra-1 (t = 18, P<0.03). Dunnett’s t-test showed that after treatment with UVB, c-jun increased maximally by 85.2% (P<0.001) at 9 hours after treatment when compared with the mock treated group (Figure 4A). The level of jun-B was significantly increased by 110% (P<0.05) at 9 hours and 122% (P<0.001) at 18 hours after treatment (Figure 4A). The amount of p-c-jun in the cells also increased following UVB treatment, with a significant elevation at 3 hours (154% P<0.05) and a non-significant increase 9 hours (166%) after the treatment with UVB (Figure. 4A). Dunnett’s test also showed a significant increase in fra-1 (103%, P<0.05) due to UVB treatment at 18 hours (Figure 4B). There was no significant effect on the levels of jun D (Figure 4A), c-fos (Figure 4B), or fra-2 (Figure 4B) after treatment with UVB.
Figure 4A and 4B. Timing of modulation of AP-1 constituent proteins by UVB.
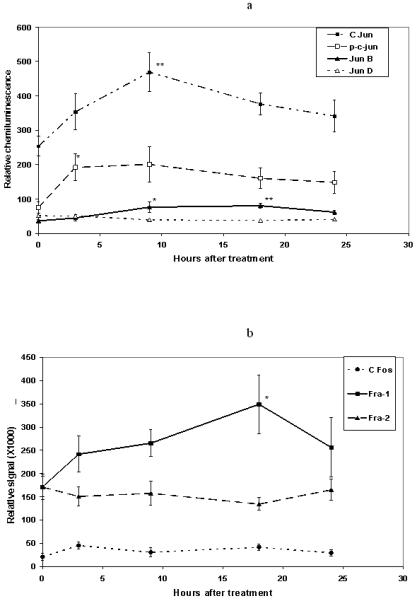
Each data point represents data from 8-11 animals. Symbols show the mean ± SEM and values without visible error bars had error bars smaller than the symbols. Asterisks signify significant difference from mock (0 hr) treatment as analyzed by single factor ANOVA followed by Dunnett’s test for each individual protein. In the case of unequal variances, the Kruskal-Wallis test was used in place of the single factor ANOVA and Dunn’s multiple comparison test was used in place of Dunnett’s test. *=P<0.05, **=P<0.001.
Modulation of UVB effect on AP-1 constituent proteins by DER
Determination of protein abundance in control and DER mouse epidermis at 3 and 18 hours after UVB treatment was performed using western blot analysis. The results for Jun proteins are shown in Figure 5a through 6h and for Fos proteins in Figures 6a through 6f. A representative c-fos blot from these experiments is provided in Figure 7. In considering Jun proteins, modest effects were observed by ANOVA due to diet in p-c-Jun (P<0.08) and UVB by diet interaction (P<0.07) at 18 hours. Effects due to UVB were observed in c-Jun (P<0.03) and Jun B (P<0.001) at 18 hours. An interaction between UVB treatment and diet was observed in Jun B at 18 hours (P<0.02). T-test analysis of the differences between group means of jun B protein levels by t-test revealed significant elevation in the DER/UVB group compared with the DER/Mock group (P<0.0001), and to the AL/Mock (P<0.0003) at 18 hours. Jun B did not differ between treatments at 3 hours and Jun D did not differ by treatment at either time point. Analysis of c-jun showed the AL/Mock group mean was less than the AL/UVB (P<0.03) and DER/UVB (P<0.05) groups at 18 hours. A similar trend was observed at 3 hours but the values were not significantly different. Analysis by t-test on p-c-jun group mean protein levels at 18 hours revealed an elevation in the AL/UVB group compared to the AL/Mock group (P<0.04).
Figure 5a - 5h.
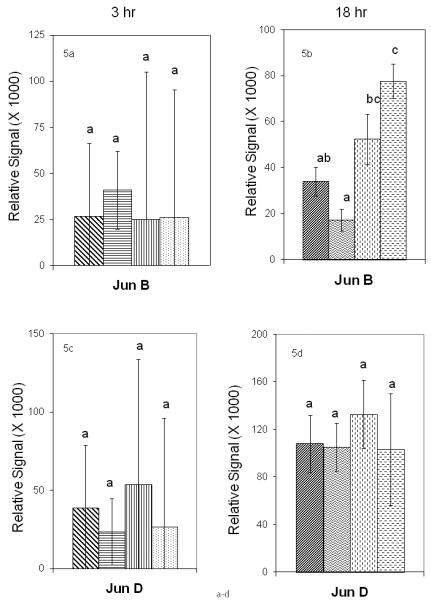
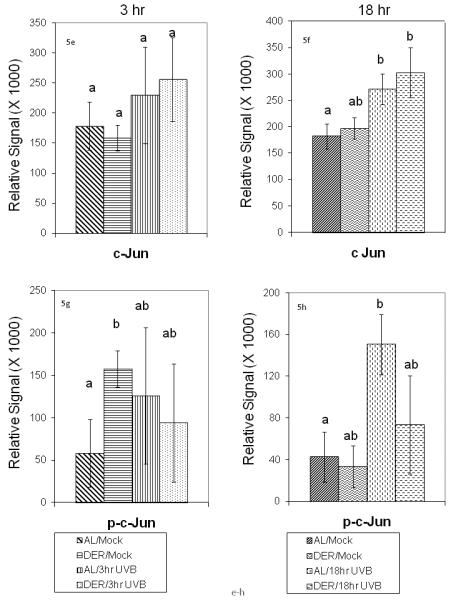
Effect of dietary energy restriction on UVB induced modulation of AP-1 jun constituent proteins at 3 and 18 hours after UVB treatment. Values represent the mean ± SE, N=8-11 mice for each data point). Differences between treatment groups for each protein were measured by two-way ANOVA. If two-way ANOVA showed a significant difference, individual means were analyzed by t-test. Results of t-tests are indicated by a<b and values with 2 letters are not different from values with either of the letters (P<0.05). Different proteins were not compared to one another.
Figure 6a - 6f.

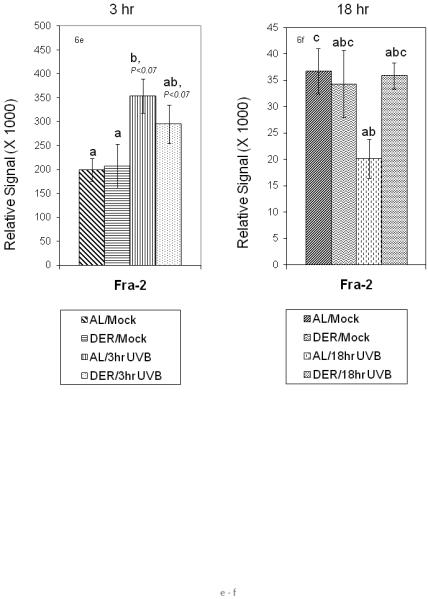
Effect of dietary energy restriction on UVB induced modulation of AP-1 fos constituent proteins at 3 and 18 hours after UVB treatment. Values represent the mean ± SE, N=8-11 mice for each data point). Differences between treatment groups for each protein were measured by two-way ANOVA. If two-way ANOVA showed a significant difference, individual means were analyzed by t-test. Results of t-tests are indicated by a<b and values with 2 letters are not different from values with either of the letters (P<0.05 except where indicated). Different proteins were not compared to one another.
Figure 7.
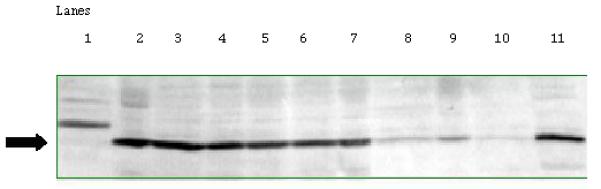
Representative western blot showing the effect of dietary energy restriction on UVB induced modulation of c-fos protein at 18 hours after UVB treatment. Lanes contained 100 mg protein and in lane 1: TPA treated mouse skin from prior experiment as a control; lanes 2-10 epidermal proteins from treatment groups: lane 2: DER/UVB; lanes 3-5: AL/Mock; lanes 6-7: AL/UVB; lanes 8-10: DER/Mock; lane 11: c-fos positive control. Methods were described in the Materials and Methods section.
Differences by ANOVA due to UVB treatment were observed in Fra-2 and modestly in Fra-1 (P<0.07) at 3 hours and in c-fos (P<0.02) and Fra-1 (P<0.01) at 18 hours. Differences due to diet were observed in c-fos at 18 hours (P<0.01) and for the interaction between UVB treatment and diet in Fra-2 at 18 hours (P<0.05). Analysis of group means by t-test at 18 hours showed that the mean c-fos value for the AL/Mock (P<0.001), AL/UVB (P<0.003) and DER/UVB (P<0.04) groups were each significantly higher than the DER/Mock mean. Also at 18 hours Fra-1 protein levels in the AL/UVB (P<0.04) group and the DER/UVB group (P<0.04) were higher than in the DER/Mock group. At 3 hours, t-test analysis suggested that Fra-2 was marginally elevated in the AL/UVB group in comparison with the AL/Mock or DER/Mock groups (P<0.07). At 18 hours group means of Fra-2 protein levels in the AL/Mock group were elevated compared with the AL/UVB (P<0.009).
Discussion
UVB has been shown to be a complete carcinogen in albino mice [19] and has been implicated in the formation of human skin cancer [20]. Because the transcription factor AP-1 has been implicated in the process of skin carcinogenesis [9], we examined the effect UVB treatment on the activator protein 1 (AP-1) transcription factor, looking at both AP-1:DNA binding and changes in the levels of the AP-1 constituent proteins. Also, dietary energy restriction (DER) has previously been shown to be an effective inhibitor of chemically induced skin carcinogenesis in animal models [10;11]. The current study used AL (control) and DER diets fed to SKH-1 hairless mice to better understand the mechanisms by which DER might impact the formation of UVB induced skin cancer.
Treatment with UVB increased AP-1:DNA binding 3, 12, 18, and 24 hours after irradiation of SKH-1 epidermis compared to mock treated AL-fed control animals at 0 hours. Other work has also shown that AP-1:DNA binding was increased following UVB treatment in both animal and cell culture models [21-22]. The biphasic time course of UVB induced AP-1:DNA binding may have been, at least in part, a consequence of the changes in constituent proteins observed below, including the early increase in p-c-jun contributing to the first phase and fra-1 and jun-B alternations contributing in the second phase. In the diet experiment, UVB did not significantly increase AP-1:DNA binding in the epidermis of UVB irradiated mice in comparison to mock treated mice at either 3 or 18 hours. However, DER decreased basal AP-1:DNA binding, in both mock treated and UVB treated skin, possibly anticipating a suppression of AP-1 transcription by DER. However, it is important to note that AP-1:DNA binding as measured by EMSA does not necessarily predict AP-1 mediated transactivation because there are constituent proteins that serve activating and/or inhibitory roles in AP-1 transactivation as noted below.
The amount of c-jun, jun B, and fra-1 proteins increased at 9 and 18 hours following UVB treatment in the epidermis of AL-fed SKH-1 mice in the time course study and at 18 hours after UVB in the AL mice in the diet experiment. Previous studies with these proteins have shown that UV can increase the level of c-jun, in cell culture models (HeLa cells [23], keratinocytes [24]), animal models (SENCAR mice [25]), and human skin [26]. Studies examining jun B have revealed that UV can increase the levels of this protein in HaCaT keratinocytes [27], fibroblasts [28], and human skin [27]. Fra-1 protein levels can be either increased [29] or decreased [30] by UV radiation, depending on the wavelengths of light used and the cell models studied. The level of p-c-jun in the epidermis was increased at 3 hours after UVB treatment in the time-course experiment and it remained elevated throughout the 24 hour experiment. In the diet study, the level of p-c-jun was significantly increased in the AL-fed mice 18 hours after UVB treatment compared to mock control animals.
Although UVB treatment did not significantly increase the levels of c-fos in the time-course study, there was an overall significant increase in the level of c-fos protein observed in the diet experiment at 18 hours in AL-fed or DER mice. Examination of the literature showed that some studies have revealed increases in the level of c-fos following UVB treatment (HaCaT keratinocytes [27], SENCAR mice [25]), while others have seen no effect on c-fos in A431 cells [30] or hairless mice [31] following UVB treatment.
UVB treatment has no effect on the level of jun D present in the epidermis, neither in the time-course study nor in the diet study. This was in agreement with what has been reported in the literature where studies in keratinocytes revealed that Jun D was constitutively expressed and that the levels of Jun D proteins were not altered [32].
There were no significant changes observed in fra-2 following UVB treatment during the time-course study. However, in the diet study, UVB modestly increased Fra-2 at 2 hours and decreased the level of fra-2 present in the epidermis in AL-fed animals at 18 hours after the UVB treatment. There was no observed effect due to UVB treatment in DER mice. A study by Ariizumi using UVB-treated A431 cells showed a similar decrease in fra-2 [30]. Previous work showed that epidermis of Sencar mice treated with TPA experienced significantly increased amount of c-jun and fra-1, with maxima at four and six hours, respectively, after application of TPA. In addition, increases were seen in c-fos at three, four, and six hours post treatment. Jun B was increased at four hours after treatment and stayed elevated through 24 hours [18].
The increased levels of c-jun and fra-1 in the epidermis of UVB treated mice did not differ in AL and DER mice. The level of jun B in the epidermis of UVB treated animals was increased at 18 hours in both AL (non-significantly by 54%) and DER (significantly by 354%) mice, thus, DER enhanced the increase in jun B seen when the mice were treated with UVB. If Jun B plays a protective role as a negative regulator of cell proliferation as previously suggested [28;33] then this observation would predict that DER may inhibit UVB induced skin cancer, at least in part, through its maintenance of jun B protein. At 3 hours fra-2 increased modestly in both diet groups but, at 18 hr, UVB treatment led to a decrease in the amount of fra-2 protein in AL mice, but this decrease was not seen in DER mice. Assuming that DER would inhibit UVB induced skin carcinogenesis this observation provides additional evidence for the theory that fra-2 may be protective against skin cancer formation [34-36]. The basal amount of c-fos in the epidermis of DER mice was reduced at 18 hours. Although the level of c-fos present in the epidermis was not statistically different between the two diets 18 hr following UVB treatment, the amount present in the DER mice was 51% less than the amount in the AL group. This may be important because changes in the basal levels of c-fos presumably reflect changes in constitutive pathways that maintain this basal protein and changes in c-fos may have unknown effects on other parameters measured. For example, as well as being induced by p38 kinase, c-fos has been shown to be a substrate for p38, and after p38 phosphorylates c-fos, there is a resulting increase in AP-1 transcription [37]. Thus, reduced c-fos present in the cell prior to UVB treatment may result in a change in transcription of products important in the cellular response to UVB.
In AL mice treated with UVB there was an increase of 158% in the amount of phosphorylated c-jun in the epidermis at 18 hours however, the increase in p-c-jun seen in the AL group following UVB treatment was not seen in the DER group at 18 hours. It appeared that DER may inhibit the ability of UVB to increase the amount of phosphorylated c-jun in the epidermis. This may prove to be an important discovery as it suggests that DER has the ability to alter phosphorylation status of the AP-1 constituent proteins.
While sodium vanadate and sodium fluoride in trademarked mixes are commonly included in lysis buffers to inhibit cellular phosphatase activity, studies in our lab with NIH3T3 cells and epidermis from CF-1 mice revealed that there was no difference in AP1:DNA binding or in the level of phosphorylated c jun collected from lysis buffer with or without the addition of sodium vanadate and sodium fluoride under our conditions. Therefore, in order to avoid unintended effects of these sodium salts we did not add them to our lysis buffer.
The results with phosphorylated c-jun may be explained, in part, by looking at the upstream kinases responsible for the phosphorylation. Previous work has shown that DER inhibited 12-O-tetradecanoylphorbol-13-acetate (TPA) induced ERK activity in vivo, but DER did not alter JNK or p38 kinase in control or TPA treated mice or on basal ERK activity [16]. However, TPA did not induce expression of JNK or p38 in the SENCAR mouse epidermis studied in these experiments. In contrast, UVB has been shown to induce the JNK and p38 kinase pathways, in addition to ERK [38-40]. Further investigation of the phosphorylation status of the AP-1 constituent proteins may yield important information on the role of DER in the inhibition of skin carcinogenesis. The possible mitigating role that DER may play on JNK and p38 due to their important role in UV induced damage needs further investigation. Since the studies presented here predict that DER may inhibit UVB induced skin carcinogenesis through effects on Jun B, Fra-2 and c-jun phosphorylation, tumor studies should be conducted to validate this possibility.
Acknowledgements
This work was supported by National Institute of Health grant # CA77451 and American Institute of Cancer Research grant # 03B040-REV.
Definitions
- ANOVA
analysis of variance
- AL
ad libitum
- AP1
activator protein 1
- CDC
Centers for Disease Control
- DER
dietary energy restriction
- DNA
deoxyribonucleic acid
- EMSA
electromobility shift assay
- JB6
epidermal cell model
- MMP
metalloproteinases
- PBS
Phosphate buffered Saline
- TPA
12-O-tetradecanoylphorbol 13-acetate
- UVB
ultraviolet B
Reference List
- 1.de VE, van de Poll-Franse LV, Louwman WJ, de Gruijl FR, Coebergh JW. Predictions of skin cancer incidence in the Netherlands up to 2015. Br.J.Dermatol. 2005;152:481–488. doi: 10.1111/j.1365-2133.2005.06386.x. [DOI] [PubMed] [Google Scholar]
- 2.Athas WF, Hunt WC, Key CR. Changes in nonmelanoma skin cancer incidence between 1977-1978 and 1998-1999 in Northcentral New Mexico. Cancer Epidemiol.Biomarkers Prev. 2003;12:1105–1108. [PubMed] [Google Scholar]
- 3.Bernstein LR, Colburn NH. AP1/jun function is differentially induced in promotion-sensitive and resistant JB6 cells. Science. 1989;244:566–569. doi: 10.1126/science.2541502. [DOI] [PubMed] [Google Scholar]
- 4.Przybyszewski J, Yaktine AL, Duysen E, Blackwood D, Wang W, Au A, Birt DF. Inhibition of phorbol ester-induced AP-1-DNA binding, c-Jun protein and c-jun mRNA by dietary energy restriction is reversed by adrenalectomy in SENCAR mouse epidermis. Carcinogenesis. 2001;22:1421–1427. doi: 10.1093/carcin/22.9.1421. [DOI] [PubMed] [Google Scholar]
- 5.Domann FE, Jr., Levy JP, Finch JS, Bowden GT. Constitutive AP-1 DNA binding and transactivating ability of malignant but not benign mouse epidermal cells. Mol.Carcinog. 1994;9:61–66. doi: 10.1002/mc.2940090202. [DOI] [PubMed] [Google Scholar]
- 6.Bernstein LR, Ben-Ari ET, Simek SL, Colburn NH. Gene regulation and genetic susceptibility to neoplastic transformation: AP-1 and p80 expression in JB6 cells. Environ.Health Perspect. 1991;93:111–119. doi: 10.1289/ehp.9193111. [DOI] [PMC free article] [PubMed] [Google Scholar]
- 7.Li JJ, Rhim JS, Schlegel R, Vousden KH, Colburn NH. Expression of dominant negative Jun inhibits elevated AP-1 and NF-kappaB transactivation and suppresses anchorage independent growth of HPV immortalized human keratinocytes. Oncogene. 1998;16:2711–2721. doi: 10.1038/sj.onc.1201798. [DOI] [PubMed] [Google Scholar]
- 8.Li JJ, Cao Y, Young MR, Colburn NH. Induced expression of dominant-negative c-jun downregulates NFkappaB and AP-1 target genes and suppresses tumor phenotype in human keratinocytes. Mol.Carcinog. 2000;29:159–169. doi: 10.1002/1098-2744(200011)29:3<159::aid-mc5>3.0.co;2-w. [DOI] [PubMed] [Google Scholar]
- 9.Young MR, Li JJ, Rincon M, Flavell RA, Sathyanarayana BK, Hunziker R, Colburn N. Transgenic mice demonstrate AP-1 (activator protein-1) transactivation is required for tumor promotion. Proc.Natl.Acad.Sci.U.S.A. 1999;96:9827–9832. doi: 10.1073/pnas.96.17.9827. [DOI] [PMC free article] [PubMed] [Google Scholar]
- 10.Birt DF, Kris ES, Choe M, Pelling JC. Dietary energy and fat effects on tumor promotion. Cancer Res. 1992;52:2035s–2039s. [PubMed] [Google Scholar]
- 11.Birt DF, Pinch HJ, Barnett T, Phan A, Dimitroff K. Inhibition of skin tumor promotion by restriction of fat and carbohydrate calories in SENCAR mice. Cancer Res. 1993;53:27–31. [PubMed] [Google Scholar]
- 12.Angel P, Allegretto EA, Okino ST, Hattori K, Boyle WJ, Hunter T, Karin M. Oncogene jun encodes a sequence-specific trans-activator similar to AP-1. Nature. 1988;332:166–171. doi: 10.1038/332166a0. [DOI] [PubMed] [Google Scholar]
- 13.Hirai S, Bourachot B, Yaniv M. Both Jun and Fos contribute to transcription activation by the heterodimer. Oncogene. 1990;5:39–46. [PubMed] [Google Scholar]
- 14.Rutberg SE, Saez E, Lo S, Jang SI, Markova N, Spiegelman BM, Yuspa SH. Opposing activities of c-Fos and Fra-2 on AP-1 regulated transcriptional activity in mouse keratinocytes induced to differentiate by calcium and phorbol esters. Oncogene. 1997;15:1337–1346. doi: 10.1038/sj.onc.1201293. [DOI] [PubMed] [Google Scholar]
- 15.Yang S, Meyskens FL., Jr. Alterations in activating protein 1 composition correlate with phenotypic differentiation changes induced by resveratrol in human melanoma. Mol.Pharmacol. 2005;67:298–308. doi: 10.1124/mol.104.006023. [DOI] [PubMed] [Google Scholar]
- 16.Liu Y, Duysen E, Yaktine AL, Au A, Wang W, Birt DF. Dietary energy restriction inhibits ERK but not JNK or p38 activity in the epidermis of SENCAR mice. Carcinogenesis. 2001;22:607–612. doi: 10.1093/carcin/22.4.607. [DOI] [PubMed] [Google Scholar]
- 17.Yaktine AL, Vaughn R, Blackwood D, Duysen E, Birt DF. Dietary energy restriction in the SENCAR mouse: elevation of glucocorticoid hormone levels but no change in distribution of glucocorticoid receptor in epidermal cells. Mol.Carcinog. 1998;21:62–69. [PubMed] [Google Scholar]
- 18.Przybyszewski J, Wang W, Au A, Perry C, Megan Guetzko M, Koehler K, Birt DF. Submitted and under revision Molecular Carcinogenesis. 2008. Potential roles for AP-1 constituent proteins in dietary energy restriction and corticosterone responses to 12-O-tetradecanoylphorbol-13-acetate in Sencar mouse epidermis. [DOI] [PubMed] [Google Scholar]
- 19.Freeman RG. Action spectrum for ultraviolet carcinogenesis. Natl.Cancer Inst.Monogr. 1978:27–29. [PubMed] [Google Scholar]
- 20.Tornaletti S, Rozek D, Pfeifer GP. The distribution of UV photoproducts along the human p53 gene and its relation to mutations in skin cancer. Oncogene. 1993;8:2051–2057. [PubMed] [Google Scholar]
- 21.Cooper SJ, MacGowan J, Ranger-Moore J, Young MR, Colburn NH, Bowden GT. Expression of dominant negative c-jun inhibits ultraviolet B-induced squamous cell carcinoma number and size in an SKH-1 hairless mouse model. Mol.Cancer Res. 2003;1:848–854. [PubMed] [Google Scholar]
- 22.Chen W, Borchers AH, Dong Z, Powell MB, Bowden GT. UVB irradiation-induced activator protein-1 activation correlates with increased c-fos gene expression in a human keratinocyte cell line. J.Biol.Chem. 1998;273:32176–32181. doi: 10.1074/jbc.273.48.32176. [DOI] [PubMed] [Google Scholar]
- 23.Devary Y, Gottlieb RA, Lau LF, Karin M. Rapid and preferential activation of the c-jun gene during the mammalian UV response. Mol.Cell Biol. 1991;11:2804–2811. doi: 10.1128/mcb.11.5.2804. [DOI] [PMC free article] [PubMed] [Google Scholar]
- 24.Herrlich P, Ponta H, Rahmsdorf HJ. DNA damage-induced gene expression: signal transduction and relation to growth factor signaling. Rev.Physiol Biochem.Pharmacol. 1992;119:187–223. doi: 10.1007/3540551921_7. [DOI] [PubMed] [Google Scholar]
- 25.Wang Y, Zhang X, Lebwohl M, DeLeo V, Wei H. Inhibition of ultraviolet B (UVB)-induced c-fos and c-jun expression in vivo by a tyrosine kinase inhibitor genistein. Carcinogenesis. 1998;19:649–654. doi: 10.1093/carcin/19.4.649. [DOI] [PubMed] [Google Scholar]
- 26.Pfundt R, van Vlijmen-Willems I, Bergers M, Wingens M, Cloin W, Schalkwijk J. In situ demonstration of phosphorylated c-jun and p38 MAP kinase in epidermal keratinocytes following ultraviolet B irradiation of human skin. J.Pathol. 2001;193:248–255. doi: 10.1002/1096-9896(2000)9999:9999<::AID-PATH780>3.0.CO;2-Y. [DOI] [PubMed] [Google Scholar]
- 27.Isoherranen K, Westermarck J, Kahari VM, Jansen C, Punnonen K. Differential regulation of the AP-1 family members by UV irradiation in vitro and in vivo. Cell Signal. 1998;10:191–195. doi: 10.1016/s0898-6568(97)00100-9. [DOI] [PubMed] [Google Scholar]
- 28.Passegue E, Wagner EF. JunB suppresses cell proliferation by transcriptional activation of p16(INK4a) expression. EMBO J. 2000;19:2969–2979. doi: 10.1093/emboj/19.12.2969. [DOI] [PMC free article] [PubMed] [Google Scholar]
- 29.Silvers AL, Bowden GT. UVA irradiation-induced activation of activator protein-1 is correlated with induced expression of AP-1 family members in the human keratinocyte cell line HaCaT. Photochem.Photobiol. 2002;75:302–310. doi: 10.1562/0031-8655(2002)075<0302:uiiaoa>2.0.co;2. [DOI] [PubMed] [Google Scholar]
- 30.Ariizumi K, Bergstresser PR, Takashima A. Wavelength-specific induction of immediate early genes by ultraviolet radiation. J.Dermatol.Sci. 1996;12:147–155. doi: 10.1016/0923-1811(95)00474-2. [DOI] [PubMed] [Google Scholar]
- 31.Kligman LH, Yang S, Schwartz E. Steady-state mRNA levels of interleukin-1, integrins, cJun, and cFos in hairless mouse skin during short-term chronic UV exposure. 1999. [DOI] [PubMed] [Google Scholar]
- 32.Chen W, Borchers AH, Dong Z, Powell MB, Bowden GT. UVB irradiation-induced activator protein-1 activation correlates with increased c-fos gene expression in a human keratinocyte cell line. J.Biol.Chem. 1998;273:32176–32181. doi: 10.1074/jbc.273.48.32176. [DOI] [PubMed] [Google Scholar]
- 33.Angel P, Karin M. Specific members of the Jun protein family regulate collagenase expression in response to various extracellular stimuli. Matrix Suppl. 1992;1:156–164. [PubMed] [Google Scholar]
- 34.Rezzonico R, Loubat A, Lallemand D, Pfarr CM, Far DF, Proudfoot A, Rossi B, Ponzio G. Cyclic AMP stimulates a JunD/Fra-2 AP-1 complex and inhibits the proliferation of interleukin-6-dependent cell lines. Oncogene. 1995;11:1069–1078. [PubMed] [Google Scholar]
- 35.Rutberg SE, Saez E, Lo S, Jang SI, Markova N, Spiegelman BM, Yuspa SH. Opposing activities of c-Fos and Fra-2 on AP-1 regulated transcriptional activity in mouse keratinocytes induced to differentiate by calcium and phorbol esters. Oncogene. 1997;15:1337–1346. doi: 10.1038/sj.onc.1201293. [DOI] [PubMed] [Google Scholar]
- 36.Suzuki T, Okuno H, Yoshida T, Endo T, Nishina H, Iba H. Difference in transcriptional regulatory function between c-Fos and Fra-2. Nucleic Acids Res. 1991;19:5537–5542. doi: 10.1093/nar/19.20.5537. [DOI] [PMC free article] [PubMed] [Google Scholar]
- 37.Tanos T, Marinissen MJ, Leskow FC, Hochbaum D, Martinetto H, Gutkind JS, Coso OA. Phosphorylation of c-Fos by members of the p38 MAPK family. Role in the AP-1 response to UV light. J.Biol.Chem. 2005;280:18842–18852. doi: 10.1074/jbc.M500620200. [DOI] [PubMed] [Google Scholar]
- 38.Huang C, Ma WY, Dong Z. The extracellular-signal-regulated protein kinases (Erks) are required for UV-induced AP-1 activation in JB6 cells. Oncogene. 1999;18:2828–2835. doi: 10.1038/sj.onc.1202639. [DOI] [PubMed] [Google Scholar]
- 39.Chen W, Bowden GT. Role of p38 mitogen-activated protein kinases in ultraviolet-B irradiation-induced activator protein 1 activation in human keratinocytes. Mol.Carcinog. 2000;28:196–202. doi: 10.1002/1098-2744(200008)28:4<196::aid-mc2>3.0.co;2-c. [DOI] [PubMed] [Google Scholar]
- 40.Adler V, Pincus MR, Polotskaya A, Montano X, Friedman FK, Ronai Z. Activation of c-Jun-NH2-kinase by UV irradiation is dependent on p21ras. J.Biol.Chem. 1996;271:23304–23309. doi: 10.1074/jbc.271.38.23304. [DOI] [PubMed] [Google Scholar]