Abstract
With the Profile of Mood States (POMS), a German version of an international instrument for the assessment of mood is available. The paper introduces a new short version containing 24 items and four scales. In a study about indoor climate in 4596 office workers only a few missing values were noted. Psychometric analyses showed very good characteristics of the four scales regarding their internal consistency (Cronbach’s α) and scale fit. High floor effects indicated a limited exhaustion of the scale range. Age and gender effects of the scale scores concerned the scales “vigour” and “fatigue”. Furthermore, the scales of the POMS discriminated between groups with different self-reported disease incidences. A less beneficial characteristic of the POMS could be noted in terms of a high correlation of the scales “numbness” and “fatigue". With the tested version of the POMS, a short instrument with good psychometric properties has been presented which can be assessed in healthy as well as in health-impaired persons.
Abstract
Mit dem Profile of Mood States (POMS) liegt ein internationales Instrument zur Erfassung der psychischen Befindlichkeit in deutscher Version vor. Im Beitrag wird eine neue Kurzversion bestehend aus 24 Items und vier Skalen vorgestellt. In einer Untersuchung zum Innenraumklima an 4596 Büroangestellten wurden nur wenige fehlende Werten verzeichnet. Die psychometrische Analyse zeigte sehr gute Eigenschaften der vier Skalen hinsichtlich ihrer internen Konsistenz (Cronbach’s α) und Skalenfit. Hohe Bodeneffekte weisen auf eine nur begrenzte Ausschöpfung der Skalenspannweite hin. Alters- und Geschlechtseffekte auf die Skalenwerte betrafen nur die Skalen „Tatendrang“ und „Müdigkeit“. Darüber hinaus diskriminieren die Skalen der POMS zwischen Gruppen mit unterschiedlich stark ausgeprägten selbstberichteten Krankheitshäufigkeiten. Eine weniger günstige Eigenschaft des POMS zeigt sich dahingehend, dass die Skalen „Benommenheit“ und „Müdigkeit“ eine hohe Korrelation aufweisen. Mit der geprüften Version des Profile of Mood States wird ein kurzes Instrument mit guten psychometrischen Eigenschaften vorgestellt, das sowohl bei gesunden wie auch bei in der Befindlichkeit eingeschränkten Personen eingesetzt werden kann.
Introduction
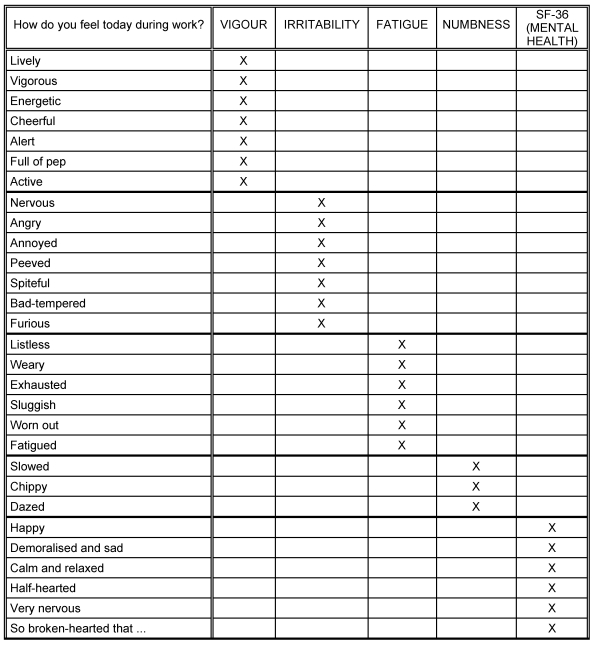
The assessment of mood is an important indicator for the evaluation of short-term intervention effects. The Profile of Mood States (POMS) is a widespread instrument which measures mood. The measure was developed in the USA [1] and is a self-report questionnaire. The POMS is mainly used in the context of clinical psychology, psychotherapy, medicine and sports science. In the clinical context it was used in the field of cardiology [2], oncology [3], neurology and HIV research [4]. Originally, the POMS included sixty five items which load on seven different scales: “depression”, “anxiety”, “fatigue”, “vigour”, “irritability”, “tension”, and “confusion”. The questions refer to the time period of the “last week including today”. The response scale is divided into five categories ranging from “not at all” to “very strong”. Biehl et al. [1], [5] translated the questionnaire into German and presented the first psychometrical analysis. The results underlined a high accordance of the German and the American version. In addition to the long version, a short form of the POMS is available. The thirty five items load on four scales (“depression/anxiety”, “fatigue”, “vigour”, “irritability”) [6]. For the development of the short form, the scales “confusion” and “tension” were omitted and the scales “anxiety” and “depression” were combined into one scale. The short version refers to the “last 24 hours” or the “last week”. The answer scale is divided in seven categories. Table 1 gives an overview of scales and items.
Table 1. Allocation of the items to the POMS scales .
Originally, the short version with 35 items was used by Bullinger et al. [7] in 143 healthy employees. The results indicated a satisfying factorial validity and internal consistency of α=.90. Nyenhuis & Yamamoto [8] used the POMS in 400 healthy adults and 170 geriatric patients. The authors reported a good concordance with the depression and anxiety instruments Beck Depression Inventory (BDI) [9] and State-Trait Anxiety Inventory (STAI) [10], respectively. The study presented here examines the psychometric properties of the German POMS short version and is part of a bigger study investigating the Sick-Building-Syndrome (SBS), the physical, biological, chemical environment variables of office buildings as well as the mood of the employees. All employees working in the included office buildings were interviewed. For those interviews a short instrument to evaluate the specific mood reductions was needed that we hypothesized to be related with the SBS. To our knowledge the POMS currently represents the only suitable instrument to appropriately measure mood-related SBS symptoms. Moreover, the results could give a good indication regarding workplace-related well-being.
Previous studies indicated good psychometric results for the POMS. Its briefness and multidimensionality are advantageous for research. However, thus far comprehensive norm samples and comparison values are lacking. Therefore, it is necessary to psychometrically evaluate the German version of the questionnaire in order to have at hand comparison values. Furthermore, with regard to the application of the measure in empirical studies, a reduction of the 35-item version seemed possible.
The work presented here is based on an environmental, epidemiological research project analysing the SBS. The POMS was given to 4596 employees directly at their workplace [11]. The objective of our substudy was to test the short form of the POMS and to consider whether another scale (“numbness”) in this context could be useful to evaluate mood of office workers. In addition, the seven categories answer scale was converted to five categories. In a German pilot study Bullinger et al. [7] showed that no additional information was gained by using a seven categories answer scale compared to a five categories scale. In addition, the scale “mental health” of the SF 36 Health Survey was integrated in the POMS instrument [12]. In order to allow for better comparison, scale scores were recoded in the same direction. Higher scores are associated with a lower quality of life.
Methods
In total, 14 office buildings in Germany in different environments and functions were included in this study. The employees were interviewed about their mood. The included buildings are representative for the most popular indoor air condition systems (7 from 14), the other seven buildings represented the type of “natural” air condition (no mechanic climatisation, windows which can be opened).
Study design
This study is a long-term study with two measurement time points. Here, only the first measurement time point, at which all employees working in the building were interviewed, will be presented. For the selection of the second sample we used a so-called sensory list to identify the 60 most and least affected employees in order to question them again. For psychometric testing and an observation of measure repetitions, the selection procedure was too specific to yield interpretable results. Moreover, the sample would have been reduced significantly.
Measures
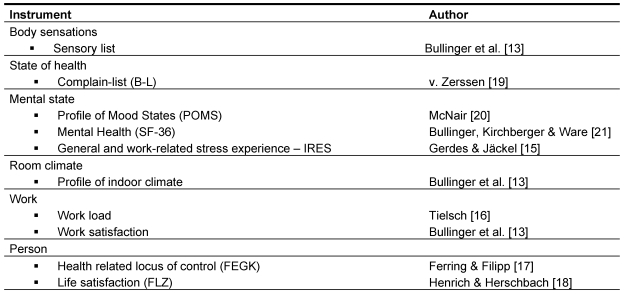
In the application of the POMS, the scale “depression”, “fatigue”, “vigour”, and “irritability” were kept. Following the assumption that SBS is associated with “numbness”, a new scale was developed based on the literature [7], [13]. This scale consists of three items (“slowed down”, “chippy”, “dazed”). In addition, the 35 items of the POMS were reduced to 24. This reduction was based on expert opinion and term of content criteria. The persons tested were given the modified POMS version with the initial question: “How do you feel today during work?“. The items are defined from 1 to 5 (“not at all”, “a little”, “moderatly”, “quite a bit”, and "extremly”, respectively). Table 2 shows the applied instruments. In addition, sociodemografic characteristics were assessed.
Table 2. Instruments.
Sample
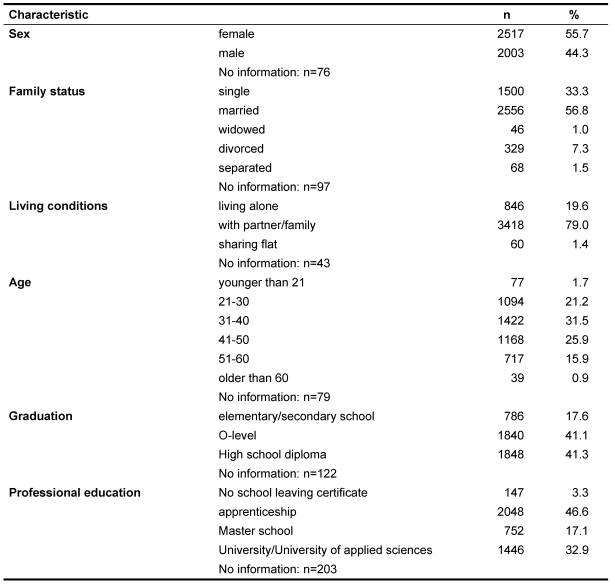
Table 3 presents the characteristics of the sample (n=4596 office workers) investigated in this study.
Table 3. Characteristics of the sample .
The majority of the employees were female (55.7%). Most of the interviewed persons were either married and/or were living together with a partner or their family (79%).
Data analysis
For the German version of the POMS item characteristics, floor- and ceiling effects, reliability, and discriminant and convergent validity were analysed. The statistical analyses were conducted with SPSS (Statistical Package for the Social Sciences) and MAP (Multi-Trait-Multi-Item-Analysis-Program) from Hays et al. [14]. The MAP program enables to confirm a postulated scale structure. The MAP-program provides an item analysis, scale intercorrelations which give details about the internal consistency (Cronbach’s α), as well as a scale-fit. The scale-fit refers to the percentage of the items which correlate higher with their scale than with others. The best score would be 100%. Age and sex differences were examined with an analysis of variance. For group differences, effect sizes were calculated and described. The convergent validation was investigated with the POMS scales and the subscale “vegetative” of the SBS-specific sensory list and the scale “mental health” of the SF-36 and finally, the scale “work load”. For discriminant validation it was tested if there were differences between self-reported healthy and ill employees. A sum score for the scales “irritability”, “fatigue” and “vigour” was calculated, when five items were answered. For the scale “numbness” the score was only calculated when three items were answered. Replacement of missing data was not performed.
Results
Missing data
The percentage of missing data differs between 4.1% for the scale “fatigue” and 4.6% for the scales “vigour” and “irritability”. In a distribution analysis we examined, if the missing data were attributed to sociodemografic data or other psychosocial criteria (see Table 4).
Table 4. Sociodemografic differences between missing and valid data.
Table 4 shows that women, elderly employees and persons with a low educational background are less likely to report details of their mood. Pertaining to the question, if aspects like burden of distress, life satisfaction or -importance, professional and vital exhaustion or causal attribution had an influence on the existence of missing data, no differences were found. Merely for the scales “vigour” and “irritability” significant differences were found between missing and usable data with regard to the scale professional exhaustion.
Item characteristics and reliability
Table 5 illustrates the essential psychometric characteristics of the POMS scales. For all scales a satisfying reliability could be achieved. Based on the observation of high bottom effects of the “irritability”, “numbness” and “fatigue” scales, we conclude that only a small number of persons scored high on theses scales. On the other hand, ceiling effects were low. As an indicator of correct item-scale-assignment measurement, the scale fit should ideally reach 90%-100%. This was achieved for all scales.
Table 5. Psychometric properties.
Age- and sex effects
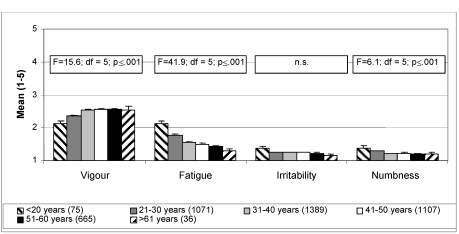
As shown in Figure 1, differences regarding age groups were mainly observed for the scales “vigour” and “fatigue”. The post-hoc analyses showed that for both scales the effects can mainly be explained by differences between the age groups <20 and 21-30 years and all other age groups. This result is also supported by the effect sizes (taken the younger age group as the basis). The strongest effects above 0.9 were detected for the scale “fatigue” between the youngest and the oldest age group. For the scale “vigour” the effects were all on an intermediate level. Effects on the scales “irritability” and “numbness” were low (see Figure 1).
Figure 1. Age effects (Mean, SE) for different age groups (sample size) .
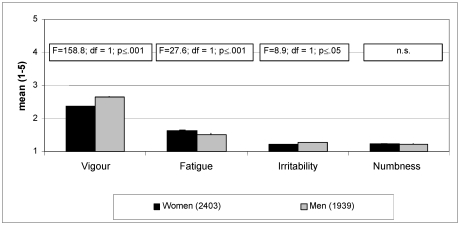
We also examined sex-effects on the POMS scales (see Figure 2). Although, there was a significant difference between the sexes regarding “mood”, we have to emphasize that significance tests are highly susceptible to sample size. The examination of the sex effects showed that they were small (d=-0.4; 0.2; -0.1; 0.02).
Figure 2. Sex effects & POMS subscales (Mean, SE).
Scale intercorrelations
Table 6 describes the scale intercorrelations (Pearson's r). For the scale “vigour”, a high score was associated with a high vigour. The correlations were very high. This can particularly be noted for the correlation between “numbness” and “fatigue”.
Table 6. Scale intercorrelations of the r POMS subscales.
Convergent validity
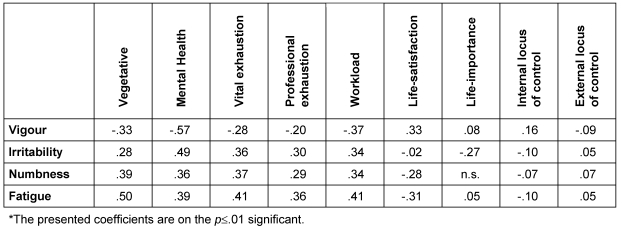
For the evaluation of the convergent validity, Spearman correlations between the “vegetative” of the SBS-specific sensory list, “mental health” of the SF-36 [12], “professional and vital exhaustion” of the IRES (Indicators of Reha-Status) [15], professional work load [16], “internal” and “external locus of control” [17] and “life satisfaction und -importance” [18] scales were calculated. As Table 7 shows, the scales “vegetative” and “mental health” correlated highly with the POMS. High scores in “vigour” were, for example, correlated with low scores in mental ill-feeling (r=-.75).
Table 7. Spearman correlations between POMS subscales and others psychosocial instruments*.
Discriminant validity
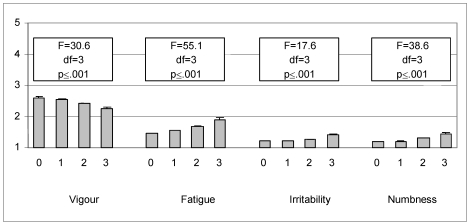
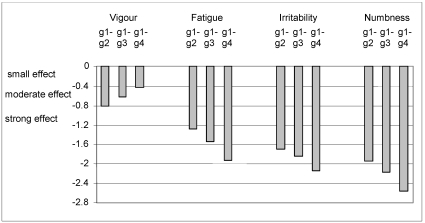
For the evaluation of the discriminant validity, we used the self-reported statements of the employees regarding possible chronically health conditions. The employees were given a list with fifteen possible diseases. They were asked if they have none, one ore more diseases. To have more or less the same sample sizes within the groups, we merged the health conditions into four categories. Employees, who reported having no disease (35.8%) or a single health condition (25.1%), were left as independent categories. Persons who claimed that they had at least two and not more than four health conditions were merged into one category (32.3%). The final group encompassed all other employees (6.7%). To indicate, if there were possible discriminat differences between the groups with regard to POMS scales, an analysis of variance was performed and effect sizes calculated. It can be seen that the physical well-being differed among disease groups. Essentially, the differences were found between the group with four diseases and the group without any disease (see Figure 3 and Figure 4).
Figure 3. Discriminant validity - self-reported number of health conditions (Mean, SE, ANOVA), 0 = no disease, 1 = one disease, 2 = two to max. four diseases, 3 = more than four diseases.
Figure 4. Discriminant validity - effect sizes (basis: group 1 (g1) no disease = 0, one disease = 1 (g2), two to max. four diseases = 2 (g3), more than four diseases = 3 (g4).
Discussion
The POMS is a wide-spread instrument to measure psychological well-being. A current problem is the different usage of the number of items and their scale assignment. The German adaptation of the American version by Biehl et al. [5] was seldom used in empirical studies. More often, different short forms were applied. A psychometric evaluation of these versions is currently not available. Only Bullinger et al. [7] suggested a short version and tested it psychometrically. The version reported here represents a further reduced version. It was tested in a big sample of over 4000 healthy employees. The analyses of missing data showed that women, elderly and persons with a low educational background are less likely to answer the questions. Furthermore, the differences regarding the missing data on the scales “vigour” and “irritability” can be associated to higher professional strain. Altogether, the differences between groups were not very high, so that we cannot conclude that the POMS can be used in all of these groups. Especially, in terms of internal consistency we found excellent results. Also the scale fit indicates an optimal item-scale-assignment. Solely bottom effects pointed towards a limited utilization of the scale width. These effects were not found for the positively formulated scale “vigour”. This might be related to the fact that healthy persons at their workplace reported more vigour than irritability, fatigue or numbness. Age and sex effects can only be reported for the scales “vigour” and “fatigue”. But the effects were very low, so that we can say that this version of the POMS can be used for both sexes and all ages.
Especially noteworthy are the high intercorrelations between the scales “numbness” and “fatigue”. This suggests that both scales assess similar dimensions. Another methodical examination may be necessary in order to examine the content of the scales. The analyses of the convergent validity showed that the dimensions of the POMS cover independent dimensions and correlate only slightly with similar dimensions. It needs to be stressed, that there is a limitation in a methodical point of view regarding the interpretation due to multiple testing. Analyses indicated some intersections of the applied instruments regarding psychological well-being. Deviations were noticed, when we referred to work-place related mood. In the view of the authors, the suggested version of the POMS is an appropriate and usable addition to other instruments.
The comparison of groups, which reported differently about their health conditions, indicated that the POMS and especially the scales “fatigue”, “irritability” und “numbness” are helpful to describe different levels of severity or prevalence. Completing the adjectives list took the tested persons not long. However, it needs to be considered that two of the four scales may measure similar dimensions. Nonetheless, the tested version of the POMS is a helpful measure for assessment in the work place context and doesn’t require much assessment effort. With regard to the contents our results are in accordance with other instruments focussing on work load. Thus, the POMS is especially suitable for the examination of questions that are related to the work-place environment, not only in relation to SBS, but also of work-place health promotion.
Notes
Conflicts of interest
None declared.
References
- 1.Biehl B, Landauer A. Das Profile of Mood States (POMS) Mannheim: 1975. [Google Scholar]
- 2.Oldridge N, Streiner D, Hoffmann R, Guyatt G. Profile of mood states and cardiac rehabilitation after acute myocardial infarction. Med Sci Sports Exerc. 1995;27(6):900–905. [PubMed] [Google Scholar]
- 3.Braslis KG, Santa Cruz C, Brickman AL, Soloway MS. Quality of life 12 months after radical prostatectomy. Br J Urol. 1995;75(1):48–53. doi: 10.1111/j.1464-410x.1995.tb07231.x. [DOI] [PubMed] [Google Scholar]
- 4.Schag CA, Ganz PA, Kahn B, Petersen L. Assessing the needs and quality of life of patients with HIV infection: development of the HIV Overview of Problems-Evaluation System (HOPES) Qual Life Res. 1992;1(6):397–413. doi: 10.1007/BF00704434. [DOI] [PubMed] [Google Scholar]
- 5.Biehl B, Dangel S, Reiser A. Profile of Mood States. CIPS (Collegium Internationale Psychiatriae Scalarum). Internationale Skalen für Psychiatrie. Weinheim: Beltz Test; 1986. [Google Scholar]
- 6.Sacham S. A shortened version of the Profile of Mood States. J Pers Assess. 1983;47(3):305–306. doi: 10.1207/s15327752jpa4703_14. [DOI] [PubMed] [Google Scholar]
- 7.Bullinger M, Heinisch M, Ludwig M, Geier S. Skalen zur Erfassung des Wohlbefindens: Psychometrische Analysen zum "Profile of Mood States" (POMS) und zum "Psychological General Well-Being Index" (PGWB) Zeitschrift für Differentielle und Diagnostische Psychologie. 1990;11(1):53–61. [Google Scholar]
- 8.Nyenhuis DL, Yamamoto C. Adult and Geriatric Nomative Data and Validation of the Profile of Mood States. J Clin Psychol. 1999;55(1):79–86. doi: 10.1002/(sici)1097-4679(199901)55:1<79::aid-jclp8>3.0.co;2-7. [DOI] [PubMed] [Google Scholar]
- 9.Beck AT, Ward C, Mendelson M, Mock J, Erbaugh J. An inventory for measuring depression. Arch Gen Psychiatry. 1961;4:561–571. doi: 10.1001/archpsyc.1961.01710120031004. [DOI] [PubMed] [Google Scholar]
- 10.Spielberger CD, O`Niel HF, Hansen DN. Anxiety, drive theory, and computer-assisted learning. CAI Center Rechnical Report, Florida State University. 1970;14:67. [Google Scholar]
- 11.Bischof W, Brasche S, Bullinger M, Frick U, Gebhardt H, Kruppa B. ProKlimA - history, aim, and study design. Proc Indoor Air. 1999;5:376–381. [Google Scholar]
- 12.Bullinger M, Kirchberger I. SF-36 Fragebogen zum Gesundheitszustand - Manual. Göttingen: Hogrefe; 1998. [Google Scholar]
- 13.Bullinger M, Frick U, Kirchberger I, von Mackensen S, Hasford J. Erfassung des Sick Building Syndroms. In: Bischof W, Dompke M, Kruppa B, Schmid W, editors. Sick Building Syndrom - Forschung und Erkenntnisumsetzung. Heidelberg: C. F. Müller; 1993. pp. 88–96. [Google Scholar]
- 14.Hays RD, Hayashi T, Carson S, Ware JE. User's Guide for the Multitrait Analysis Program (MAP) Santa Monica: Rand Corporation; 1988. [Google Scholar]
- 15.Gerdes N, Jäckel WH. Der IRES-Fragebogen für Klinik und Forschung. Die Rehabilitation. 1995;34:XIII–XXIV. [PubMed] [Google Scholar]
- 16.Tielsch R. Ansatz, Kriterien & Ergebnisse zur Ermittlung subjektiver Belastungen und Beanspruchungen an industriellen Arbeitsplätzen. 1987. (Fortschrittberichte-VDI, Reihe 17. Biotechnik; 35). [Google Scholar]
- 17.Ferring D, Filipp SH. Der Fragebogen zur Erfassung gesundheitsbezogener Kontrollüberzeugung (FEGK). Kurzbericht. Zeitschrift für Klinische Psychologie. 1989;18(3):285–289. [Google Scholar]
- 18.Henrich G, Herschbach P. Fragen zur Lebenszufriedenheit (FLZM) In: Ravens-Sieberer U, Cieza A, editors. Lebensqualität und Gesundheitsökonomie in der Medizin: Konzepte, Methoden, Anwendung. Landsberg: ecomed; 2000. pp. 98–110. [Google Scholar]
- 19.von Zerssen D. Die Beschwerden-Liste. Klinische Selbstbeobachtungsbögen aus dem Münchener Psychiatrischen Informationssystem. Weinheim: Beltz; 1976. [Google Scholar]
- 20.McNair DM, Droppleman LF. Manual for the Profile of Mood States. San Diego, CA: Educational and Industrial Testing Service; 1971. [Google Scholar]
- 21.Bullinger M, Kirchberger I, Ware J. Der deutsche SF-36 Health Survey. Zeitschrift für Gesundheitswissenschaften. 1995;3(1):21–36. [Google Scholar]


