Abstract
We report a tissue diagnostic system which combines two complementary techniques of time-resolved laser-induced fluorescence spectroscopy (TR-LIFS) and ultrasonic backscatter microscopy (UBM). TR-LIFS evaluates the biochemical composition of tissue, while UBM provides tissue microanatomy and enables localization of the region of diagnostic interest. The TR-LIFS component consists of an optical fiber-based time-domain apparatus including a spectrometer, gated multichannel plate photomultiplier, and fast digitizer. It records the fluorescence with high sensitivity (nM concentration range) and time resolution as low as 300 ps. The UBM system consists of a transducer, pulser, receiving circuit, and positioning stage. The transducer used here is 45 MHz, unfocused, with axial and lateral resolutions 38 and 200 μm. Validation of the hybrid system and ultrasonic and spectroscopic data coregistration were conducted both in vitro (tissue phantom) and ex vivo (atherosclerotic tissue specimens of human aorta). Standard histopathological analysis of tissue samples was used to validate the UBM-TRLIFS data. Current results have demonstrated that spatially correlated UBM and TR-LIFS data provide complementary characterization of both morphology (necrotic core and calcium deposits) and biochemistry (collagen, elastin, and lipid features) of the atherosclerotic plaques at the same location. Thus, a combination of fluorescence spectroscopy with ultrasound imaging would allow for better identification of features associated with tissue pathologies. Current design and performance of the hybrid system suggests potential applications in clinical diagnosis of atherosclerotic plaque.
INTRODUCTION
Current techniques used for intraluminal investigations of atherosclerotic plaque include angiography, intravascular ultrasound (IVUS), optical coherence tomography, intravascular magnetic resonance imaging, and optical spectroscopy (near infrared, Raman, etc.). Each of these techniques has intrinsic advantages and is sensitive to either plaque structure or composition. However, none of these techniques alone can provide complete information concerning various markers involved in plaque vulnerability and rupture which may encompass both structure and composition (e.g., a thin fibrous cap, a large lipid-rich pool, increased macrophage activity, and outward remodeling).1 Thus, new diagnostic techniques with the capability to concurrently localize and identify anatomic features to characterize the composition of high-risk plaques are needed in order to reduce the incidence of acute cardiovascular syndromes and sudden death.
Optical fluorescence spectroscopy techniques have been reported capable of detecting elastin, collagen, lipids, and other label-free compositional markers which allow for differentiation between normal and diseased arterial tissue.2, 3 For example, early studies have shown that fluorescence techniques, including time-resolved methods, enable detection of the thin cap fibroatheromas,4 lipid-rich lesions, as well as fibrotic caps with macrophage and inflammatory cell infiltration.5, 6, 7, 8, 9, 10 However, the poor penetration depth, which is on the order of hundreds of microns, limits the application of optical fluorescence spectroscopy. An imaging technique which can “see through” the tissue is needed to provide structural information and to improve the overall diagnostic ability of optical techniques.
Conventional IVUS, which has been used clinically for assessing vessel wall anatomy since the early 1990s, can identify luminal diameter, wall thickness, plaque morphology, and can assess vessel remodeling.11, 12 The advantage of IVUS includes the use of higher frequencies (>20 MHz), which improves the spatial resolution and achieves penetration depths of several millimeters, allowing the delineation of the layered structures in the vessel wall. However, IVUS is sensitive to fibrous and calcified plaque but not to soft or lipid-rich plaque.1 To improve the identification of a lipid-rich plaque and enhance the role of IVUS in vulnerable-plaque detection, integrated backscatter, assessment of the radio frequency (RF) envelope, and spectral analysis of the RF signal from the plaque have been developed.13, 14, 15, 16, 17 Overall, IVUS can provide great structural information, but lacks the sensitivity and accuracy to detect biochemical properties associated with rupture-prone plaques.
Taking into account the requirements of atheroma detection and evaluation, it is obvious that a combined approach capable of evaluating structural characteristics as well as biochemical properties of the plaque may provide higher predictive information regarding plaque vulnerability than a single approach.1, 18, 19 For example, researchers have demonstrated in an ex vivo study, that the combination of Raman spectroscopy and IVUS provides complementary information about the amount and location of calcified deposits and lipid pools in atherosclerotic plaques.20
In this context, we report here the conceptual design and validation of a novel tissue diagnostic system for the characterization and diagnosis of tissues including atherosclerotic plaques, which combines two complementary techniques: time-resolved laser-induced fluorescence spectroscopy (TR-LIFS) and ultrasonic backscatter microscopy (UBM). Based on the study of this system, it is feasible to further translate this technique into an intravascular device with a combined TR-LIFS∕IVUS catheter. Such a combination could be useful for intravascular clinical diagnosis of vulnerable plaque and may allow researchers or physicians to monitor the effects of various medical or therapeutic interventions.
SYSTEM CONFIGURATION AND CHARACTERIZATION
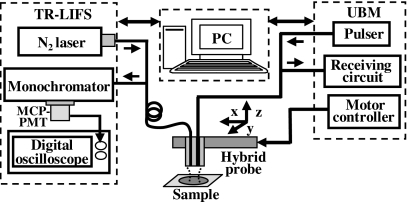
We have developed and validated the concept of the dual-modal system by integrating a TR-LIFS device developed earlier by our research group21 with a UBM system22 into a compact experimental apparatus and have tested it for the localization and characterization of human aortic atherosclerotic plaque. The conceptual schematic diagram of the hybrid prototype is given in Fig. 1. The combined system consisted of four primary modules including the TR-LIFS and UBM subsystem, the hybrid probe and the control unit. In the following, we describe the electronic components, the interface connection and performance of the TR-LIFS and UBM subsystem, the hybrid probe combining an optical fiber and high-frequency ultrasonic transducer, and the integration of the two individual subsystems into one single functional unit.
Figure 1.
Schematic diagram of the combined TR-LIFS∕UBM system. The combined system consisted of four modules (from left to right): the TR-LIFS subsystem, computer (control unit), hybrid ultrasonic and spectroscopic probe, and UBM subsystem.
TR-LIFS components
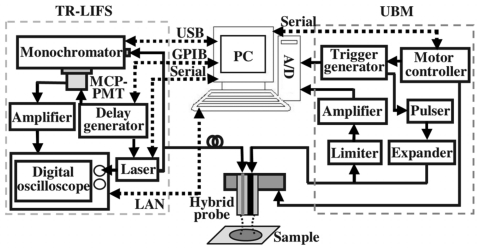
The electronics and interface connection of the TR-LIFS subsystem are demonstrated in Fig. 2. The time-dependent fluorescence intensity decay was acquired through a pulse sampling method which uses a digitizer and fast-gated detection to sample the curve repetitively at shorter time intervals than the sample’s fluorescence lifetime. The excitation light pulses from a nitrogen laser source (MNL205-C, LTB Lasertechnik Berlin, Berlin, Germany) at 337.1 nm were directed into an optical fiber with different configurations (bifurcated or single optical fiber). Laser excitation output can be up to 80 μJ∕pulse and the measured energy at the tip of the fiber was adjusted to be 2 μJ∕pulse. Following sample excitation, the emitted fluorescence light was dispersed by the spectrometer (MicroHR, Horiba Jobin Yvon, Edison, NJ) for time-resolved measurements at discrete steps across the emission spectrum. The output light was detected by a gated multichannel plate photomultiplier tube (PMT) (R5916U-50, Hamamatsu, Bridgewater, NJ), amplified by a wideband preamplifier (C-5594–12, 1.5 GHz bandwidth, Hamamatsu, Bridgewater, NJ), digitized by a fast digital oscilloscope (DPO 7254, 2.5 GHz bandwidth, 20G samples∕s, Tektronix, Richardson, TX), and transferred to the computer. A delay generator (DG535, Stanford research systems, Sunnyvale, CA) was used as the master trigger source to synchronize the PMT and laser such that the fluorescence decay fell within the region of the PMT gate. A low jitter (<200 ps) optical trigger signal was used to trigger the data acquisition on the oscilloscope. Spectral intensity calibration was performed with a tungsten-halogen calibration lamp (63358, Oriel, Stratford, CT).
Figure 2.
Electronics and interfacing setup of the combined TR-LIFS∕UBM system. The schematic for the electronics configuration was designed to ensure proper synchronization of various components and automation of the data acquisition and analysis process. The interfaces (dashed lines) between the control unit and subsystems integrated the TR-LIFS and UBM into one functional system.
The major specifications of the TR-LIFS system were characterized, including the spectral and time resolution, sensitivity, and data acquisition time. The spectral resolution of the instrument was 5 nm as determined by the combination of the linear dispersion of the grating, the entrance and exit slit width. The time resolution of ∼300 ps was mainly determined by the temporal response of the PMT, the preamplifier, and the oscilloscope. This was further verified by measuring the lifetime of Rose Bengal in methanol with subnanosecond fluorescence lifetimes (∼0.58 ns). Estimation of the intrinsic fluorescence decay was carried out via deconvolution of the observed fluorescence traces from the measured excitation pulse with the Laguerre deconvolution approach.23 Experimentally, the measured excitation pulse was obtained through direct recording of the reflected laser light from samples using the same data acquisition settings, which was the convolution of the excitation function with the instrument response function. The average lifetime of the fluorescence decay was computed as the interpolated time at which the deconvolved fluorescence decayed to 1∕e of its maximum value. The system’s sensitivity was determined to be 10−9M of the Coumarin 1 solution in ethanol, emitting fluorescence with the signal-to-noise ratio (SNR) value of 40, allowing the accurate estimation of lifetime. The data acquisition time was 0.6 s per wavelength, including averaging 12 decays at a laser repetition rate of 40 Hz, rotation of the grating, and saving and transferring data.
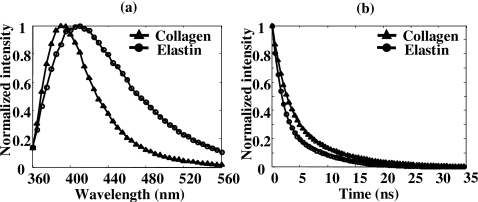
The performance of the TR-LIFS instrument was validated by measuring the fluorescence emission of standard dyes and biomolecules. The average lifetimes of typical standard dyes (long, medium, and short lifetimes) were found in good agreement with the values reported in the literature (Table 1).24, 25, 26 The data are reported as mean±standard error of ten repeated measurements. Commercially available samples of collagen type I from bovine Achilles tendon (C-9879, Sigma-Aldrich, St. Louis, MO) and elastin from human aorta (E-6777, Sigma-Aldrich) were tested in dry powder form. Collagen type I and elastin have distinct emission spectra with an emission peak of 390 and 410 nm, respectively [Fig. 3a]. They were clearly differentiated from their fluorescence decay curves at 390 nm [Fig. 3b], where collagen had a long-lasting fluorescence emission when compared to elastin.
Table 1.
Fluorescence lifetime values of standard dyes.
| Sample | Solvent | Peak (nm) | Lifetime (ns)a | |
|---|---|---|---|---|
| Laguerre | Literature | |||
| 9∕CA | Ethanol | 445 | 11.78±0.06 | 11.7–11.85 |
| Rhodamin B | Ethanol | 595 | 2.669±0.03 | 2.60–3.01 |
| Rose Bengal | Methanol | 575 | 0.621±0.03 | 0.54–0.655 |
Figure 3.
Time-resolved fluorescence measurements of elastin (circle) and collagen type I (triangle): (a) mean time-integrated spectra averaged over ten measurements, and (b) mean deconvolved fluorescence decay traces obtained at the wavelength of 390 nm.
UBM components
The electronics and interface diagram of the UBM subsystem is also shown in Fig. 2. A high voltage pulser (AVB2-TE-C, Avtech Electrosystems, Ltd., Ottawa, Ontario, Canada) generating 1 cycle of a rectangular wave (200V peak-to-peak) with an adjustable period was used to drive the transducer. The receiving circuit was constructed with a commercial expander and limiter (DEX-3 and DL-1, Matec Instruments, Northborough, MA) to protect the receiving circuitry from the high voltages required for transmission when using the same transducer for transmitting and receiving. The received RF echoes were amplified with a 30 dB low noise amplifier (Miteq 1114, Miteq Inc., Hauppauge, NY) and filtered with proper bandpass filters (Mini-circuits, Brooklyn, NY). A 12 bit analog-to-digital converter with a sampling rate as high as 400 Msamples∕s (CompuScope 12400, GaGe Applied Technologies, Lachine, QC, Canada) was employed, which maintained the SNR of the received RF signals and provided good resolution and dynamic range of 60 dB. A custom-built positioning assembly incorporating a miniature precision linear motorized stage (MX80L, 1 μm resolution, Parker-Daedal, Irwin, PA) driven by a low noise servo drive (Vix250AH, Parker Hannifin, Rohnert Park, CA) allowed for scanning and forming an image. After digitization, signal processing algorithms were applied to detect the echo envelop, logarithmically compress the RF data, and display the B-mode images.
Various high frequency transducers with different specifications (40–73 MHz) could be used in this system. The customized 45 MHz needle transducer (aperture size of 0.4 mm×0.4 mm, PMN-PT single crystal, Ultrasonic Transducer Resource Center, University of Southern California, Los Angeles, CA) used here had a −6 dB two-way fractional bandwidth of 50%.27 The axial and lateral resolution (38 μm and 200 μm, respectively) was estimated from the image acquired by scanning across a 13 μm tungsten wire (subresolution point target).
Combined probe and control unit of the integrated system
A compact combined probe was constructed by assembling either in parallel or concentrically the high frequency ultrasonic transducer and the optical fiber [Fig. 4]. The combined probe with the parallel assembly [Figs. 4a, 4b] used an unfocused transducer with the piezoelectric material of lithium niobate single crystal operating at around 60 MHz and a 40 MHz focused ring transducer using lithium niobate as the active element was placed in the concentric probe [Fig. 4c].28 The flexible design of the hybrid probe demonstrated that an ample range of transducers (with different frequencies, aperture sizes, focusing, and materials) and optical fibers (varied core sizes) could be chosen for specific purposes.
Figure 4.
(a) Picture of the hybrid TRLIFS∕UBM probe encapsulating an ultrasound transducer and a single optical fiber with the parallel assembly. (b) Microscope picture of the surface of the parallel combined probe shown in (a), demonstrating the 1 mm diameter transducer and 600 μm fiber optics assembled in a 3.5 mm shaft tube. (c) Concentric design of the hybrid probe combining a ring transducer and a single optical fiber in the center.
A computer, acting as the control unit, was used to integrate the TR-LIFS and UBM components into one dual-modal system using different types of interfaces including local area network (LAN) and universal serial bus (USB) (Fig. 2). To increase the data acquisition speed, both the commands and data transfer between the computer and TR-LIFS subsystem were through LAN (TCP∕IP) with a high speed of 100 Mbytes∕s, while the UBM data was digitized locally by the acquisition board inside the computer. A specialized instrument control and user interface software integrating the UBM and TR-LIFS was developed in LABVIEW (National instrument, Texas) for system parameter adjustments and various data acquisition tasks.
The control procedure for the dual-modal system was accomplished through the software by scanning the sample with the ultrasound transducer to form and display a B-mode image, locating the region of interest, marking this point digitally on the UBM images for subsequent correlation between the optical and the ultrasound data, and then guiding the optical fiber to the proper location to perform TR-LIFS measurements. Similar procedures were repeated until all the regions of interest were examined by TR-LIFS along this ultrasound scanning line.
SYSTEM VALIDATION
In vitro tissue phantom study
In order to validate the new hybrid spectroscopic and ultrasonic system, as well as for coregistration of the ultrasonic image with spectroscopic data, a dual-modal tissue phantom mimicking both the optical and acoustical properties of biological tissue was utilized. The tissue phantom is briefly described and detailed elsewhere.29 The phantom consisted of contrast agents including silicon dioxide particles acting as both optical and acoustical scatterers, and fluorescein isothiocyanate (FITC) conjugated dextran mimicking endogenous fluorophores in tissue. The agents were encapsulated in a polymer bead which was implanted into a gel matrix with the desired pattern.
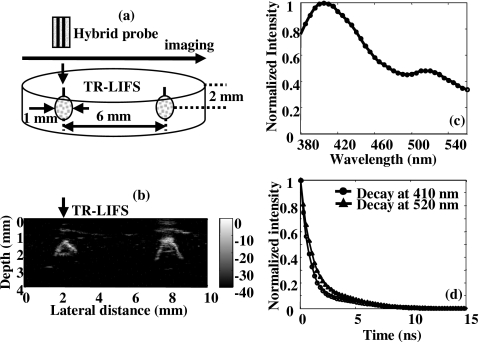
The phantom [Fig. 5a] contained 1 mm beads placed 6 mm apart and buried 2 mm below the surface of the gel matrix. UBM images were first acquired to identify the distribution of the beads and compared with the real dimension of the phantom to validate the ultrasonic data. In the UBM image [Fig. 5b], two beads (2 mm below the surface with a measured distance between them of 6 mm) appeared brighter since the gel matrix was acoustically transparent, giving the black background of the image. Due to the perpendicular position of the transducer to the beads and the attenuation caused by the ultrasonic scatterers inside the beads, only the upper parts of the beads were shown in the image. The optical fiber was then positioned by the host computer to the region of interest, one of the beads, which was easily located from the ultrasound image for TR-LIFS measurements. Since the emission spectrum [Fig. 5c] acquired above the FITC bead originated from the mixture of the bead and gel matrix, two emission peaks at 410 nm (fluorescence from the gel matrix) and 520 nm (fluorescence mainly from FITC) were observed. From the deconvolved fluorescence decay at the wavelength 520 nm [Fig. 5d], the FITC lifetime of approximately 1.25 ns was found shorter than the lifetime of FITC in solution. This discrepancy is mostly generated by the polymerization process that trapped the FITC in a solid environment, changing the lifetime of FITC as compared to previously reported values.30
Figure 5.
System validation and data coregistration using the dual-modal tissue phantom. (a) Diagram of the phantom illustrating the distribution and dimension of the FITC beads in the gel matrix. (b) Ultrasound B-mode image (4 mm in depth and 10 mm in lateral direction) showing two bright beads inside the gel matrix. (c) Mean emission spectrum acquired from the position above the FITC bead showing two emission peaks at 410 nm (fluorescence of the gel) and 520 nm (fluorescence of FITC). (d) Mean deconvolved fluorescence decay traces (based on the Laguerre basis expansion technique) obtained at the wavelength of 410 nm (circle) and 520 nm (triangle), where the averaged lifetimes were estimated to be 0.96 and 1.25 ns, respectively.
Ex vivo human aorta atherosclerotic plaque study
To further demonstrate the feasibility of the hybrid system for providing complementary diagnostic information about atherosclerotic plaque morphology and biochemical composition, ex vivo TRLIFS∕UBM data were acquired from ten human aorta samples (postmortem specimens) that displayed representative morphological and compositional features. The specimens were visually inspected for features of interest (including thick intima, soft areas corresponding to lipid pools, fibrotic areas, and calcification), photographed for position labeling, and then immerged in the saline bath for investigation as follows. For each sample, a set of ultrasound B-mode images were constructed and visualized in order to identify plaque points of interest for TR-LIFS data collection. For each point, TR-LIFS data was acquired at the emission wavelength range of 360–560 nm (5 nm interval). After each TR-LIFS acquisition, the interrogated area was marked with tissue ink for future correlation of the spectroscopy results and ultrasound images with histopathology. After the experiments, the marked tissue specimens were placed in 10% formalin, sent for routine histopathological analysis which included staining with hematoxylin and eosin (H and E) and a combined trichrome∕elastin method (mature collagen stained blue, elastin stained black, and smooth muscle cells stained red in the trichrome∕elastin stained sections).
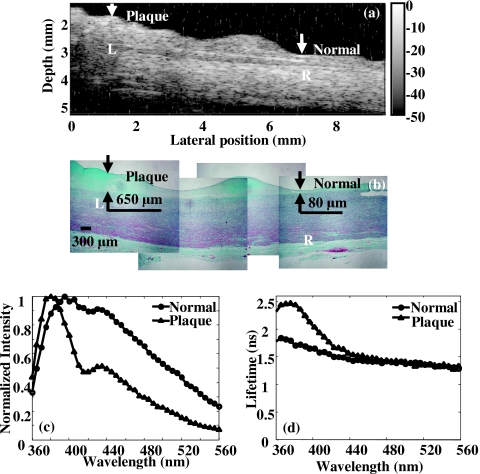
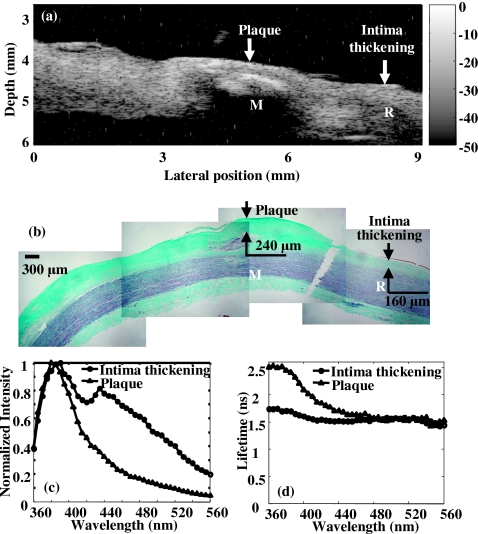
Figure 6 summarizes the complementary information provided by the two diagnostic approaches and the observed correlation of the results against histopathology with trichrome staining, the current diagnostic gold standard. Accurate reconstruction of plaque morphology was displayed in the ultrasonic image [Fig. 6a], showing the delineation of the layered structure and thickened intima and fibrous cap. In spectroscopy [Figs. 6c, 6d], fluorescence from the normal position suggested the contribution of the elastin fibers found in the media layer to the overall emission spectrum because the 337 nm laser pulse passed through the 80 μm intima and reached the media layer consisting of elastin (the penetration depth of the UV light was approximately 250 μm7). The trends of the fluorescence on the plaque position demonstrated the large contribution to plaque fluorescence emission of collagen within the thick fibrotic cap of the intima (∼650 μm). This was expected since the excitation light cannot reach the media layer which is rich in elastin. Overall, the spectroscopic results corresponded to the fluorescence characteristics of collagen and elastin as previously reported24, 31 and were validated by the corresponding histopathology. In summary, UBM gave an accurate structural assessment of the vessel wall for defining the areas of interest while spectroscopy data provided the chemical information within the region. These findings demonstrated that the two techniques were complementary to each other in the characterization of the atherosclerotic plaque. In addition, ultrasound was a very sensitive method in vivo for the detection of calcium. Since the fluorescence spectroscopy at 337 nm excitation could not reliably discriminate calcium deposits, UBM was used as an alternative to identify such deposits. Calcified deposits were visualized by ultrasound as “acoustic shadowing” since the calcified region reflected most of the energy and obstructed the penetration of ultrasound. Figure 7 depicts an example of how ultrasound provides diagnostic information about calcified plaques, thus complementing the TR-LIFS detection. The calcified deposit was detected by ultrasound [Fig. 7a] and verified by histopathology [Fig. 7b]. Since 337 nm laser excitation could barely penetrate the 240 μm fibrous cap above the calcium deposit, fluorescence spectrum and lifetime [Figs. 7c, 7d] showed similar characteristics as the fluorescence measurements of the fibrous cap in Fig. 6. Even if the UV light can reach the calcium deposits, no fluorescence emission is expected from calcium upon 337 nm excitation. Therefore, the ultrasonic images can be used to identify the area with calcified lesion, thus providing complementary information for the TR-LIFS method.
Figure 6.
Dual-modal measurements of the ex vivo human aorta atherosclerotic plaque samples showing the complementary information provided by TR-LIFS and UBM. (a) UBM image demonstrated the fibrous cap (L) adjacent to the muscular media, compared to the thin layer of normal intima (R). (b) Trichrome∕elastin stained section (mature collagen stained blue, elastin stained black, and smooth muscle cells stained red) showed the 650 μm fibrous cap (L) and the normal intima layer with the thickness of 80 μm (R). [(c) and (d)] Fluorescence measurements were taken at normal and plaque position marked on the histology and ultrasound image (arrows). Fluorescence at normal position (circle) showed broad average emission spectrum (c) and relatively short-lasting decay as reflected by the average lifetime (d). Fluorescence at plaque position (triangle) showed narrower spectra (c), relatively long-lasting emission as reflected by the lifetime at blueshifted emission wavelength and their wavelength dependence (d).
Figure 7.
Dual-modal measurements of the ex vivo human atherosclerotic plaque with calcified lesion, showing how ultrasound provided diagnostic information on calcified plaques and improved the TR-LIFS detection. (a) UBM image showing the bright region with acoustic shadowing below (M) which was the calcified lesion. (b) Trichrome∕elastin stained section (mature collagen stained blue, elastin stained black and smooth muscle cells stained red). A 240 μm fibrous cap, below which was a lipid pool with calcification (M) and the 160 μm intima thickening (R) were observed. (c) Comparison of the average fluorescence emission spectrum between the plaque (mainly from the fibrous cap above the calcified lesion) and intima thickening. (d) Comparison of the average lifetime as a function of wavelength between the plaque and intima thickening.
DISCUSSION
Unique features of the dual-modal system
A unique feature of the two-modal technology was that UBM (relatively high penetration depth ∼6 mm at 45 MHz) allows for the examination of plaque structure within its entire cross section when compared to TR-LIFS which allows for evaluation of the composition of the fibrotic cap within only a few hundred micrometers. This is important because complementary diagnostic information concerning the tissue in question is obtained. For example, UBM enabled high resolution imaging (∼40 μm at 45 MHz) of the anatomy of the plaques and provided both diagnostic information (size and location of the lipid or necrotic core, thickness of the fibrotic cap, presence of calcium deposits) and guidance for the TR-LIFS measurements to areas of interest––such as those characterized by a thin fibrotic cap with a large lipid pool. Further investigation of such areas by TR-LIFS allows for identification of the actual composition of the thick fibrotic cap (collagen versus lipid∕macrophage content) which plays an important role in plaque instability and rupture. A thick fibrotic cap with high collagen content is known as being more stable while one rich in lipid-laden macrophages is more likely to become unstable and to rupture.
Pathways to clinical applications
Because our goal is to use this hybrid technology for intravascular investigations, emphasis is placed on identifying approaches that lead to (a) the development of a compact intravascular catheter which incorporates TR-LIFS and UBM (IVUS), (b) high-resolution UBM systems for accurate discrimination of distinct morphological features in plaques, and (c) fast TR-LIFS data acquisition for near real time tissue diagnosis. Our group has already addressed the latter aspect by developing a simultaneous time- and wavelength-resolved fluorescence spectroscopy technique. This technique, recently reported by our group,32 provides the opportunity for real-time tissue characterization or diagnosis. It enables the reduction of the data acquisition time from the current ∼20 s for a TR-LIFS scan (200 nm, every 5 nm) to hundreds of nanoseconds for acquisition of the time-resolved data in multiple and specific spectral bands for tissue diagnosis. In addition, the flexibility of the design of the hybrid probe described here has allowed for the selection of a wide variety of transducers. This includes both unfocused and focused transducers with different f numbers and frequencies, parameters which in turn define the spatial resolution of the UBM subsystem. Transducers with high frequencies (above 50 MHz) are expected to provide improved spatial resolution and image quality and are suitable for applications requiring a penetration depth of several millimeters. For example, the 70 MHz transducer tested in this study can approach ultimate lateral resolution of approximately 60 μm for an f number of 2, and axial resolution typically of 15 μm. Moreover, current research in our group33 focuses on translating the rigid probe used in this study into a flexible hybrid catheter which integrates a side-viewing single fiber optic probe for TR-LIFS with a high frequency IVUS catheter. This will enable future evaluation of the dual-modal system for intravascular applications.
CONCLUSION
We developed a dual-modal tissue diagnosis system combining time-resolved laser-induced fluorescence spectroscopy and high frequency ultrasound imaging. The system was calibrated and validated both in vitro and ex vivo situations. The preliminary data presented in the results section demonstrated a number of noteworthy findings. First, ex vivo spatially correlated ultrasonic and TR-LIFS studies were feasible with available probes. Second, the close similarity between the tissue morphology shown by ultrasound and the corresponding histopathology demonstrated that ultrasound could be used as a guidance tool to indicate possible unstable plaque areas for subsequent fluorescence studies. Finally, compositional information such as calcified region, specifically detected by ultrasound, demonstrated that ultrasound could provide complementary information regarding plaque composition. The system showed great potentials as an optimal approach for the detection of rupture-prone plaques that incorporated structural definition provided by the high-resolution ultrasound with the biochemical processes detected by fluorescence spectroscopy. Ultrasound imaging may serve as both a guiding tool for the use of TR-LIFS and a complementary tool for diagnosing features of plaque vulnerability. Future catheter-based intravascular hybrid system can be used for the identification of patients who are more likely to have a vulnerable plaque and can be used to study dynamically the effects of therapy.
ACKNOWLEDGMENTS
The authors would like to acknowledge Dr. Qifa Zhou, Dr. Ruibin Liu, and Jay Williams for making the ultrasound transducers. We would like to thank Dr. Yinghua Sun for fabrication of optical fibers and Jen Phipps for assisting with the histopathology evaluation, Dr. Kuo-Chih Liao for guidance of the phantom design, and Jerry Wu for fabrication of UBM motor enclosure. We also want to thank Dr. Paul Dayton and Jonathan Poon for fabrication of the motion stage adapter, and Dr. Yibao Wu for many helpful discussions about hardware design. This work was supported by the National Institutes of Health Research Grant No. 2R01HL067377.
References
- MacNeill B. D., Lowe H. C., Takano M., Fuster V., and Jang I. K., Arterioscler., Thromb., Vasc. Biol. 23, 1333 (2003). 10.1161/01.ATV.0000080948.08888.BF [DOI] [PubMed] [Google Scholar]
- Moreno P. R. and Muller J. E., Curr. Opin. Cardiol. 17, 638 (2002). 10.1097/00001573-200211000-00010 [DOI] [PubMed] [Google Scholar]
- Richards-Kortum R. and Sevick-Muraca E., Annu. Rev. Phys. Chem. 47, 555 (1996). 10.1146/annurev.physchem.47.1.555 [DOI] [PubMed] [Google Scholar]
- Sangiorgi G., J. Interv. Cardiol. 20, 231 (2007). 10.1111/j.1540-8183.2007.00261.x [DOI] [PubMed] [Google Scholar]
- Christov A., Dai E., Drangova M., Liu L., Abela G. S., Nash P., McFadden G., and Lucas A., Photochem. Photobiol. 72, 242 (2000). [DOI] [PubMed] [Google Scholar]
- Arakawa K., Isoda K., Ito T., Nakajima K., Shibuya T., and Ohsuzu F., Arterioscler., Thromb., Vasc. Biol. 22, 1002 (2002). 10.1161/01.ATV.0000017461.79231.3D [DOI] [PubMed] [Google Scholar]
- Marcu L., Fishbein M. C., Maarek J. M., and Grundfest W. S., Arterioscler., Thromb., Vasc. Biol. 21, 1244 (2001). 10.1161/hq0701.092091 [DOI] [PubMed] [Google Scholar]
- Marcu L., Fang Q., Jo J. A., Papaioannou T., Dorafshar A., Reil T., Qiao J. H., Baker J. D., Freischlag J. A., and Fishbein M. C., Atherosclerosis 181, 295 (2005). 10.1016/j.atherosclerosis.2005.02.010 [DOI] [PMC free article] [PubMed] [Google Scholar]
- Andersson-Engels S., Klinteberg C., Svanberg K., and Svanberg S., Phys. Med. Biol. 42, 815 (1997). 10.1088/0031-9155/42/5/006 [DOI] [PubMed] [Google Scholar]
- Bigio I. J. and Mourant J. R., Phys. Med. Biol. 42, 803 (1997). 10.1088/0031-9155/42/5/005 [DOI] [PubMed] [Google Scholar]
- de Korte C. L., Carlier S. G., Mastik F., Doyley M. M., van der Steen A. F., Serruys P. W., and Bom N., Eur. Heart J. 23, 405 (2002). 10.1053/euhj.2001.2806 [DOI] [PubMed] [Google Scholar]
- Jang I. K., Bouma B. E., Kang D. H., Park S. J., Park S. W., Seung K. B., Choi K. B., Shishkov M., Schlendorf K., Pomerantsev E., Houser S. L., Aretz H. T., and Tearney G. J., J. Am. Coll. Cardiol. 39, 604 (2002). 10.1016/S0735-1097(01)01799-5 [DOI] [PubMed] [Google Scholar]
- Komiyama N., Berry G. J., Kolz M. L., Oshima A., Metz J. A., Preuss P., Brisken A. F., Pauliina Moore M., Yock P. G., and Fitzgerald P. J., Am. Heart J. 140, 565 (2000). 10.1067/mhj.2000.109217 [DOI] [PubMed] [Google Scholar]
- Fei D. Y. and Shung K. K., J. Acoust. Soc. Am. 78, 871 (1985). 10.1121/1.393115 [DOI] [PubMed] [Google Scholar]
- Nair A., Kuban B. D., Tuzcu E. M., Schoenhagen P., Nissen S. E., and Vince D. G., Circulation 106, 2200 (2002). 10.1161/01.CIR.0000035654.18341.5E [DOI] [PubMed] [Google Scholar]
- Nair A., Calvetti D., and Vince D. G., IEEE Trans. Ultrason. Ferroelectr. Freq. Control 51, 420 (2004). 10.1109/TUFFC.2004.1295427 [DOI] [PubMed] [Google Scholar]
- Nair A., Kuban B. D., Obuchowski N., and Vince D. G., Ultrasound Med. Biol. 27, 1319 (2001). 10.1016/S0301-5629(01)00436-7 [DOI] [PubMed] [Google Scholar]
- Pasterkamp G., Falk E., Woutman H., and Borst C., J. Am. Coll. Cardiol. 36, 13 (2000). 10.1016/S0735-1097(00)00677-X [DOI] [PubMed] [Google Scholar]
- Naghavi M., Libby P., and Falk E., Circulation 108, 1664 (2003). 10.1161/01.CIR.0000087480.94275.97 [DOI] [PubMed] [Google Scholar]
- Romer T. J., Brennan J. F., Puppels G. J., Zwinderman A. H., van Duinen S. G., van der Laarse A., van der Steen A. F., Bom N. A., and Bruschke A. V., Arterioscler., Thromb., Vasc. Biol. 20, 478 (2000). [DOI] [PubMed] [Google Scholar]
- Fang Q. Y., Papaioannou T., Jo J. A., Vaitha R., Shastry K., and Marcu L., Rev. Sci. Instrum. 75, 151 (2004). 10.1063/1.1634354 [DOI] [PMC free article] [PubMed] [Google Scholar]
- Sun L., Richard W. D., Cannata J. M., Ching F., Johnson J. A., Yen J. T., and Shung K. K., IEEE Trans. Ultrason. Ferroelectr. Freq. Control 54, 1648 (2007). 10.1109/TUFFC.2007.436 [DOI] [PubMed] [Google Scholar]
- Jo J., Fang Q., Papaioannou T., and Marcu L., J. Biomed. Opt. 9, 743 (2004). 10.1117/1.1752919 [DOI] [PMC free article] [PubMed] [Google Scholar]
- Lakowicz J. R., Principles of Fluorescence Spectroscopy, 2nd ed. (Kluwer∕Plenum, Dordrecht∕New York, 1999). [Google Scholar]
- Glanzmann T., Ballini J. P., van den Bergh H., and Wagnieres G., Rev. Sci. Instrum. 70, 4067 (1999). 10.1063/1.1150038 [DOI] [Google Scholar]
- Gregoire J., Edwards W. D., Jeong M. H., Camrud A. R., Lerman A., VanTassel R. A., Bailey K. R., Holmes D. R., and Schwartz R. S., Lasers Surg. Med. 21, 374 (1997). [DOI] [PubMed] [Google Scholar]
- Zhou Q., Xu X., Gottlieb E., Sun L., Cannata J. M., Ameri H., Humayun M. S., Han P., and Shung K. K., IEEE Trans. Ultrason. Ferroelectr. Freq. Control 54, 668 (2007). 10.1109/TUFFC.2007.290 [DOI] [PubMed] [Google Scholar]
- Cannata J. M., Ritter T. A., Chen W. H., Silverman R. H., and Shung K. K., IEEE Trans. Ultrason. Ferroelectr. Freq. Control 50, 1548 (2003). 10.1109/TUFFC.2003.1251138 [DOI] [PubMed] [Google Scholar]
- Sun Y., Liao K. C., Sun Y. H., Park J., and Carcu L., Proc. SPIE 6870, 68700D (2008). 10.1117/12.764013 [DOI] [Google Scholar]
- Baker G., Watkins A. N., Pandey S., and Bright F., Analyst (Cambridge, U.K.) 124, 373 (1999). 10.1039/a806602g [DOI] [Google Scholar]
- Anderssonengels S., Johansson J., Svanberg K., and Svanberg S., Photochem. Photobiol. 53, 807 (1991). [DOI] [PubMed] [Google Scholar]
- Sun Y. H., Liu R., Elson D. S., Hollars C. W., Jo J. A., Park J., Sun Y., and Marcu L., Opt. Lett. 33, 630 (2008). 10.1364/OL.33.000630 [DOI] [PMC free article] [PubMed] [Google Scholar]
- Stephens D. N., Park J., Sun Y., Papaioannou T., and Marcu L., J. Biomed. Opt. (to be published). [DOI] [PMC free article] [PubMed]


