Abstract
The replica exchange statistical temperature Monte Carlo algorithm (RESTMC) is presented, extending the single-replica STMC algorithm [J. Kim, J. E. Straub, and T. Keyes, Phys. Rev. Lett. 97, 050601 (2006)] to alleviate the slow convergence of the conventional temperature replica exchange method (t-REM) with increasing system size. In contrast to the Gibbs–Boltzmann sampling at a specific temperature characteristic of the standard t-REM, RESTMC samples a range of temperatures in each replica and achieves a flat energy sampling employing the generalized sampling weight, which is automatically determined via the dynamic modification of the replica-dependent statistical temperature. Faster weight determination, through the dynamic update of the statistical temperature, and the flat energy sampling, maximizing energy overlaps between neighboring replicas, lead to a considerable acceleration in the convergence of simulations even while employing significantly fewer replicas. The performance of RESTMC is demonstrated and quantitatively compared with that of the conventional t-REM under varying simulation conditions for Lennard-Jones 19, 31, and 55 atomic clusters, exhibiting single- and double-funneled energy landscapes.
INTRODUCTION
Recently, replica exchange method (REM) (or parallel tempering)1, 2 has been widely used in the computer simulations of diverse complex systems such as proteins,3, 4, 5, 6 glasses,7, 8, 9 and atomic clusters,10, 11, 12 where the conventional canonical ensemble sampling struggles to attain ergodicity due to the rugged energy landscape characterized by multiple minima and barriers. In the standard temperature REM (t-REM), a set of statistically independent canonical molecular dynamics (MD) or Monte Carlo (MC) simulations runs in parallel at specified temperatures. The coupling of low and high temperature replicas via exchanges of configurations allows the low temperature replicas to escape from trapped regions more easily, facilitating ergodicity.13, 14
However, the standard t-REM exhibits a severe slowing down of convergence as the dynamic energy range expands with system size. The number of replicas must increase in proportion to f, f being the number of degrees of freedom,15 to maintain sufficient energy overlaps between neighboring replicas for configurational exchanges. The increased number of replicas requires more configurational swaps to sweep a whole temperature space and impairs the convergence. Several sophisticated REM variants have been developed15, 16, 17, 18, 19, 20, 21, 22, 23, 24, 25, 26, 27 to resolve this system size dependence. Fukunishi et al.15 have developed the Hamiltonian REM, which performs replica exchanges between the original system and one with a scaled or deformed Hamiltonian. The underlying idea of the Hamiltonian REM has been further adopted to the generalized parallel tempering16 or q-REM,17 the replica exchange with solute tempering,18 the partial or local REM,19 and the resolution exchange REM.20, 24
An alternative way to alleviate the system size dependence of the t-REM is to incorporate the merit of the generalized ensemble method (GEM)28, 29, 30, 31 into the replica exchange scheme. The use of non-Boltzmann sampling weights in the GEM increases the dynamic sampling range of each replica with a delocalized energy distribution and allows a sufficient energy overlap with far fewer replicas. In previous studies,32, 33, 34, 35 multicanonical (MUCA) sampling has been employed to combine the generalized ensemble sampling with the replica exchange scheme. The multicanonical replica exchange method (MUCAREM) has been shown to produce comparable performance to the conventional t-REM using a half number of replicas.35 However, a prior weight determining process in MUCAREM becomes nontrivial as the system size increases. This hampers the practical use of the method in a rugged energy landscape due to the increased computational burden.
In the present paper, the replica exchange statistical temperature Monte Carlo (RESTMC) algorithm is proposed to improve upon the convergence of the t-REM and to mitigate its system size dependence, by integrating statistical temperature Monte Carlo (STMC) (Ref. 36) and replica exchange. In contrast to the t-REM sampling with the Gibbs–Boltzmann weight at discrete temperatures, RESTMC employs multiple STMC simulations, exploiting overlapping temperature windows. The generalized sampling weights, which correspond to the entropy estimates, are determined automatically via the dynamic modification of the replica-dependent statistical temperatures. The resulting flat energy distribution, which increases the dynamic energy range of each replica and maximizes energy overlaps between neighboring replicas, enables a significant acceleration of the convergence of simulations while employing fewer replicas.
The paper is organized as follows. In Sec. 2, the theoretical formulation of RESTMC is presented with a detailed summary of simulation protocols. In Sec. 3, the global convergence of RESTMC simulations is examined and compared with that of conventional t-REM, for the Lennard-Jones 19, 31, and 55 atom clusters in various simulation conditions. The tunneling times in replica and energy space, heat capacities, and average acceptance probabilities are used for the quantitative performance comparison. Section 4 provides a brief summary and conclusions.
METHODS
REPLICA EXCHANGE STATISTICAL TEMPERATURE MONTE CARLO (RESTMC)
In the REM, multiple Markov chains are run in parallel and configurations are exchanged between neighboring replicas, subject to detailed balance.1, 2 With a given sampling weight wα, α being the replica index, the acceptance probability of configurational exchanges between the αth and α′th replicas is denoted by A,
| (1) |
where Δαα′=ln wα(X′)+ln wα′(X)−ln wα(X)−ln wα′(X′) (α≠α′), X and X′ being the configuration of replicas α and α′, respectively. In the conventional t-REM, sampling of each replica obeys the Gibbs–Boltzmann weight, , βα and U being the inverse temperatures of the αth replica and the potential energy, respectively. Then the exponent Δαα′ in Eq. 1 reduces to the usual form of (βα′−βα)(U′−U), where U′=U(X′) and U=U(X), respectively.
The generalized ensemble method (GEM) is naturally integrated with the REM by utilizing the non-Boltzmann weight wα in Eq. 1, which is designed to sample a more delocalized energy space with an increased dynamic range. The optimal combination of GEM and REM is accomplished by employing a sampling weight which is inversely proportional to the density of states, ,28, 29, 36, 37 Ωα(U) being the partial density of states covering the energy range of the αth replica. The resulting flat energy sampling maximizes energy overlaps between neighboring replicas and allows a sufficient acceptance rate of configurational exchanges with substantially fewer replicas. A problem in this procedure is that the exact density of states is not knowna priori and its estimate must be determined prior to the production run of the replica exchange simulation as in MUCAREM,35 which combines multicanonical sampling with the REM. However, the determination of the multicanonical weight becomes highly nontrivial in rough energy landscapes and requires a long iterative process to get a refined weight in large systems.
Recently, a novel sampling algorithm, statistical temperature Monte Carlo (STMC),36, 38 has been proposed to achieve a flat energy sampling by exploiting the thermodynamic relationship between the statistical temperature T(U) and the density of states Ω(U),39
| (2) |
where S(U)=kB ln Ω(U) (kB=1) is the microcanonical entropy. Instead of direct modification of the density of states, as in Wang and Landau37 sampling, STMC attains a uniform energy distribution by dynamically refining the statistical temperature. Since STMC is designed to generate a flat energy sampling with more rapid convergence and its weight determining process is self-adjusting, the integration of STMC and REM is promising to overcome the system size dependence of the conventional t-REM, avoiding the unknown weight dependence.
The first step of RESTMC is to divide the temperature space into several overlapping windows. Multiple STMC runs are applied to each window via the configurational exchanges between neighboring replicas. In contrast to the t-REM, in which each replica samples a specific temperature with , each replica samples a range of temperature with the generalized sampling weight , being the entropy estimate determined by integrating the replica-dependent statistical temperature estimate .
A unique feature of RESTMC is that the sampling weight of each replica is automatically determined “on the fly” during the replica exchange process, through the dynamic modification scheme for . In an actual simulation, the statistical temperature estimate is represented on the energy grid points, defined as Ui=G(U∕Δα)Δα, with bin size Δα and G(x) returning the nearest integer to x. The statistical temperature is systematically modified every time the system visits the energy state Ui as36, 38
| (3) |
where δfα=ln fα∕(2Δα)⪡1, fα≥1 being the temperature modification factor. Here the prime represents the updated value. The initial modification factor fα and the energy bin size Δα are in general replica-dependent in RESTMC.
A continuum entropy estimate is obtained in RESTMC by integrating the inverse of the statistical temperature estimate. Since is represented on the energy grid, here we utilized the staircase temperature interpolation ,38 θ being the Heaviside step function and , yielding
| (4) |
for , Ul being an arbitrarily defined lower integration limit. As emphasized in Ref. 36, Eq. 4 constitutes a smoothing process that yields the continuum well-behaved sampling weight , even for a noisy TS(U), and also allows an adaptation of a large energy bin size Δα, which is particularly useful with increasing system size.
In RESTMC, the individual STMC simulation of the αth replica proceeds with the acceptance probability
| (5) |
for a trial move from X to X′ and quickly achieves a flat energy distribution at each modification factor fα>1 using the dynamic updating process of Eq. 3. Through iterative refinements with the reduction in the modification factor as , the initial constant is transformed to the true statistical temperature Tα(U). Replica exchanges between neighboring αth and (α+1)th STMC runs are accepted with probability
| (6) |
where . Note that neither the intra- nor inter-replica trial moves obey detailed balance in an early stage of RESTMC, since the entropy estimate is constantly changing with the dynamic modification of at a nonzero δfα in Eq. 3. However, as the modification factor fα approaches unity, the weight becomes frozen and detailed balance is recovered with a flat energy histogram in each replica.
Detailed simulation protocols of RESTMC
The detailed simulation protocols of RESTMC are outlined as follows.
-
(i)The interesting temperature space between Tmin and Tmax is divided into M overlapping temperature windows restricted by (α=1,…,M), in which to allow temperature overlap between αth and (α+1)th replica. The extent of the overlap is adjusted by the temperature overlap parameter κ, which determines the temperature range of each replica as
and(7)
Here Tα (α=1,…,M+1) is the sequentially distributed temperature in an ascending order. Following the original convention of t-REM we used two different allocation schemes depending on the system as Tα=T1(ΔT)α−1 (α>1 and T1=Tmin), ΔT=(Tmax∕Tmin)1∕M in the geometric allocation scheme, and Tα=Tmin+(α−1)ΔT, ΔT=(Tmax−Tmin)∕M in the equidistant allocation scheme, respectively. Subsequently, the individual STMC parameters such as the energy bin size Δα and the initial modification factor fα are determined, and the statistical temperatures are initialized as .(8) -
(ii)
Multiple STMC runs are performed in parallel with the dynamic updates of using Eq. 3 and swapping configurations between neighboring replicas using the acceptance rule of Eq. 6. During the simulation is always maintained as by enforcing or every time the instantaneous statistical temperature exceeds the low or high temperature bound of each replica, respectively. The modification factor is reduced as every fixed MC cycle.
-
(iii)The dynamic update of is terminated and a production run is initiated with a frozen statistical temperature once δfα becomes sufficiently small. After a long production run, multiple STMC simulations are joined to estimate the full density of states using the weighted histogram method40 as
where Pα(U) and Nα correspond to the normalized energy distribution and the number of sampling data in the αth replica. The relative partition function Zα is calculated self-consistently using(9) (10)
We would like to address a minor difference in the reduction scheme of fα between STMC and RESTMC. In the previous single STMC simulation,36, 38 the modification factor has been reduced only when the histogram fluctuation is less than 20% of the mean, following the original convention of Wang and Landau sampling.37 This rather stringent condition has been imposed to obtain a highly refined statistical temperature, which enforces the system to sample the whole dynamic range without trapping, at the reduced modification factor. In contrast, RESTMC does not require a very refined statistical temperature because the dynamic sampling range in each replica is significantly reduced, and the replica exchange process assists the system to avoid trapping even with a rough estimate of . Furthermore, canonical thermodynamic properties can be accurately reproduced by reweighting using Eq. 9 once simulations are performed for a long time with a frozen statistical temperature. Instead of a 20% histogram flatness condition, the periodical reduction scheme, which reduces fα every prefixed MC cycles, is used to shorten the weight determination process.
APPLICATIONS
The performance of RESTMC has been examined in Lennard-Jones clusters LJN with N=19, 31, and 55. LJ atomic clusters have long been used as benchmark systems to test enhanced sampling algorithms.12, 22, 41, 42 The potential energy of LJN is given by , ϵ and σ being units of energy and length, respectively. To prevent cluster evaporation the simulations were performed using a perfectly reflecting, spherical wall with the radius Rc=2σ for N=19, Rc=2.5σ for N=31, and Rc=3σ for N=55.
Lennard-Jones cluster with N=19
We performed several RESTMC simulations with varying numbers of replicas M=3, 5, 10, 15, 20, and 30. Since each replica in RESTMC samples a range of temperatures rather than a specific temperature we applied the equidistant temperature allocation scheme for the generation of Tα (α=1,…,M+1), with the overlap parameter κ=0.1. The energy bin size is chosen as Δα=0.02+0.25(α−1)∕(M−1) to take into account a narrow dynamic range for low temperature replicas. The modification factor fα has been reduced to every 2×10⁶ MC cycles starting from 1.0001 in all simulations. The statistical temperatures are effectively frozen after 2×10⁷ cycles and the production data for the reweighting have been collected for 108 cycles. Here one cycle implies N trial attempts to move each atom in a cluster. The reference thermodynamic data have been determined by the conventional t-REM using 30 replicas in the temperature range 0.01≤T≤0.45 for 109 MC cycles after 2×10⁷ equilibration cycles. The global minimum of LJ19 was used as an initial configuration for all replicas and replica swaps between each pair of adjacent replicas were attempted every one MC cycle in both t-REM and RESTMC. Due to the vanishing acceptance of low temperature replica exchanges with the equidistant allocation, we applied the geometric allocation scheme in the t-REM.
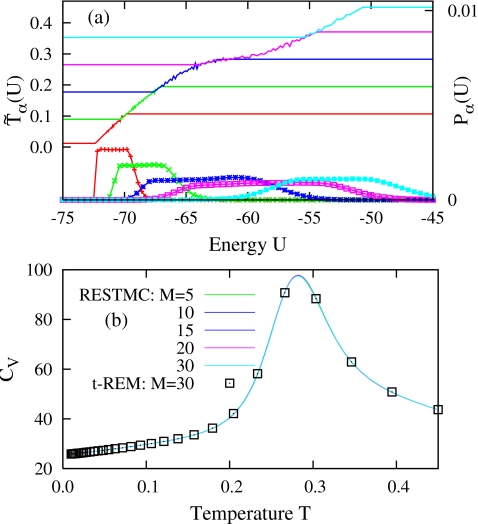
The profiles of the statistical temperatures (α=1,…,M) and the energy distributions Pα(U) of RESTMC with M=5 in Fig. 1a clearly illustrate the characteristic features of our algorithm. The replica-dependent statistical temperatures associated with the different temperature windows join together into a smoothly varying statistical temperature across the overlapping temperature regions. The superimposed statistical temperatures monotonically increase with increasing U and show a plateau around the solid-liquid transition region (T≈0.28). The resulting energy distributions Pα(U) show a flat energy histogram for the extended energy region corresponding to and rapidly decay in both low and high energy regions, where RESTMC samples the canonical ensembles at and , respectively.
Figure 1.
(a) Statistical temperatures, (lines), and energy distributions, Pα(U) (lines points), of RESTMC simulation with M=5 for LJ19 and (b) heat capacities determined by RESTMC simulations with varying M for 108 MC cycles and t-REM with M=30 for 109 MC cycles. α=1–5 in (a) from bottom to top. The magnitude of Pα(U) in (a) has been adjusted for visualization.
The heat capacities determined by the reweighting of RESTMC simulations for 108 MC cycles are compared to those of t-REM in Fig. 1b which is averaged over 109 MC cycles. All RESTMC heat capacities are superimposed on the same curve, regardless of M, and are indistinguishable from those of t-REM for the whole range of temperatures, including the solid-liquid transition region corresponding to the peak in Cv.
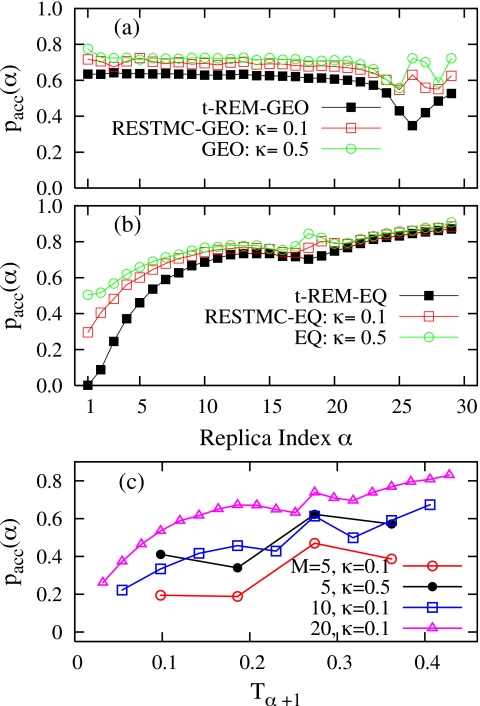
The success of RESTMC stems from its capacity to retain (or enhance) the acceptance of replica exchanges with fewer (or the same) number of replicas. The average acceptance probability pacc(α)=Naccept∕Ntrial, Naccept and Ntrial being the number of accepted and attempted replica swaps in each replica, demonstrates that RESTMC always attains a higher swap acceptance than the t-REM in both geometric and equidistant temperature allocations in Figs. 2a, 2b, respectively. The enhancement of pacc(α) in RESTMC is most prominent in both solid-liquid transition and low temperature regions, where t-REM exhibits a poor acceptance. In accordance with the “incomplete beta-function law,”43, 44 the acceptance in the t-REM is almost uniform for the smoothly varying heat capacity region, but displays a minimum dip around the transition region (α≈26) corresponding to the peak in Cv.45 With the equidistant schedule the acceptance of low temperature replicas rapidly decays to zero, while RESTMC still shows a considerable acceptance even at low temperatures in Fig. 2b. Acceptance is further improved in RESTMC by increasing the overlap parameter κ=0.1 in both temperature schedules.
Figure 2.
Average acceptance probability pacc(α) of RESTMC and t-REM simulations for LJ19 with M=30 employing (a) the geometric and (b) the equidistant temperature allocation scheme, and (c) pacc(α) of RESTMC simulations with varying M and κ. “GEO” in (a) and “EQ” in (b) designate the geometric and the equidistant temperature allocations, respectively.
To investigate the effect of the number of replicas on the acceptance probability, pacc(α) is shown in Fig. 2c as a function of Tα+1 with varying M. With fixed κ=0.1, acceptance gradually declines for the whole temperature region with decreasing M but still remains finite even with M=5. As expected, the acceptance is significantly enhanced by increasing κ from 0.1 to 0.5 for the fixed M=5. It should be also noted that the actual number of accepted replica swaps remains almost same even with a smaller pacc(α) as in M=5 since replica swaps are more frequently attempted for smaller M.
When the replica swaps are well balanced the mean acceptance , can be an effective measure for the sampling performance. However, the convergence of simulations will be poor, even with a moderate , when the replica swaps between one pair of replicas are rarely accepted, forming a bottleneck as in the t-REM with M=30 in Fig. 2a. Therefore, we need a more systematic approach to examine the global convergence of simulations. Here we utilized the number of tunneling events in both replica and energy space as the quantitative measure of sampling performance.12, 28, 46 We calculated the accumulated tunneling events , to quantify how often all replicas make transitions from one end to the other in X space, nαX being the number of tunneling events in the αth replica. A tunneling in replica space occurs when each replica makes a transition, 1→M or M→1, while a tunneling in energy space is counted between two boundary energies.
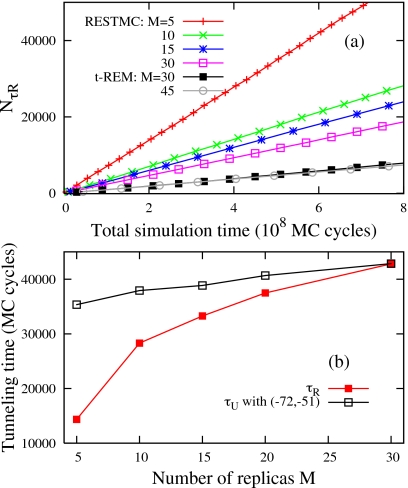
The accumulated tunneling events in replica space NτR increase linearly as a function of MC cycles in both RESTMC and t-REM simulations [see Fig. 3a]. This implies that the mean tunneling time for 1→M or M→1 is almost constant throughout the simulations. The tunneling events in RESTMC with M=30 are twice as frequent as those of the t-REM. Furthermore, NτR in RESTMC rapidly grows with decreasing M, while it does not show any noticeable change from M=45 to 30 in the t-REM. The comparison of the mean tunneling time τR, which corresponds to the inverse of the linear slope in Fig. 3a, reveals that the sampling speed of RESTMC with M=5 is seven times greater than that of the t-REM with M=30. More frequent attempts of replica sweeps with a finite pacc(α) in Fig. 2c greatly shortens τR with decreasing M.
Figure 3.
(a) Accumulated tunneling events in replica space of RESTMC and t-REM simulations and (b) mean tunneling times in replica and energy space of RESTMC simulations as a function of M. All RESTMC simulations use the equidistant temperature schedule with κ=0.1. τR=1.01×10⁵ and τU=1.05×10⁵ MC cycles for the t-REM with M=30.
We also calculated the mean tunneling time τU in energy space, by counting tunneling events between two boundary energies (−72 and −51), roughly corresponding to the internal energies at Tmin and Tmax, respectively. In both RESTMC and t-REM, τR≈τU with M=30. However, τU is significantly longer than τR with decreasing M in RESTMC, implying that some replica swaps do not contribute to the effective acceleration in the energy or configuration sampling. In comparison to the factor of seven acceleration in replica space, the acceleration in energy space is a factor of three in RESTMC with M=5. The more frequent exchange attempts at smaller M induce recurring replica swaps before exchanged configurations diffuse and relax into energy regions beyond the overlapping temperature regions.
Lennard-Jones cluster with N=55
We applied our algorithm to LJ55, which has been the focus of much study as a prototype for the melting of small clusters.47, 48 LJ55 exhibits a strong van der Waals loop (or backbending behavior) in the statistical temperature (or microcanonical caloric curve),47 which is analogous to a first-orderlike phase transition in finite size systems.49, 50, 51 The solid-liquid transition of LJ55 is characterized by the pronounced peak in the heat capacity around T=0.3. Thus LJ55 is a good benchmark system to test the performance of RESTMC in the presence of a strong phase transition and van der Waals loop.
RESTMC simulations are performed for the temperature range between Tmin=0.01 and Tmax=0.45 using a large overlap parameter κ=1.0, with M=5 and 10. The modification factor fα has been periodically reduced to every 5×10⁶ MC cycles, from the initial value of 1.00005, and replica exchanges are attempted every one MC cycles per replica. The energy bin size has been chosen as Δα=0.1+0.4(α−1)∕(M−1). The t-REM has been performed for the same temperature range using 50 replicas with the equidistant temperature schedule, but it is found that pacc(α) of low temperature replicas (α≤3) is far below than 0.1. Production data are collected for 2.5×10⁹ cycles after discarding 5×10⁷ cycles spent for the weight determination in RESTMC and the equilibration in t-REM.
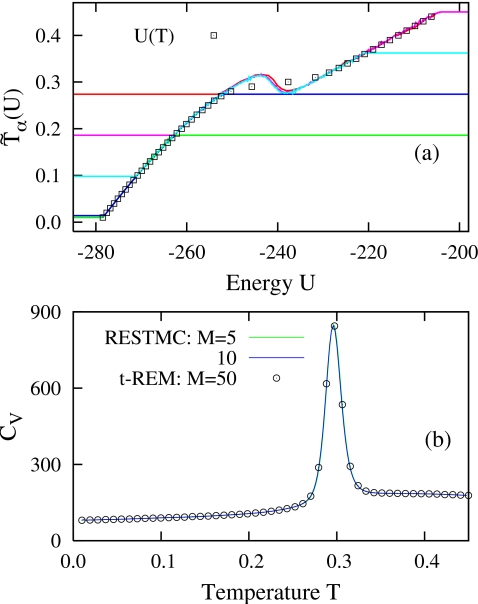
As previously reported,47 the superimposed statistical temperatures in Fig. 4a, determined by RESTMC with M=5, show a clear van der Waals loop around T=0.3 corresponding to the peak in the heat capacity in Fig. 4b. The minor differences among (α=3, 4, and 5) in the backbending region are attributed to the relatively short weight determination time. In contrast to the backbending behavior in T(U), the inverse of the canonical average energy, i.e., , monotonically increases across the transition region, implying that the statistical ensembles are nonequivalent in finite size systems.49 The heat capacities determined by two different RESTMC simulations are superimposed on a single curve and are indistinguishable from those of the t-REM for the full temperature range.
Figure 4.
(a) Statistical temperatures (lines) of RESTMC simulation with M=10 and κ=1.0 for LJ55 and (b) heat capacities of RESTMC simulations with varying M, and t-REM with M=50. α=1–5 in (a) from bottom to top.
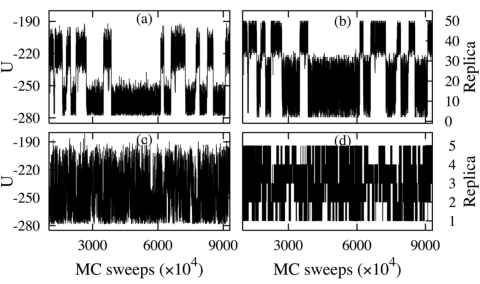
The advantage of the RESTMC algorithm over the t-REM is explicitly demonstrated by comparing trajectories of RESTMC with M=5 and t-REM with M=50. Both energy and replica trajectories of one replica in the t-REM in Figs. 5a, 5b, respectively, reveal that the solidlike and liquidlike states are clearly separated by intermittent transition events and the transition regions associated with the van der Waals loop in T(U) are very rarely sampled. On the other hand, RESTMC shows very frequent transitions in both energy and replica space even with only five replicas, as seen in Figs. 5c, 5d, respectively. The transition regions are much effectively sampled than in the t-REM.
Figure 5.
(a) Energy and (b) replica trajectories of one replica in the t-REM with M=50 and (c) energy and (d) replica trajectories of one replica in RESTMC with M=5.
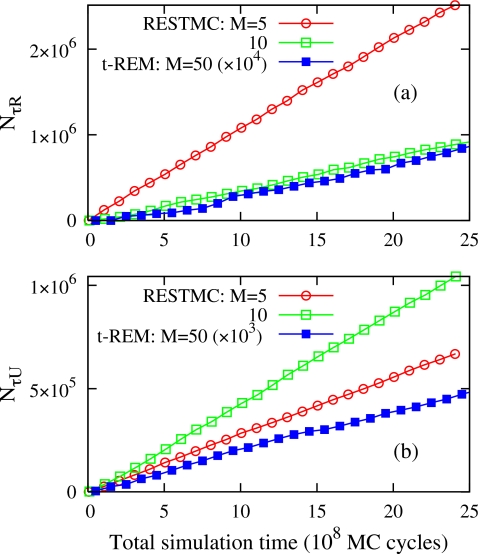
The sampling performance of RESTMC has been examined more quantitatively by comparing the accumulated tunneling events NτR and NτU in Figs. 6a, 6b, respectively. NτU was counted between U=−275 and −210. It is remarkable that the number of transition events in RESTMC simulations with M=5 and M=10 exceed those of the t-REM with M=50 by more than 104 order of magnitude in replica space and 103 in energy space. This dramatic acceleration of tunneling in RESTMC results from the significant reduction in the free energy barrier between the solidlike and liquidlike states. In the presence of backbending behavior in T(U), the extremum condition of the Helmholtz free energy density Fα*(U,T*)=U−T*S(U), in the α*th replica near the transition temperature T*, generates multiple roots, Ui (i=1∼3), satisfying T(Ui)=T* (U1<U2<U3). In the canonical ensemble, the profile of Fα*(U,T*) becomes double well associated with two free energy minima at U1 and U3, and the transition barrier at U2. On the other hand, the free energy density in RESTMC, i.e., becomes almost flat with a correct estimation of . By removing a free energy barrier around a first-orderlike transition region, RESTMC leads to a substantial increase in the frequency of barrier crossing and more effective sampling in the transition region, as seen in Fig. 5c.
Figure 6.
Accumulated tunneling events (a) NτR in replica space and (b) NτU in energy space of RESTMC simulations with M=5 and 10, and the t-REM with M=50.
The ratio NτU∕NτR, falls significantly from 0.8 to 0.27 with a decrease in M from 10 to 5 in LJ55, at the fixed κ=1.0, which means that a speed up of replica exchanges does not necessarily lead to an enhancement in tunneling in energy space, especially for smaller M. This is attributed to the combined effects of the enlarged sampling range of each replica and the increased attempt frequency for replica swaps with decreasing M. Note that configuration swaps between the fourth and fifth replicas in Fig. 4a are mostly accepted for a broad energy range between and , corresponding to the overlapping energy region of both replicas. When the attempt frequency for replica exchanges is too short, the swapped configurations are immediately changed back to the original states via the subsequent replica exchange attempt before they diffuse or relax to other energy regions. These recurring replica exchanges in a short time period might not contribute to enhanced convergence, as demonstrated in Fig. 6b.
Lennard-Jones with N=31
Compared to LJ19 and LJ55, which exhibit single-funneled energy landscapes, LJ31 is computationally more challenging due to the underlying double-funneled landscape associated with the structural transition between the Mackay icosahedral global minimum and the anti-Mackay isomers at low temperatures. This solid-solid transition is signified by a narrow peak in the heat capacity around T≈0.027 (Ref. 22) in addition to a core melting peak around T≈0.32. Since the sampling of the solid-solid transition is very sensitive to the convergence of simulations,11, 12, 22, 52 LJ31 is a good benchmark to test newly developed sampling algorithms in a rugged energy landscape.
RESTMC simulations were performed for the temperature range between Tmin=0.01 and Tmax=0.4 with varying M and κ. The reference thermodynamic data were determined by the conventional t-REM using 35 replicas for 1010 MC cycles for the same temperature range. In all simulations, the geometric temperature allocation scheme was applied and the replica exchanges were attempted every one MC cycle per replica. The energy bin size in RESTMC was chosen as Δα=0.01+0.25(α−1)∕(M−1) and the modification factor fα was periodically reduced to every 5×10⁶ MC cycles starting from 1.0001. A longer time was used for the weigh determination, in view of the difficulty in attaining ergodicity compared to LJ19.
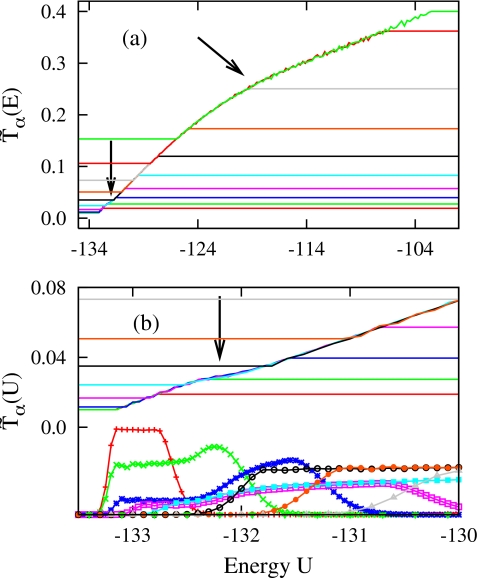
The superimposed statistical temperatures determined by RESTMC with M=10 and κ=1.0, show a smooth single master curve for the whole energy range [see Fig. 7a]. LJ31 shows a rounded slope variation across the solid-liquid transition region near T≈0.3, contrary to LJ19 which shows a sharp slope variation through the melting region. Remarkably, the statistical temperatures present an additional signature around T∼0.028, which is more clearly demonstrated in the magnified view of Fig. 7b. (α=3, 4, and 5) monotonically increases from Tmin, displays a plateau around U≈−132.3, and then increases again. This characteristic variation in the statistical temperatures is associated with the Mackay→anti-Mackay structural transition. Depending on whether each replica samples this low temperature transition or not, the profiles of Pα(U) are quiet different. Both P1(U) (red lines points) and Pα(U) (α≥6) show a typical flat energy sampling for the energy region of , while Pα(U) (α=2∼5), associated with the plateau region in , manifests a strong bias across the transition region.
Figure 7.
(a) Statistical temperatures (lines, α=1∼M from bottom to top) in RESTMC with M=10 and κ=1, employing the geometric temperature schedule for LJ31 and (b) magnified view at low temperatures with Pα(U) (lines points). Arrows in [(a) and (b)] indicate the variations in associated with structural transitions.
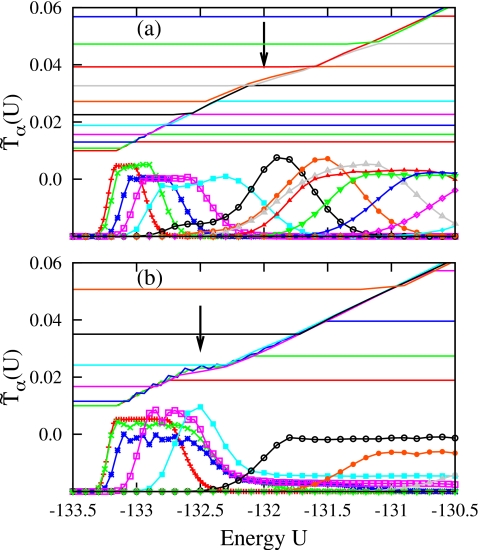
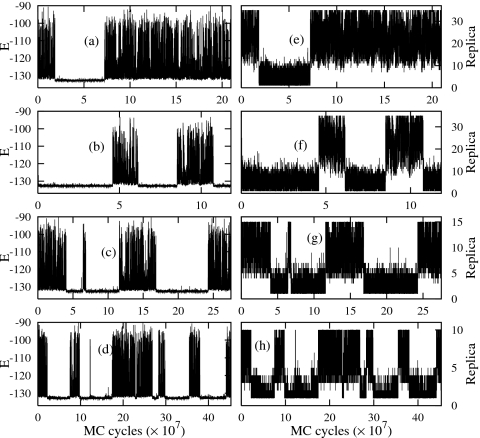
A bias in Pα(U) implies that has not fully converged to the exact T(U), where . Indeed, noticeable variations show up for the solid-solid transition region with different M and κ. As seen in RESTMC with M=20 and κ=0.5 in Fig. 8a, the superimposed shows a rather smooth variation around a higher T∼0.035. The dependence of on the weight refinement process is due to the extremely long equilibration time associated with the Mackay→anti-Mackay transition, which is demonstrated in replica and energy trajectories of RESTMC and t-REM simulations in Fig. 9. Both replica and energy trajectories are highly localized in two separated sampling domains and the transition events are very rare, with a long residence time in each domain. Only two transitions between the Mackay and the anti-Mackay isomers occur during 1.5×10⁸ MC cycles in the t-REM due to the double-funnel landscape.
Figure 8.
(lines) and Pα(U) (lines points) of low temperature replicas in RESTMC simulations with (a) M=20 and κ=0.5, and (b) M=10 and κ=1.0, employing a longer reduction scheme for fα. Arrows indicate the variations in associated with the Mackay→anti-Mackay transition.
Figure 9.
Energy trajectories of an arbitrarily chosen replica in (a) t-REM with M=35, (b) RESTMC with M=35, (c) RESTMC with M=15, and (d) RESTMC with M=10, and replica trajectories in (e) t-REM with M=35, (f) RESTMC with M=35, (g) RESTMC with M=15, and (h) RESTMC with M=10.
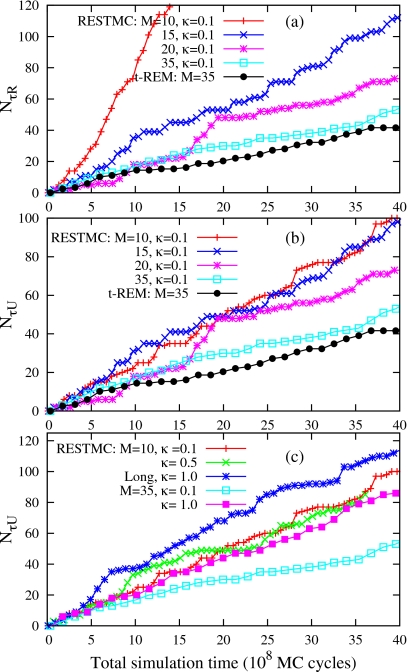
RESTMC shows much more frequent transitions as M decreases, which will be analyzed more quantitatively below in terms of the tunneling events. Roughly, the characteristic tunneling time of the solid-solid transition varies from 107 to 108 MC cycles depending on the weight determination process [see Figs. 12b, 12c]. The statistical temperature of RESTMC employing a longer weight determination process in Fig. 8b, in which fα has been reduced to every 107 MC cycles, shows a plateau around T∼0.022, which is much lower than T∼0.028 in Fig. 7b. We found that the plateau region in systematically moves down to T∼0.022 as the time spent on the weight determination increases in RESTMC.
Figure 12.
Accumulated tunneling events (a) NτR in replica space and (b) NτU in energy space of RESTMC with varying M at fixed κ=0.1, and (c) NτU of RESTMC simulations with varying κ at M=10 and 30. “Long” in (c) denotes RESTMC simulation using two times longer weight determination process.
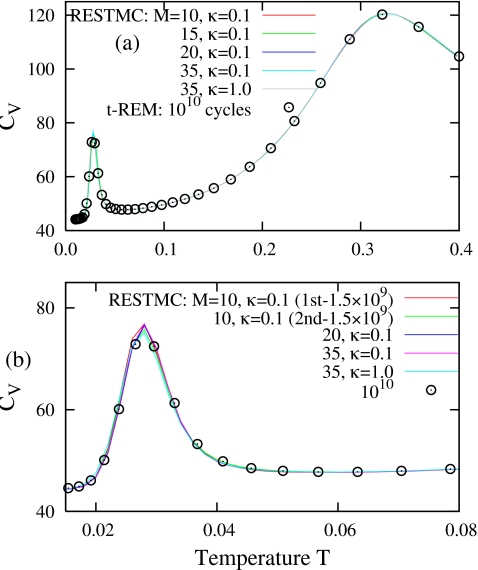
In single-replica STMC, the refinement of the sampling weight plays a central role in obtaining a random walk in energy. However, RESTMC does not need a very refined statistical temperature, since the dynamic sampling range of each replica is significantly decreased, and the replica exchanges assist the system to avoid trapping. Furthermore, the reweighting in Eq. 9 reproduces a correct canonical thermodynamics even with a less refined , since a minor deviation of from the exact T(U) is compensated by a bias in Pα(U) and corrected to give a consistent thermodynamics via reweighting. Indeed, heat capacities from 3.5×10⁹ MC cycle segments of various RESTMC simulations show a perfect coincidence regardless of M and κ in Fig. 10a and are almost indistinguishable from those of t-REM averaged over 9.5×10⁹ MC cycles. The robustness of RESTMC is further illustrated in the magnified view of heat capacities at low temperatures in Fig. 10b. All RESTMC simulations exhibit good agreement even for the low temperature peak region. Furthermore, the heat capacities [I and II in Fig. 10b] computed by a block average of consecutive 1.5×10⁹ MC cycles of RESTMC with M=10 and κ=0.1 are nearly identical, implying that the simulation is well converged.
Figure 10.
(a) Heat capacities determined by RESTMC simulations with various combinations of M and κ for 3.5×10⁹ MC cycles and t-REM with M=35 for 1010 MC cycles, and (b) heat capacities near the Mackay→anti-Mackay transition.
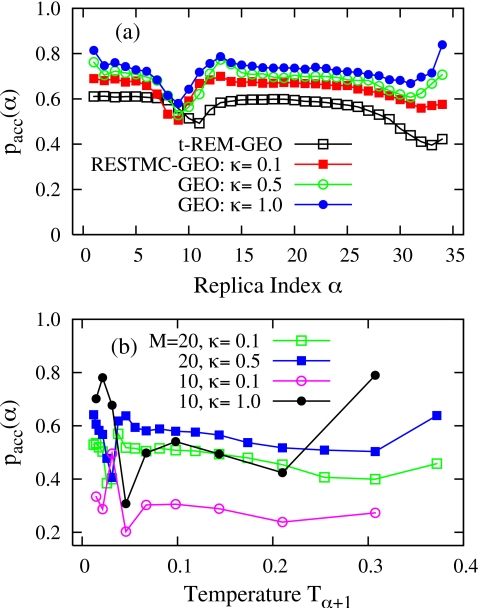
Average acceptance probabilities of both t-REM and RESTMC in Fig. 11a display a minimum dip around the solid-solid and the solid-liquid transition regions, corresponding to α=10 and 33 in the t-REM, and α=9 and 31 in RESTMC with κ=0.1. However, RESTMC always shows a higher pacc(α) for all replicas compared to the t-REM. The use of a large overlap parameter κ consistently increases pacc(α) for the fixed M=35. The enhancement in pacc(α) with increasing κ is remarkable for a smaller M, as in the cases of M=10 and 20 in Fig. 11b.
Figure 11.
Average acceptance probability pacc(α) of the t-REM with M=35, and RESTMC simulations (a) with varying κ at fixed M=35 as a function of α, and (b) with varying κ at M=10 and 20 as a function of Tα+1.
The convergence of simulations of LJ31 is very slow, which makes it difficult to test performance with thermodynamic criteria. The numbers of tunneling events in replica and energy space are more effective as quantitative benchmarks. Compared to the t-REM, both NτR and NτU in Figs. 12a, 12b, respectively, are significantly enhanced in RESTMC with decreasing M at fixed κ=0.1. NτR is roughly three times larger in M=15 and dramatically accelerated with M=10. The enhancement in NτR leads to the increase in NτU in Fig. 12b, computed between −133 and −105. Note that RESTMC simulations with M=10 and 15 show about two times more tunnelings in energy compared to the t-REM. The acceleration of NτU with increasing κ is also illustrated in Fig. 12c, in which NτU is about 2.5 times larger with M=35 and κ=1.0, compared to the t-REM. On the other hand, a further increase in κ from 0.1 to 0.5, with M=10, provides no further enhancement in NτU. RESTMC employing a longer weight determination process with M=10 and κ=1.0 shows a further enhancement in NτU, indicating an intimate connection between the refinement of the statistical temperature and the sampling performance.
Finally, it should be noted that the time dependence of tunneling events in LJ31 show a very different characteristic from that of LJ19 or LJ55 due to the quantitative differences in the underlying energy landscapes. In contrast to the perfect linear relationship between the tunneling events and the simulation time in LJ19 or LJ55 [see Figs. 3a, 6a], both NτR and NτU in LJ31 are quiet irregular with a staircaselike increment. This nonmonotonous diffusion process in both replica and energy space is attributed to the double-funneled energy landscape intrinsic to LJ31, in which intermittent Mackay→anti-Mackay transitions dominate the global sampling dynamics, forming a bottleneck in the convergence of simulations.
CONCLUSION
We developed the RESTMC algorithm by naturally combining STMC (Ref. 36) and REM1, 2 methods. RESTMC samples a range of temperatures rather than a specific single temperature and achieves a flat energy sampling by employing a generalized sampling weight in each replica. The systematic enhancement in energy overlaps between neighboring replicas allows the use of fewer replicas for an increased dynamic sampling range as a function of the system size. Moreover, the sampling weight in each replica is self-adaptively determined via the dynamic updates of the replica-dependent statistical temperature for a faster convergence.
The quantitative performance comparison between RESTMC and the conventional t-REM, in both single- and multifunneled energy landscapes of LJ 19, 55, and 31 atom cluster systems, reveals that RESTMC provides a considerable enhancement in the rate of convergence of simulations accompanied with accelerated tunneling in replica and energy spaces, even when employing a significantly smaller number of replicas. The robustness of RESTMC has been explicitly demonstrated in various simulation conditions by varying number of replicas, temperature allocation schemes, and temperature overlap parameters. In all cases, RESTMC provides the correct canonical thermodynamics via reweighting, even with a less refined sampling weight due to the long equilibration time in the Mackay→anti-Mackay transition region of LJ31.
The extensive increase in the number of replicas in the conventional t-REM is a fundamental problem for the conformational sampling of biomolecules with explicit solvents. Several sophisticated replica exchange methods15, 16, 17, 18, 19, 20, 21, 22, 23, 24, 25, 26, 27 have been developed to resolve this limitation. We expect that the same strategy used in RESTMC represents one alternative route to overcome this limitation with a proper extension to molecular dynamics simulations.
ACKNOWLEDGMENTS
We are grateful to the National Science Foundation (Contract No. CHE-0750309) and the National Institutes of Health (Contract No. RO1 GM076688) for the generous support of our research.
References
- Geyer C. J. and Thompson A., J. Am. Stat. Assoc. 10.2307/2291325 90, 909 (1995). [DOI] [Google Scholar]
- Hukushima K. and Nemoto K., J. Phys. Soc. Jpn. 10.1143/JPSJ.65.1604 65, 1604 (1996). [DOI] [Google Scholar]
- Sugita Y. and Okamoto Y., Chem. Phys. Lett. 10.1016/S0009-2614(99)01123-9 314, 141 (1999). [DOI] [Google Scholar]
- Zhou R. and Berne B. J., Proc. Natl. Acad. Sci. U.S.A. 10.1073/pnas.142430099 99, 12777 (2002). [DOI] [PMC free article] [PubMed] [Google Scholar]
- Garcia A. E. and Onuchic J. N., Proc. Natl. Acad. Sci. U.S.A. 10.1073/pnas.2335541100 100, 13898 (2003). [DOI] [PMC free article] [PubMed] [Google Scholar]
- Paschek D., Gnanakaran S., and Garcia A. E., Proc. Natl. Acad. Sci. U.S.A. 10.1073/pnas.0408527102 102, 6765 (2005). [DOI] [PMC free article] [PubMed] [Google Scholar]
- Yamamoto R. and Kob W., Phys. Rev. E 10.1103/PhysRevE.61.5473 61, 5473 (2000). [DOI] [PubMed] [Google Scholar]
- Flenner E. and Szamel G., Phys. Rev. E 10.1103/PhysRevE.73.061505 73, 061505 (2006). [DOI] [PubMed] [Google Scholar]
- Widom M., Ganesh P., Kazimirov S., Louca D., and Mihalkovic M., J. Phys.: Condens. Matter 10.1088/0953-8984/20/11/114114 20, 114114 (2008). [DOI] [PubMed] [Google Scholar]
- Liu H. and Jordan K. D., J. Phys. Chem. A 10.1021/jp050367w 109, 5203 (2005). [DOI] [PubMed] [Google Scholar]
- Frantsuzov P. A. and Mandelshtam V. A., Phys. Rev. E 10.1103/PhysRevE.72.037102 72, 037102 (2005); [DOI] [PubMed] [Google Scholar]; Mandelshtam V. A. and Frantsuzov P. A., J. Chem. Phys. 10.1063/1.2202312 124, 204511 (2006). [DOI] [PubMed] [Google Scholar]
- Poulain P., Calvo F., Antoine R., Broyer M., and Dugourd Ph., Phys. Rev. E 10.1103/PhysRevE.73.056704 73, 056704 (2006). [DOI] [PubMed] [Google Scholar]
- Berne B. J. and Straub J. E., Curr. Opin. Struct. Biol. 10.1016/S0959-440X(97)80023-1 7, 181 (1997). [DOI] [PubMed] [Google Scholar]
- Newman M. E. J. and Barkema G. T., Monte Carlo Methods in Statistical Physics (Clarendon, Oxford, 1999). [Google Scholar]
- Fukunishi H., Watanabe O., and Takada S., J. Chem. Phys. 10.1063/1.1472510 116, 9058 (2002). [DOI] [Google Scholar]
- Whitfield T. W., Bu L., and Straub J. E., Physica A 10.1016/S0378-4371(01)00656-2 305, 157 (2002). [DOI] [Google Scholar]
- Jang S., Shin S., and Park Y., Phys. Rev. Lett. 10.1103/PhysRevLett.91.058305 91, 058305 (2003). [DOI] [PubMed] [Google Scholar]
- Liu P., Kim B., Friesner R. A., and Berne B. J., Proc. Natl. Acad. Sci. U.S.A. 10.1073/pnas.0506346102 102, 13749 (2005); [DOI] [PMC free article] [PubMed] [Google Scholar]; Liu P., Huang X., Zhou R., and Berne B. J., J. Phys. Chem. B 10.1021/jp060365r 110, 19018 (2006). [DOI] [PMC free article] [PubMed] [Google Scholar]
- Cheng X., Cui G., Hornak V., and Simmering C., J. Phys. Chem. B 10.1021/jp045437y 109, 8220 (2005). [DOI] [PMC free article] [PubMed] [Google Scholar]
- Lyman E., Ytreberg F. M., and Zuckerman D. M., Phys. Rev. Lett. 10.1103/PhysRevLett.96.028105 96, 028105 (2006). [DOI] [PubMed] [Google Scholar]
- Trebst S., Troyer M., and Hansmann U. H. E., J. Chem. Phys. 10.1063/1.2186639 124, 174903 (2006). [DOI] [PubMed] [Google Scholar]
- Calvo F., J. Chem. Phys. 10.1063/1.2036969 123, 124106 (2005). [DOI] [PubMed] [Google Scholar]
- Rick S. W., J. Chem. Phys. 10.1063/1.2431807 126, 054102 (2007). [DOI] [PubMed] [Google Scholar]
- Liu P. and Voth G. A., J. Chem. Phys. 10.1063/1.2408415 126, 045106 (2007). [DOI] [PubMed] [Google Scholar]
- Kamberaj H. and van der Vaart A., J. Chem. Phys. 10.1063/1.2806930 127, 234102 (2007). [DOI] [PubMed] [Google Scholar]
- Brenner P., Sweet C. R., VonHandorf D., and Izaguirre J. A., J. Chem. Phys. 10.1063/1.2436872 126, 074103 (2007). [DOI] [PubMed] [Google Scholar]
- Zhang C. and Ma J., Phys. Rev. E 10.1103/PhysRevE.76.036708 76, 036708 (2007). [DOI] [PMC free article] [PubMed] [Google Scholar]
- Berg B. A. and Celik T., Phys. Rev. Lett. 10.1103/PhysRevLett.69.2292 69, 2292 (1992) [DOI] [PubMed] [Google Scholar]; Berg B. A. and Neuhaus T., Phys. Lett. B 10.1016/0370-2693(91)91256-U 267, 249 (1991). [DOI] [Google Scholar]
- Lee J., Phys. Rev. Lett. 10.1103/PhysRevLett.71.211 71, 211 (1993). [DOI] [PubMed] [Google Scholar]
- Hansmann U. H. E., Chem. Phys. Lett. 10.1016/S0009-2614(97)01198-6 281, 140 (1997) [DOI] [Google Scholar]; Hansmann U. H. E. and Okamoto Y., Phys. Rev. E 10.1103/PhysRevE.56.2228 56, 2228 (1997). [DOI] [Google Scholar]
- Mitsutake A., Sugita Y., and Okamoto Y., Biopolymers 60, 96 (2001). [DOI] [PubMed] [Google Scholar]
- Sugita Y. and Okamoto Y., Chem. Phys. Lett. 10.1016/S0009-2614(00)00999-4 329, 261 (2000). [DOI] [Google Scholar]
- Calvo F. and Doye J. P. K., Phys. Rev. E 10.1103/PhysRevE.63.010902 63, 010902 (2000). [DOI] [Google Scholar]
- Faller R., Yan Q., and de Pablo J. J., J. Chem. Phys. 10.1063/1.1456504 116, 5419 (2002). [DOI] [Google Scholar]
- Mitsutake A., Sugita Y., and Okamoto Y. J. Chem. Phys. 10.1063/1.1555847 118, 6664 (2003); [DOI] [Google Scholar]; Mitsutake A., Sugita Y., and Okamoto Y., J. Chem. Phys. 10.1063/1.1555849 118, 6676 (2003). [DOI] [Google Scholar]
- Kim J., Straub J. E., and Keyes T., Phys. Rev. Lett. 10.1103/PhysRevLett.97.050601 97, 050601 (2006). [DOI] [PubMed] [Google Scholar]
- Wang F. and Landau D. P., Phys. Rev. Lett. 10.1103/PhysRevLett.86.2050 86, 2050 (2001); [DOI] [PubMed] [Google Scholar]; Wang F. and Landau D. P., Phys. Rev. E 10.1103/PhysRevE.64.056101 64, 056101 (2001). [DOI] [PubMed] [Google Scholar]
- Kim J., Straub J. E., and Keyes T., J. Chem. Phys. ; 10.1063/1.2711812 126, 135101 (2007) [DOI] [PubMed] [Google Scholar]; Kim J., Straub J. E., and Keyes T., Phys. Rev. E 10.1103/PhysRevE.76.011913 76, 011913 (2007); [DOI] [PubMed] [Google Scholar]; Kim J. and Keyes T., J. Phys. Chem. B 10.1021/jp072872u 112, 954 (2008). [DOI] [PubMed] [Google Scholar]
- Huang K., Statistical Mechanics (Wiley, New York, 1972). [Google Scholar]
- Ferrenberg A. M. and Swendsen R. H., Phys. Rev. Lett. 10.1103/PhysRevLett.63.1195 63, 1195 (1989). [DOI] [PubMed] [Google Scholar]
- Andricioaei I. and Straub J. E., J. Chem. Phys. 10.1063/1.475203 107, 9117 (1997). [DOI] [Google Scholar]
- Kim J., Fukunishi Y., and Nakamura H., J. Chem. Phys. 10.1063/1.1763841 121, 1626 (2004) [DOI] [PubMed] [Google Scholar]; Kim J., Fukunishi Y., Kidera A., and Nakamura H., J. Chem. Phys. 10.1063/1.1786578 121, 5590 (2004). [DOI] [PubMed] [Google Scholar]
- Kofke D. A., J. Chem. Phys. 10.1063/1.1507776 117, 6911 (2002); [DOI] [Google Scholar]; Kone A. and Kofke D. A., J. Chem. Phys. 10.1063/1.1917749 122, 206101 (2005). [DOI] [PubMed] [Google Scholar]
- Predescu C., Predescu M., and Ciobanu C. V., J. Chem. Phys. 10.1063/1.1644093 120, 4119 (2004). [DOI] [PubMed] [Google Scholar]
- Rathore N., Chopra M., and de Pablo J. J., J. Chem. Phys. 10.1063/1.1831273 122, 024111 (2005). [DOI] [PubMed] [Google Scholar]
- Dayal P., Trebst S., Wessel S., Wurtz D., Troyer M., Sabhapandit S., and Coppersmith S. N., Phys. Rev. Lett. 10.1103/PhysRevLett.92.097201 92, 097201 (2004). [DOI] [PubMed] [Google Scholar]
- Labastie P. and Whetten R. L., Phys. Rev. Lett. 10.1103/PhysRevLett.65.1567 65, 1567 (1990). [DOI] [PubMed] [Google Scholar]
- Lynden-Bell R. M. and Wales D. J., J. Chem. Phys. 10.1063/1.467771 101, 1460 (1994). [DOI] [Google Scholar]
- Gross D. H. E. and Kenney J. F., J. Chem. Phys. 10.1063/1.1901658 122, 224111 (2005). [DOI] [PubMed] [Google Scholar]
- Wales D. J. and Berry R. S., Phys. Rev. Lett. 10.1103/PhysRevLett.73.2875 73, 2875 (1994). [DOI] [PubMed] [Google Scholar]
- Junghans C., Bachmann M., and Janke W., Phys. Rev. Lett. 10.1103/PhysRevLett.97.218103 97, 218103 (2006). [DOI] [PubMed] [Google Scholar]
- Sharapov V. A., Meluzzi D., and Mandelshtam V. A., Phys. Rev. Lett. 10.1103/PhysRevLett.98.105701 98, 105701 (2007). [DOI] [PubMed] [Google Scholar]


