

Abstract
A double layer mesoporous silicon with different pore sizes functions as a nano-reactor that can isolate, filter and quantify the kinetics of enzyme reactions in real-time by optical reflectivity. This tiny reactor may be used to rapidly characterize a variety of isolated enzymes in a label-free manner.
Activity of certain protease enzymes is often an indicator of disease states such as cancer1,2, stroke2, and neurodegeneracy3, and thus, there is a need for rapid assays that can characterize the kinetics and substrate specificity of enzymatic reactions. Nanostructured membranes can efficiently separate biomolecules4 but coupling a sensitive detection method remains difficult. Here we report a single mesoporous nano-reactor that can isolate and quantify in real-time the reaction products of proteases. The reactor consists of two layers of porous films electrochemically prepared from crystalline silicon. The upper layer with large pore sizes traps the protease enzymes and acts as the reactor while the lower layer with smaller pore sizes excludes the large proteins and captures the reaction products. Infiltration of the digested fragments into the lower layer produces a measurable change in optical reflectivity and this allows label-free quantification of enzyme kinetics in real-time within a volume of approximately 5 nanoliters.
A common method to quantify protease activity is based on Fluorescence Resonance Energy Transfer5 (FRET) measurements using fluorescently tagged protein substrates. A major drawback to this approach is that a chemically modified substrate may not exhibit the same reactivity as the native substrate. While fluorescent labels can provide high sensitivity, the attachment of a probe requires an extra step that increases analysis time and complexity. In addition, fluorescent probes can be subject to photochemical degradation and pH-dependent responses. Porous Si-based interferometers operate by measuring a change in refractive index in a volume of solution contained within the porous nanostructure, and they have been shown to provide a simple, label-free method for detection of proteins that minimizes the quantity of reagents used6-9. Recently, the advantage of using more complicated porous Si optical structures to correct for zero-point drift or non-specific binding has been demonstrated10,11. Additionally, recent work has shown how catalytic reactions can be harnessed to improve sensitivity of these nanosensory systems12,13.
The two-layer porous Si nanostructure was prepared by electrochemical etching of silicon in an HF-containing electrolyte. The double layer was then thermally oxidized (600 °C for 1.5 h, in air) to generate a stable silicon oxide (SiO2) surface. The size, shape, and population of the pores in a film are determined by the current, allowing one to “dial in” a specific porosity pattern14. Thus a double layer containing large pores on top of small pores is prepared by decreasing the applied current density midway through the etch, resulting in the abrupt decrease in pore size shown in the cross-sectional scanning electron microscope (SEM) image of Fig. 1. The tunability of the pore etching process provides a convenient means to build such nanostructured matrices that can act as reservoirs15 or size exclusion membranes4,16. The programmability can also be used to build optical structures with useful sensing properties.
Figure 1. Scanning electron micrographs.

(secondary electron image, 5 kV) of the porous Si double-layer structure used in this study. (a) Image showing both porous layers, the top interface, and the Si substrate. (b) Close-up view of the interface between the two porous layers. The 1st (top) layer contains pore sizes ranging from 80-120 nm and acts as a host layer for the protease pepsin in the present work. The 2nd (bottom) layer has pores sizes ranging from 2-10 nm. This lower layer excludes the protease and large proteins such as α-casein (25 kDa) but admits the degradation fragments resulting from action of the enzyme on casein. Top layer is 3.2 micron thick, 75% porous; bottom layer is 4.4 micron thick, 37% porous.
The average diameter of the pores in the present structure is ∼100 nm in the top layer and ∼6 nm in the bottom. Being smaller than the wavelength of visible light, the features in this nanostructure do not scatter light, and the sample displays well-resolved Fabry-Pérot interference fringes in the optical reflectivity spectrum (Fig. 2). The reflectivity spectrum displays an interference pattern that arises from a combination of Fabry-Pérot interference from the very flat interfaces bordering the two layers.
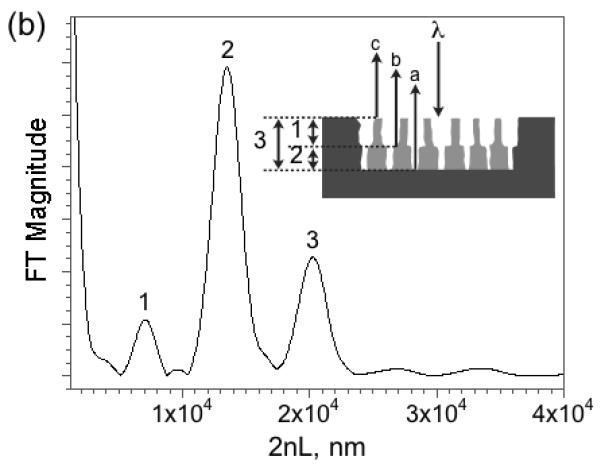
Figure 2. Reflectivity spectrum (a) and corresponding Fourier transform (b) of a porous Si double layer film.
The peaks in the Fourier transform spectrum are assigned to the porous layers indicated in the inset. The three reflected interfering beams are indicated with the letters a, b, and c. Reflectivity trace is measured in air and is not corrected for instrumental spectral response.
It has been shown that the Fourier transform of the reflectivity spectrum yields peaks that correspond to the optical thickness 2niLi of each layer or combination of layers, where ni is the refractive index and Li the thickness of layer i in the stack10,11. The optical spectrum can be used to sense molecules because it is sensitive to the refractive index of any substance filling the pores. Most biomolecules and proteins have a refractive index of ∼1.40, whereas aqueous buffers posses an index close to 1.34. The introduction or removal of a chemical or biochemical species from a porous layer is thus detected as a shift in the value of 2nL9-11,13,17. Differential responses between two stacked layers have been used to correct for zero point drift in the detection of proteins and antibodies10,11. The method is referred to as Reflective Interferometric Fourier Transform Spectroscopy, or RIFTS. For the double-layer structure used in the present work, it is found that the method can also quantify the partitioning of molecules between the two layers, by measurement of the position of the peaks in the Fourier transform spectrum that correspond to each layer.
The nano-reactor layer is loaded with an enzyme by electrostatic adsorption from an aqueous buffer solution at pH 2.0 (Scheme 1). Pepsin was chosen as a model protease because it and its reaction kinetics are well-characterized18. Pepsin is continually cycled through a flow cell containing the porous Si sample for 90 min, at which point the cell is flushed with pure pH 2.0 buffer to remove excess pepsin not adsorbed to the sample. The adsorption of pepsin into the nano-reactor layer is detected as a ∼15 nm increase in the value of 2nL in the Fourier transform spectrum, corresponding to a loading of 200 ng of enzyme in the 5 nanoliter volume probed by the optic (Supplemental Table 1). The surface of oxidized porous Si is negatively charged at pH 2.06, leading to a strong attraction between the surface and pepsin, which carries a net positive charge at this pH19. Because of this non-specific adsorption, the effective concentration of enzyme in the pores is ∼ 2 mM, representing an increase by a factor of 70 relative to the free solution concentration. The relatively large pepsin molecule (35 kDa, 10 × 6 × 20 nm)20 is excluded from the smaller pores in the second layer of the porous Si double layer (Supplemental Figure S1).
Scheme 1. Nanoreactor used to process protein and quantify proteolytic activity.


Active protease (pepsin, blue) is absorbed into the first layer. The assay is then carried out by addition of substrate (α-casein, red). The pores of the second layer are too small to admit the protease or its substrate. However, digestion of the substrate by pepsin produces fragments (green) sufficiently small to infiltrate the 2nd layer. The entire structure is probed by optical reflectivity, allowing detection of the enzymatic reaction in real-time.
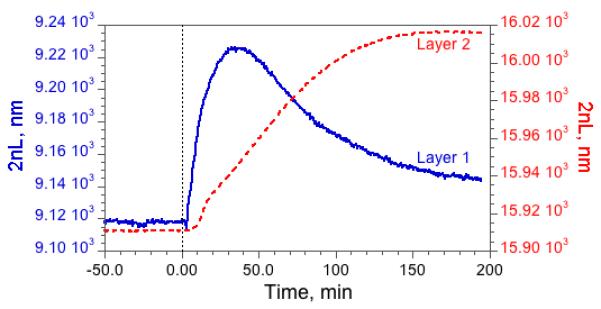
Reactions were carried out in the enzyme-loaded nanoreactor by introducing various substrate/inhibitor combinations into the flow stream of the cell. The reactions were monitored in real-time by acquisition of reflectivity spectra from the double-layer; the Fourier transform provides a direct measure of the amount of protein infiltrated in each layer. Fig. 3 (and Supplemental Figures S1 and S2) shows the effect of introduction of the protein substrate α-casein into the nanoreactor. The top layer of the nanostructure (Layer 1), containing 100 nm-diameter pores, admits α-casein and the value of the optical thickness, 2nL, initially increases as protein accumulates in this layer. The value of 2nL decreases as pepsin digests the protein and the digestion products escape into solution and into Layer 2 of the reactor. The value of 2nL for this lower layer increases as the smaller products of enzymatic digestion diffuse into the ∼6 nm-diameter pores of the lower nanostructure. Control experiments performed with no pepsin (or with an inhibitor present) verify that intact α-casein does not enter the small pores of Layer 2. The digestion results are similar if the enzyme is loaded from a more complex buffer solution resembling Eagle’s medium, that contains a mixture of amino acids, sugars, and vitamins (Supplemental Figure S2). It is important to point out that the temporal behavior of the two layers, in particular the transient of Layer 1, is a characteristic of the action of the enzyme on the substrate. Introduction of small molecules that are not digested by the enzyme produce a signal-time characteristic in both of the layers that are similar to that observed in Layer 2 for the digested substrate.
Figure 3. Optical response of the two layers in a pepsin-loaded nanoreactor upon introduction of α-casein.
The solid trace (“Layer 1”) represents the top layer of the nanostructure containing 100 nm-diameter pores. The dashed trace (“Layer 2”) corresponds to the bottom layer, which contains much smaller 6 nm-diameter pores. A solution of the α-casein protein substrate is introduced to the system at time = 0. The value of 2nL for Layer 1 initially increases as intact casein infiltrates the layer, and then it decreases as casein is digested by pepsin. The value of 2nL for Layer 2 increases as the smaller products of enzymatic digestion diffuse into the small pores of this layer.
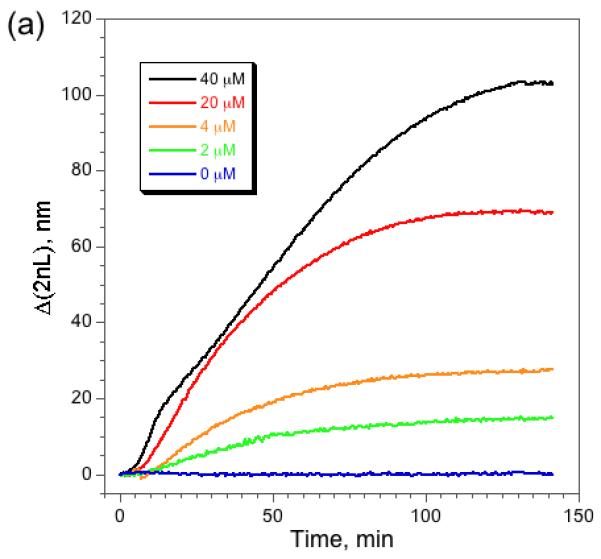
The optical spectra can be used to quantify the kinetics of the enzymatic reaction. Fig. 4a shows Δ2nL vs time traces obtained for several different initial concentrations of α-casein. The response of Layer 2 is monitored; its small pores exclude the intact protein and the protease while admitting the smaller digestion products generated by the action of the protease. The quantity 2nL is proportional to mass8, and so the increasing value of Δ2nL as a function of time depicted in Fig. 4 is indicative of the entry of protein fragments into Layer 2. As expected, the initial slope and the final steady-state value of the traces in Fig. 4a increase with increasing concentration of α-casein. A double reciprocal plot of the steady-state value of Δ(2nL) and [α-casein] is linear (Fig. 4b), consistent with a reaction that is 1st order in substrate.
Figure 4. Kinetics of digestion of α-casein by pepsin in the nanoreactor as a function of casein concentration.
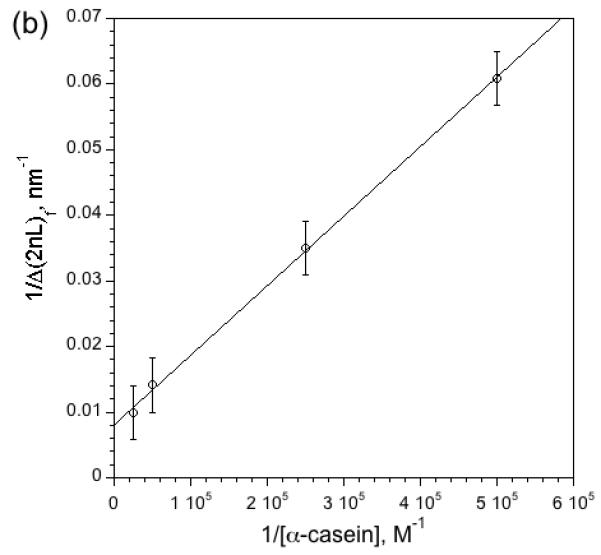

(a) Appearance of digestion products in Layer 2 of the nanoreactor as a function of time, measured as the change in optical thickness of the layer. The action of pepsin on α-casein generates small peptide fragments that enter Layer 2. The quantity Δ2nL represents the change in 2nL relative to its value immediately before introduction of casein, nominally 16,000 nm for this series of experiments. The initial slope of the curves and the steady-state values of Δ(2nL) correlate with the initial concentration of casein used in each experiment. The slight kink in the 40 μM curve at early times is attributed to the very high concentration of substrate, which interferes with diffusion in the micropores of Layer 2. (b) Double reciprocal plot of Δ(2nL)f and [α-casein], where Δ(2nL)f is the final, steady-state value of Δ(2nL) measured 140 min after introduction of α-casein. Each data point represents triplicate measurements.
The data are consistent with the known kinetics of the enzyme in free solution. Initial reaction velocity (Vo) is typically characterized as the mass of product formed per unit time during the initial stage of conversion of substrate to product. In the case of the nano-reactor, the mass of products generated is proportional to the value of Δ(2nL) measured in Layer 2. Vo was obtained by a linear fit of the initial phase of the curves depicted in Fig. 4a. A non-linear least-squares fit of Vo vs concentration of substrate α-casein (Supplemental Fig. S3) yields a value of 0.35 μM/min for the maximum reaction velocity (Vmax) and 18 μM for the Michaelis-Menten constant (Km). These kinetic parameters are somewhat smaller than the literature values for pepsin (Vmax = 1.20-2.69 μM/min; Km = 37-109 μM)21. The enzymatic reaction in the nanoreactor is thus apparently slower than in free solution, which may be a result of the restricted dimensions in the porous matrix or adsorption of substrate to the pore walls.
The aspartic protease inhibitor pepstatin A was used to perform enzymatic inhibition studies. Pepstatin A is a competitive inhibitor of pepsin. The initial rate of digestion of α-casein was quantified using a series of pepsin-infused nano-reactors that were treated with solutions containing various concentrations of α-casein and a fixed concentration of the inhibitor (1μM). A non-linear least-squares fit of Vo vs. α-casein in the presence of 1μM pepstatin A (Supplemental Fig. S4 and S5) yields a rate of competitive inhibition Ki of 84 nM, somewhat larger than the literature value of 1 nM22. The larger value of Ki relative to the literature is attributed to adsorption of the inhibitor in the porous nanostructure, leading to a reduction in the effective concentration of inhibitor available to the enzyme.
In summary, a self-reporting nano-reactor that is able to capture enzymes, host a catalytic reaction in a mesoporous cavity, isolate and quantify the reaction products, and provide information on the reaction kinetics in a volume of ∼5 nanoliters has been demonstrated. This work provides a general method to quantify kinetics of an immobilized enzymatic reaction. The specific example in this work involved quantification of protease activity, but the approach is applicable to a range of reactions of interest to the high-throughput analytical and synthetic communities, such as DNA amplification, polymerization, enzyme-linked assays, and protein purification.
Methods
Sample Preparation
Porous Si samples were prepared by anodic electrochemical etch of highly B-doped (p++-type), (100)-oriented silicon wafers with resistivity of ∼ 1 mΩ-cm (Siltronix), in a 3:1 (v/v), 49% aqueous HF/ethanol solution. A Teflon etching cell that exposed 1.2 cm2 of the silicon wafer was employed. The exposed polished surface was etched at a current density of 707 mA/cm2 for 10 s followed by a current density of 44 mA/cm2 for 170 s. Samples were then thermally oxidized at 600 °C for 1.5 h. Pepsin (150 units/mg solid, Sigma Chemicals) was dissolved in a 10 mM pH 2.0 buffer containing phosphoric acid (99.9%, Aldrich Chemicals), sodium phosphate monohydrate (enzyme grade, Fisher chemicals), HCl (EM Science), and de-ionized water. The nano-reactor was loaded with pepsin by cycling 3.5 mL of a pH 2.0 solution 28 μM in pepsin through a flow cell fitted with a 1 cm-diameter optical window through which the reflectivity spectrum of the nano-reactor could be monitored.
Enzymatic Digestion Procedure
The α-casein substrate (Sigma-Aldrich Chemicals) was dissolved in pH 2.0 buffer and heated to 37 °C until fully dissolved. For each experiment, 3.0 mL of solution of the requisite concentration was cycled through an airtight flow-cell. For the enzyme inhibition studies, pepstatin A inhibitor (Sigma-Aldrich Chemicals) was dissolved in a minimal amount of 9:1 methanol: acetic acid (v/v) solution. The solution was diluted with pH 2.0 aqueous buffer to the desired concentration. The pepsin-loaded nano-reactor in the flow cell was then incubated with a continuously flowing solution of the inhibitor and the casein substrate.
Data acquisition and analysis
Interferometric reflectance spectra were collected by using an Ocean Optics S-2000 CCD spectrometer fitted with a microscope objective lens coupled to a bifurcated fiber optic cable. A tungsten light source was focused onto the center of the porous Si sample surface with a spot size approximately 1.5 mm in diameter. Both the illumination of the surface and the detection of the reflected light were performed along an axis coincident with the surface normal. Reflectivity spectra were recorded in the wavelength range 400-1000 nm, with a spectral acquisition time of 20 ms. Typically 100 spectral scans (2 s total integration time) were averaged for Fourier transform processing. Details of the Fourier transform and spectral data fitting routines are published elsewhere11.
Enzyme Kinetics
Initial reaction velocity (Vo) was obtained using a linear fit of the Δ2nL vs time plot, obtained from Layer 2 of the structure. Data acquired between 1200 and 1800 s after addition of α-casein were used in the fit (the dead-time in the tubing leading to the cell was ∼360 s). The initial rates for each concentration of substrate were plotted against the concentration of α-casein. A non-linear least-squares fit was used to determine the Michaelis-Menten parameters. It was assumed that the steady-state value of Δ2nL is directly proportional to the steady-state product concentration in the layer. The Vmax value from the least-squares fit is then converted from units of Δ2nL second-1 to μM min-1 using the linear relationship of Fig. 4b (see Supplemental materials). For inhibition studies, initial velocity rates were determined by a linear fit of the Δ2nL-time plots at the point of inflection (typically 360 s after addition of substrate). Errors quoted are > 95% CI.
Supplementary Material
Acknowledgements
This material is based upon work supported by the National Science Foundation under Grant No. DMR-0806859, by the Hitachi Chemical Research Center, and by the UC Discovery Industry-University Cooperative Research Program. M. J. S. is a member of the Moores UCSD Cancer Center and the UCSD NanoTUMOR Center under which this research was conducted and partially supported by NIH grant U54 CA 119335. M. M. O. thanks the Department of Education, Graduate Assistance in Areas of National Need (GANN) program (P200A030163) for a pre-doctoral fellowship. The authors thank Melanie Oaks of the Hitachi Chemical Research Center for experimental assistance in obtaining the SEM images.
Footnotes
Additional information Supplementary information accompanies this paper at www.nature.com/naturenanotechnology.
Reprints and permission information is available online at http://npg.nature.com/reprintsandpermissions/.
REFERENCES
- 1.Coussens Lisa M., Fingleton Barbara, Matrisian Lynn M. Matrix metalloproteinase inhibitors and cancer--trials and tribulations. Science. 2002;295(5564):2387. doi: 10.1126/science.1067100. [DOI] [PubMed] [Google Scholar]
- 2.Puente Xose S., Sanchez Luis M., Overall Christopher M., Lopez-Otin Carlos. Human and mouse proteases: a comparative genomic approach. Nat Rev Genet. 2003;4(7):544. doi: 10.1038/nrg1111. [DOI] [PubMed] [Google Scholar]
- 3.Esler WP, Wolfe MS. A portrait of Alzheimer secretases--new features and familiar faces. Science. 2001;293(5534):1449. doi: 10.1126/science.1064638. [DOI] [PubMed] [Google Scholar]; Vassar R, et al. Beta-secretase cleavage of Alzheimer’s amyloid precursor protein by the transmembrane aspartic protease BACE. Science. 1999;286(5440):735. doi: 10.1126/science.286.5440.735. [DOI] [PubMed] [Google Scholar]
- 4.Striemer CC, Gaborski TR, McGrath JL, Fauchet PM. Charge- and size-based separation of macromolecules using ultrathin silicon membranes. Nature. 2007;445(7129):749. doi: 10.1038/nature05532. [DOI] [PubMed] [Google Scholar]
- 5.Jones LJ, et al. Quenched BODIPY dye-labeled casein substrates for the assay of protease activity by direct fluorescence measurement. Anal. Biochem. 1997;251(2):144. doi: 10.1006/abio.1997.2259. [DOI] [PubMed] [Google Scholar]; Wiesner R, Troll W. A new assay for proteases using fluorescent labeling of proteins. Anal. Biochem. 1982;121(2):290. doi: 10.1016/0003-2697(82)90482-1. [DOI] [PubMed] [Google Scholar]
- 6.Schwartz Michael P., Alvarez Sara D., Sailor Michael J. A porous SiO2 Interferometric Biosensor for quantitative determination of protein interactions: binding of protein A to immunoglobulins derived from different species. Anal. Chem. 2007;79:327. doi: 10.1021/ac061476p. [DOI] [PMC free article] [PubMed] [Google Scholar]
- 7.Park JS, et al. Enhancement of sensitivity in interferometric biosensing by using a new biolinker and prebinding antibody. J. Microbiol. Biotechnol. 2006;16(12):1968. [Google Scholar]; Tinsley-Bown A, et al. Immunoassays in a porous silicon interferometric biosensor combined with sensitive signal processing. Phys. Status Solidi A-Appl. Mat. 2005;202(8):1347. [Google Scholar]
- 8.Dancil K-PS, Greiner DP, Sailor MJ. A porous silicon optical biosensor: detection of reversible binding of IgG to a protein A-modified surface. J. Am. Chem. Soc. 1999;121(34):7925. [Google Scholar]
- 9.Lin VS-Y, et al. A porous silicon-based optical interferometric biosensor. Science. 1997;278(5339):840. doi: 10.1126/science.278.5339.840. [DOI] [PubMed] [Google Scholar]
- 10.Pacholski Claudia, et al. Reflective interferometric Fourier transform spectroscopy: a self-compensating label-free immunosensor using double-layers of porous SiO2. J. Am. Chem. Soc. 2006;128:4250. doi: 10.1021/ja056702b. [DOI] [PubMed] [Google Scholar]
- 11.Pacholski Claudia, et al. Biosensing using porous silicon double-layer interferometers: reflective interferometric Fourier transform spectroscopy. J. Am. Chem. Soc. 2005;127(33):11636. doi: 10.1021/ja0511671. [DOI] [PMC free article] [PubMed] [Google Scholar]
- 12.Kilian Kristopher A., et al. Peptide-modified optical filters for detecting protease activity. ACS Nano. 2007;1(4):355. doi: 10.1021/nn700141n. [DOI] [PubMed] [Google Scholar]
- 13.Orosco Manuel M., Pacholski Claudia, Miskelly Gordon M., Sailor Michael J. Protein-coated porous silicon photonic crystals for amplified optical detection of protease activity. Adv. Mater. 2006;18:1393. [Google Scholar]
- 14.Zhang XG. Morphology and formation mechanisms of porous silicon. J. Electrochem. Soc. 2004;151(1):C69. [Google Scholar]
- 15.Leong WY, Loni A, Canham LT. Electrically enhanced erosion of porous Si material in electrolyte by pH modulation and its application in chronotherapy. Phys. Status Solidi A-Appl. Mat. 2007;204(5):1486. [Google Scholar]; Thomas J. Christopher, Pacholski Claudia, Sailor Michael J. Delivery of nanogram payloads using magnetic porous silicon microcarriers. Lab Chip. 2006;6(6):782. doi: 10.1039/b516121e. [DOI] [PubMed] [Google Scholar]
- 16.Collins Boyce E., Dancil Keiki-Pua, Abbi Gaurav, Sailor Michael J. Determining protein size using an electrochemically machined pore gradient in silicon. Adv. Funct. Mater. 2002;12(3):187. [Google Scholar]
- 17.Schwartz Michael P., et al. The smart petri dish: A nanostructured photonic crystal for real-time monitoring of living cells. Langmuir. 2006;22:7084. doi: 10.1021/la060420n. [DOI] [PMC free article] [PubMed] [Google Scholar]
- 18.Fruton Joseph S. Active site of pepsin. Acc. Chem. Res. 1974;7(8):241. [Google Scholar]; Inouye Ken, Fruton Joseph S. Inhibition of pepsin action. Biochemistry. 1968;7(5):1611. doi: 10.1021/bi00845a001. [DOI] [PubMed] [Google Scholar]
- 19.Malamud Daniel, Drysdale James W. Isoelectric points of proteins: a table. Anal. Biochem. 1978;86(2):620. doi: 10.1016/0003-2697(78)90790-x. [DOI] [PubMed] [Google Scholar]
- 20.Fujinaga M, et al. Crystal structure of human pepsin and its complex with pepstatin. Protein science : a publication of the Protein Society. 1995;4(5):960. doi: 10.1002/pro.5560040516. [DOI] [PMC free article] [PubMed] [Google Scholar]
- 21.Sachdev Goverdhan P., Fruton Joseph S. Kinetics of action of pepsin on fluorescent peptide substrates. Proc. Nat. Acad. Sci. 1975;72(9):3424. doi: 10.1073/pnas.72.9.3424. [DOI] [PMC free article] [PubMed] [Google Scholar]
- 22.Cancilla Mark T., Leavell Michael D., Chow Jason, Leary Julie A. Mass spectrometry and immobilized enzymes for the screening of inhibitor libraries. Proc. Nat. Acad. Sci. 2000;97(22):12008. doi: 10.1073/pnas.220403997. [DOI] [PMC free article] [PubMed] [Google Scholar]
Associated Data
This section collects any data citations, data availability statements, or supplementary materials included in this article.