

Abstract
Asymmetric cell division of radial glial progenitors produces neurons while allowing self-renewal; however, little is known about the mechanism that generates asymmetry in daughter cell fate specification. Here we found that mammalian partition defective protein 3 (mPar3), a key cell polarity determinant, exhibits dynamic distribution in radial glial progenitors. While it is enriched at the lateral membrane domain in the ventricular endfeet during interphase, mPar3 becomes dispersed and shows asymmetric localization as cell cycle progresses. Either removal or ectopic expression of mPar3 prevents radial glial progenitors from dividing asymmetrically yet generates different outcomes in daughter cell fate specification. Furthermore, the expression level of mPar3 affects Notch signaling, and manipulations of Notch signaling or Numb expression suppress mPar3 regulation of radial glial cell division and daughter cell fate specification. These results reveal a critical molecular pathway underlying asymmetric cell division of radial glial progenitors in the mammalian neocortex.
Introduction
Radial glial cells constitute a major population of neural progenitor cells that give rise to neurons in the mammalian embryonic neocortex (Anthony et al., 2004; Malatesta et al., 2000; Miyata et al., 2001; Noctor et al., 2001; Noctor et al., 2004; Tamamaki et al., 2001). The division of radial glial progenitors can be either symmetrical or asymmetrical, which is reflected by the fate of the two daughter cells. Prior to the peak phase of neurogenesis (around embryonic day 13 to 18, E13-E18, in mice), radial glial cells largely divide symmetrically to amplify the progenitor cell population. However, during the peak phase of neurogenesis, they predominantly divide asymmetrically to both self-renew, and to produce either a neuron or an intermediate progenitor cell (IPC) (Chenn and McConnell, 1995; Miyata et al., 2004; Noctor et al., 2004; Noctor et al., 2008; Takahashi et al., 1996). While the neurons migrate radially to form the cortical plate (CP) (i.e. the future neocortex), the IPCs undergo additional symmetric division(s) to generate neurons that ultimately migrate into the CP (Haubensak et al., 2004; Miyata et al., 2004; Noctor et al., 2008). Therefore, asymmetric cell division of radial glial cells accounts for nearly all neurogenesis in the developing mammalian neocortex.
Despite its critical importance, the molecular mechanisms that regulate asymmetric cell division of radial glial progenitors are poorly understood. Extensive studies in Drosophila and C. elegans have revealed that a key feature of asymmetric cell division is the unequal distribution and inheritance of cell fate determinants during mitosis, which critically depends on the establishment of cell polarity in dividing progenitor cells (Buchman and Tsai, 2007; Doe et al., 1998; Fishell and Kriegstein, 2003; Jan and Jan, 2001; Knoblich, 2008; Lechler and Fuchs, 2005; Wodarz and Huttner, 2003). In the Drosophila central nervous system, a neuroblast (i.e. neural progenitor cell) delaminates from the neuroepithelium and divides asymmetrically to produce a large cell, which remains a neuroblast, and a small precursor cell, the ganglion mother cell (GMC). GMCs in turn divide asymmetrically to give rise to neurons and glia. It is well-established that the polarized distribution of cell fate determinants in dividing neuroblasts relies on the proper functioning of a group of proteins that include Bazooka (Drosophila Par3, partition defective protein 3, homolog), Par6, atypical protein kinase C (aPKC), Inscuteable, Partner of Inscuteable (Pins) and Gαi. Of these, Bazooka, Par6 and aPKC together make up a core protein complex – the Par protein complex – that is at the top of a genetic hierarchy for specifying the polarity of neuroblasts and ensuring their asymmetric cell division (Johnson and Wodarz, 2003).
The Par protein complex was initially identified in C. elegans (Kemphues, 2000; Kemphues et al., 1988) and found to be highly conserved across species including mammals (Izumi et al., 1998; Joberty et al., 2000; Johansson et al., 2000; Lin et al., 2000). Recently, the mammalian Par (mPar) protein complex has been implicated in regulating neocortical development (Costa et al., 2008; Manabe et al., 2002); however, it is unclear whether this polarity protein complex regulates asymmetric cell division of radial glial progenitors. Furthermore, Notch signaling activity, a key regulator of neocortical neurogenesis (Gaiano et al., 2000; Li et al., 2003; Petersen et al., 2002; Petersen et al., 2004; Yoon and Gaiano, 2005; Zhong et al., 1996), has been recently suggested to be differentially regulated in radial glial progenitors versus differentiating cells in the developing neocortex (Mizutani et al., 2007; Yoon et al., 2008); yet, how this differential regulation of Notch signaling activity comes about is poorly understood. Here, we set out to determine whether mammalian Par3 (mPar3), a key component of the mPar protein complex (Izumi et al., 1998; Joberty et al., 2000; Johansson et al., 2000; Lin et al., 2000), specifies the polarity of dividing radial glial cells and differentially regulates Notch signaling activity in the two daughter cells, thereby ensuring distinct cell fate specification during the peak phase of neocortical neurogenesis.
Results
Dynamic distribution of mPar3 in radial glia progenitors
To investigate mPar3 function, we first examined the subcellular distribution of mPar3 in radial glial cells during the peak phase of neurogenesis using an antibody raised against mPar3 (Supplementary Fig. 1). As previously reported (Costa et al., 2008; Kosodo et al., 2004; Manabe et al., 2002), mPar3 was concentrated at the luminal surface of the ventricular zone (VZ) (Fig. 1A, left arrow). Interestingly, when examined en face from the ventricle, mPar3 showed a distinct, ring-like expression pattern (Fig. 1A, right). Radial glial cells in the VZ undergo interkinetic nuclear migration as the cell cycle progresses (Sauer, 1935). During interphase, their cell bodies are located away from the luminal surface of the VZ with two processes extending out, the radial glial fiber that reaches the pia and the ventricular endfoot that reaches the luminal surface of the VZ. Evidence from previous studies suggest that the ventricular endfeet of neighboring radial glial cells form junctions at the contacts of the lateral membrane domains, which are manifested in ring-like structures at the luminal surface of the VZ (Aaku-Saraste et al., 1996; Astrom and Webster, 1991; Chenn et al., 1998; Manabe et al., 2002; Rasin et al., 2007; Shoukimas and Hinds, 1978). To test whether mPar3 is localized at the junctions, we examined the co-localization of mPar3 with several junctional proteins including ZO-1 (Fig. 1B), β-catenin (Fig. 1C), and N-cadherin (data not shown). We found that mPar3 was co-localized with ZO-1, but to a much less extent with N-cadherin or β-catenin. These results indicate that mPar3 is enriched at the ZO-1-expressing lateral membrane domain that is apical to the region where β-catenin and N-cadherin are localized in the ventricular endfeet of interphase radial glial cells (Fig. 1D).
Figure 1. Selective localization of mPar3 at ZO-1-expressing lateral membrane region in the ventricular endfeet of radial glial progenitor cells during interphase.
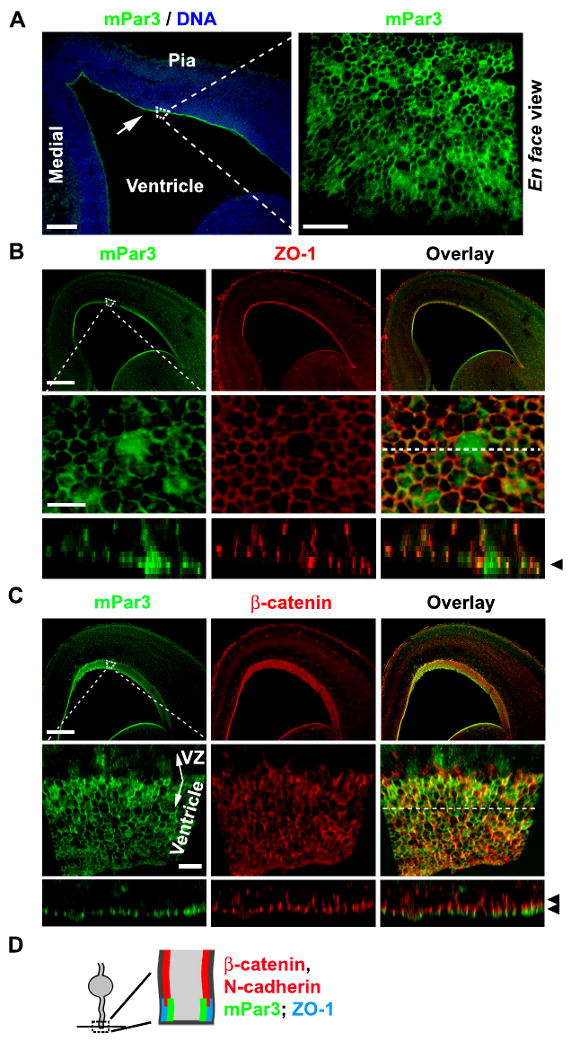
(A) Images of E14.5 cortices immunostained with the mPar3 antibody (green) and counterstained with a DNA dye (blue). The arrow indicates the enrichment of mPar3 at the luminal surface of the VZ. A high magnification ventricle en face image of mPar3 is shown to the right (dashed area). Scale bars: 250 μm and 10 μm. (B) Images of E14.5 cortices immunostained with the antibodies against mPar3 (green) and ZO-1 (red). High magnification ventricle en face images (dashed area) are shown in the middle. Cross-section images at the location of the broken line are shown at the bottom. Note that mPar3 largely co-localizes with ZO-1 at the lateral membrane domain in the ventricular endfeet (arrowhead). Scale bars: 250 μm and 5 μm. (C) Images of E14.5 cortices immunostained with the antibodies against mPar3 (green) and β-catenin (red). High magnification ventricle en face images (dashed area) are shown in the middle. Cross-section images at the location of the broken line are shown at the bottom. Note that mPar3 is mostly apical to β-catenin (arrowheads). Scale bars: 250 μm and 10 μm. (D) A diagram that illustrates the subcellular localization of mPar3, ZO-1, N-cadherin and β-catenin in the ventricular endfeet of radial glial cells during interphase.
We next assessed the subcellular distribution of mPar3 in dividing radial glial cells, which is more critical for regulating daughter cell fate specification. During G2 phase, the cell bodies of mitotically active radial glial cells descend through the VZ; once they arrive at the luminal surface of the VZ, radia glial cells enter mitosis. To precisely locate mPar3 in dividing radial glial cells, we took advantage of the antibody against phosphorylated Vimentin (Ph-Vim), which specifically recognizes dividing progenitor cells in the developing neocortex and reveals their morphology (Kamei et al., 1998; Noctor et al., 2002; Rasin et al., 2007) (Fig. 2A). Interestingly, whereas mPar3 showed preferential localization at ring-like structures in Ph-Vim-negative cells, it exhibited more diffuse distribution in Ph-Vim-positive cells, as evident from the ventricle en face images (Fig. 2B) and the cross-section images (Fig. 2 C and D). These results suggest that mPar3 is delocalized from the ZO-1-expressing junction and becomes dispersed as radial glial cells enter mitosis. This distinct pattern of mPar3 distribution in radial glial cells during interphase and mitosis was also observed when recombinant mPar3 proteins tagged with enhanced green fluorescence protein (EGFP), EGFP-mPar3, was transiently expressed in the developing neocortex (Supplementary Fig. 2). It is worth noting that while the recombinant EGFP-mPar3 protein exhibits overall similar subcellular distribution in radial glial progenitor cells during interphase and mitosis as the endogenous mPar3 protein, it leads to a change in the daughter cell fate specification (see later results), thereby precluding its use in recapitulating the normal segregation of mPar3 in dividing radial glial cells during mitosis.
Figure 2. Asymmetric distribution of mPar3 in dividing radial glial cells in anaphase/telophase.
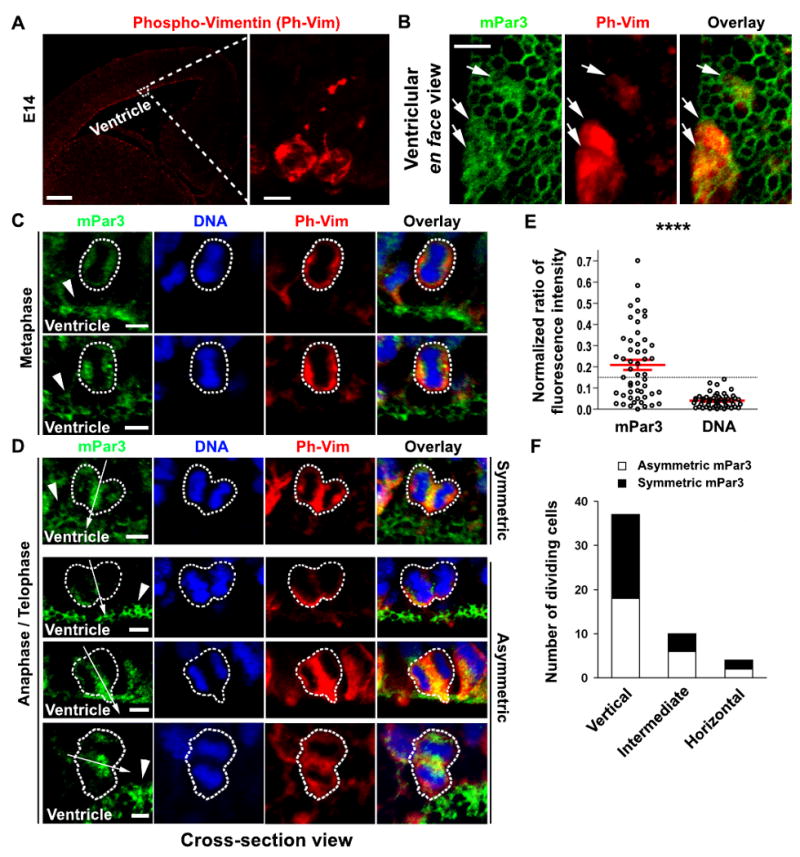
(A) Images of E14.5 cortices immunostained with the antibody against phospho-Vimentin (Ph-Vim, red). High magnification image of the outlined region is shown to the right. Note that the Ph-Vim antibody selectively labels dividing cells in the developing neocortex and reveals their morphology. Scale bars: 250 μm and 10 μm. (B) High magnification ventricle en face images of mPar3 (green) and Ph-Vim (red) at the luminal surface of the VZ. Note a correlation between diffuse mPar3 immunofluorescence and Ph-Vim staining (arrows). Scale bar: 5 μm. (C) Subcellular localization of mPar3 (green) in metaphase radial glial cells labeled by Ph-Vim (red) with condensed DNA staining (blue). Arrowheads indicate mPar3 expression in interphase radial glial cells at the luminal surface of the VZ. Scale bar: 5 μm. (D) Subcellular localization of mPar3 (green) in anaphase/telophase radial glial cells labeled by Ph-Vim (red) with condensed, separated chromosomes (blue). Arrows indicate the cleavage plane and arrowheads indicate mPar3 expression in nearby interphase radial glial cells. Broken lines indicate the contour of dividing radial glial cells. Note that mPar3 is either symmetrically or asymmetrically distributed with respect to the cleavage plane. Scale bar: 5 μm. (E) Quantification of the normalized ratio of mPar3 immunofluorescence and DNA labeling in anaphase/telophase radial glial cells with respect to the cleavage plane. Black circles represent individual cells and red lines represent the average and s.e.m. The broken line indicates the threshold of mPar3 asymmetry. ****, p<5e-6. (F) Quantification of the number of radial glial cells in anaphase/telophase that display mPar3 asymmetry with respect to the orientation of the cleavage plane.
Asymmetric distribution of mPar3 in dividing radial glial progenitors with a defined cleavage plane
Does dispersed mPar3 in dividing radial glial cells become polarized as the cell cycle progresses and is it consequently differentially inherited by the two daughter cells? To fully answer these questions, given that the mitotic spindle of dividing radial glial cells rocks in metaphase and the orientation of the cleavage plane is not set until anaphase/telophase (Adams, 1996; Haydar et al., 2003; Sanada and Tsai, 2005), we examined mPar3 distribution selectively in anaphase/telophase radial glial cells. In five E14.5 cortical sections, a total of 51 radial glial cells in anaphase/telophase located at the luminal surface of the VZ were identified (Fig. 2D). In addition to a cytoplasmic/cortical localization, mPar3 was found to be enriched around the cleavage furrow (Fig. 2D, arrows). Interestingly, similar observation has been recently reported for Par3 in dividing neural progenitors in the developing zebrafish neural tube (Tawk et al., 2007). We next quantitatively analyzed the subcellular distribution of mPar3 in the dividing radial glial cells with respect to the cleavage plane (Supplementary Fig. 3). Of these 51 cells, 26 cells (50.9%) were found to possess asymmetrically distributed mPar3, while no clear asymmetry in DNA or Ph-Vim was observed (Fig. 2E and Supplementary Fig. 3). These results suggest that in about half of dividing radial glial cells around E14.5, mPar3 is asymmetrically distributed and in turn differentially inherited by the two daughter cells. This ratio of asymmetric mPar3 distribution and inheritance coincides well with the previously estimated fraction of asymmetric cell division at this developmental stage (Takahashi et al., 1996). Furthermore, we found a similar (50-60%) percentage of radial glial cells with a vertical, an intermediate, or a horizontal cleavage plane that displayed mPar3 asymmetry (Fig. 2F), indicating that the asymmetric segregation and inheritance of mPar3 occurs with equal probability among radial glial cells that divide in different orientations. Moreover, while mPar3 did not show any preference to be localized at either the apical or the basal side of the dividing radial glial cells, the axis of mPar3 asymmetry was always perpendicular to the orientation of the cleavage plane, indicating that mPar3 asymmetry influences the spindle orientation and the cleavage plane in these cells.
Mammalian Par3 regulates asymmetric cell division of radial glial progenitors in clonal culture
Having found that mPar3 shows polarized distribution in dividing radial glial cells (Fig. 2), we asked whether mPar3 is essential for differential daughter cell fate specification and asymmetric cell division. To address this, we perturbed the function of mPar3 in radial glial cells either by depleting or by ectopically expressing mPar3. Seven RNA interference (RNAi) constructs containing short hairpin RNA sequences against mPar3 (mPar3 shRNAs) were developed and tested (Supplementary Fig. 4 and 5). We found that six out of the seven mPar3 shRNAs specifically suppressed endogenous mPar3 expression in radial glial cells (Supplementary Fig. 4). Moreover, when introduced into the developing neocortex, these different mPar3 shRNAs caused similar defects in neocortical neurogenesis (Supplementary Fig. 5A), which could be rescued by co-expression of the shRNA-resistant wild type mPar3 protein (Supplementary Fig. 5D). These results strongly suggest that these mPar3 shRNAs specifically knockdown endogenous mPar3, which regulates neocortical neurogenesis. In addition, we also developed and tested ectopic expression constructs of mPar3 (e.g. EGFP-mPar3 and DsRedexpress-mPar3) (Shi et al., 2003) (data not shown).
To analyze the function of mPar3 in controlling the mode of division of radial glial cells, we adopted an assay that has been widely used for explicitly assessing symmetric versus asymmetric cell division of neural progenitor cells – the clonal pair-cell assay (Li et al., 2003; Sanada and Tsai, 2005; Shen et al., 2002) (Fig. 3A). While a substantial population of radial glial cells expressing the control construct divided asymmetrically as previously described (Li et al., 2003; Sanada and Tsai, 2005; Shen et al., 2002), the fraction of radial glial cells expressing either mPar3 shRNA (Fig. 3B) or EGFP-mPar3 (Fig. 3C) that divided asymmetrically was drastically reduced. Interestingly, even though both manipulations of mPar3 expression augmented symmetric division, the outcome in the daughter cell fate specification was rather different. While shRNA-mediated depletion of mPar3 led to a depletion of mPar3 from both the daughter cells (Supplementary Fig. 4) and an increase in neuron production (Fig. 3B), ectopic expression of mPar3 resulted in the presence of mPar3 in both the daughter cells (Fig. 3C, left) and promoted radial glial progenitor cell fate (Fig 3C, right). These results suggest that mPar3 is essential for asymmetric cell division of radial glial cells and that the inheritance level of mPar3 influences daughter cell fate specification.
Figure 3. mPar3 regulates asymmetric cell division of radial glial cells in clonal culture.
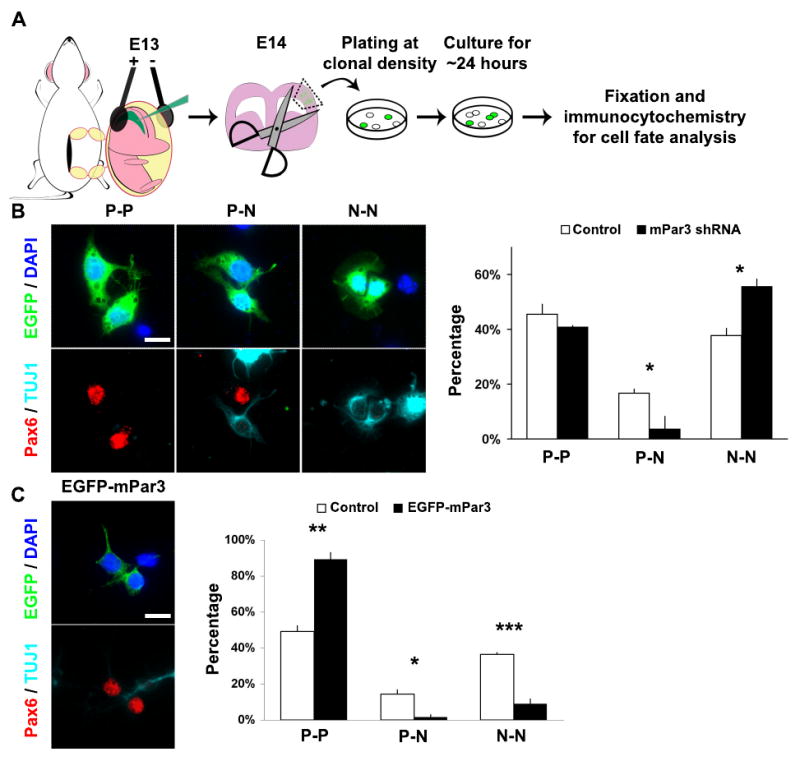
(A) Schematic representation of the procedure for assessing the mode of radial glial cell division using the clonal pair-cell assay. (B) Knockdown of mPar3 impairs asymmetric cell division. (left) Representative images of three different types of daughter-cell pairs originating from individual EGFP-expressing radial glial cells: two radial glial progenitor cells (P-P), one radial glial progenitor cell and one post-mitotic neuron (P-N), and two post-mitotic neurons (N-N). Sibling EGFP-expressing cell pairs derived from individual EGFP-expressing radial glial cells were immunostained with the antibodies against EGFP (green), Pax6 (red), a radial glial marker, and TUJ1 (light blue), a neuronal marker, and counterstained with a DNA dye (blue). Scale bar: 10 μm. (right) Quantification of the percentage of P-P, P-N, and N-N daughter cell pairs derived from control shRNA or mPar3 shRNA-expressing radial glial cells (Control shRNA, 418 cells from five experiments; mPar3 shRNA, 238 cells from four experiments). *, p<0.05. (C) Ectopic expression of mPar3 impairs asymmetric cell division. (left) Representative images of a daughter-cell pair originating from radial glial cells expressing EGFP-mPar3 immunostained with the antibodies against EGFP (green), Pax6 (red), TUJ1 (light blue) and counterstained with a DNA dye (blue). Scale bar: 10 μm. (right) Quantification of the percentage of P-P, P-N, and N-N daughter cell pairs derived from EGFP or EGFP-mPar3 expressing radial glial cells (Control, 275 cells from three experiments; EGFP-mPar3, 200 cells from three experiments). *, p<0.05; **, p<0.005; ***, p<5e-4.
Mammalian Par3 regulates asymmetric cell division of radial glial progenitors in situ
We next examined whether mPar3 regulates asymmetric cell division of radial glial cells in situ. To achieve this, we developed an assay for analyzing the mode of division of radial glial cells in brain slices (Fig. 4A). In this assay, individual dividing radial glial cells in slices expressing either control or mPar3 shRNAs were traced with time-lapse imaging. The fate of the two daughter cells originating from the same radial glial cell was then analyzed. Recent studies indicate that during the peak phase of neurogenesis, a majority of radial glial cells in situ divide asymmetrically to generate a radial glial cell and an IPC, which in turn divides symmetrically to produce neurons (Noctor et al., 2008). Consistent with this, we found that most of the dividing radial glial cells expressing control shRNA divided at the luminal surface of the VZ and produced two daughter cells, only one of which expressed the IPC marker Tbr2 (designated Tbr2+ and Tbr2-respectively) (Fig. 4 B and D). Moreover, the Tbr2- daughter cell adopted bipolar cell morphology, suggesting a radial glial cell fate. In contrast, nearly all dividing radial glial cells expressing mPar3 shRNA divided away from the luminal surface of the VZ and generated two daughter cells that were both either Tbr2- or Tbr2+, and adopted multipolar morphology (Fig. 4 C and D), indicating symmetric daughter cell fate specification. These results suggest that suppression of mPar3 expression in radial glial cells in situ causes a switch from asymmetric to symmetric cell division, and further support a critical role for mPar3 in regulating distinct daughter cell fate specification during the peak phase of neurogenesis.
Figure 4. mPar3 regulates asymmetric cell division of radial glial cells in situ.
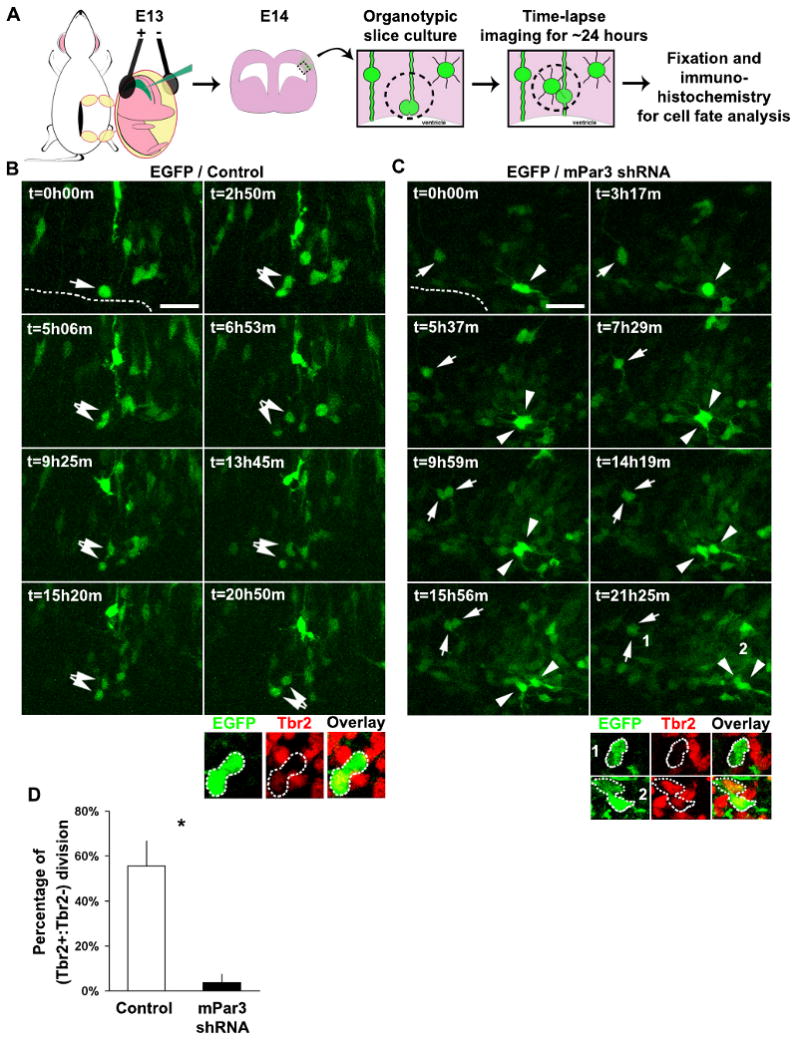
(A) Schematic representation of the procedure for examining the mode of division of radial glial cells in neocortical slices in situ. (B, C) Time-lapse images of radial glial cells expressing EGFP/Control shRNA (B) or EGFP/mPar3 shRNA (C) in organotypic cortical slice cultures. Arrows and arrowheads indicate dividing radial glial cells and their daughter cell pairs. Broken lines indicate the VZ surface. Immunohistochemistry analysis of EGFP-expressing (green) daughter cell pairs using the Tbr2 antibody (red) are shown at the bottom. Scale bars: 50 μm. (D) Quantification of the percentage of EGFP-expressing cells that divide asymmetrically to give rise to a Tbr2+ and a Tbr2- daughter cell (Control shRNA, 9 cells from three animals; mPar3 shRNA, 17 cells from eight animals). *, p<0.05.
Mammalian Par3 regulates endogenous Notch signaling activity in the developing neocortex
How does mPar3 go about regulating daughter cell fate specification? Given that a role in cell fate determination usually involves transcriptional activity (Ross et al., 2003), mPar3 itself is an unlikely candidate. We therefore sought to identify downstream effectors of mPar3 that regulate daughter cell fate specification. One attractive candidate is the Notch signaling pathway, which plays a key role in neocortical neurogenesis (Chenn and McConnell, 1995; Gaiano et al., 2000; Li et al., 2003; Mizutani et al., 2007; Petersen et al., 2002; Yoon et al., 2008). To test this, we first examined whether mPar3 affects Notch signaling activity in the developing neocortex. We took advantage of a well-characterized Notch signaling activity reporter that contains the canonical Notch effector C-promoter binding factor 1 (CBF1) response element upstream of EGFP (CBFRE-EGFP) (Mizutani et al., 2007). Using this reporter, the endogenous Notch signaling activity can be inferred based on EGFP expression. Should the Notch signaling pathway be a downstream effector of mPar3, either knockdown or ectopic expression of mPar3 would change endogenous Notch signaling activity and in turn, alter the expression of EGFP in the developing neocortex. Indeed, we found that when compared with control, ectopic expression of mPar3 led to an increase in CBFRE-EGFP expression (Fig. 5 A and B), indicative of an enhanced Notch signaling activity. Conversely, expression of mPar3 shRNA resulted in a decrease in CBFRE-EGFP expression (Fig. 5 C and D), indicative of a reduced Notch signaling activity. These results suggest that the expression level of mPar3 regulates endogenous Notch signaling activity. While cells with a high level of mPar3 expression develop high Notch signaling activity, cells with a low level of mPar3 expression harbor low Notch signaling activity. Given that Notch signaling activity controls cell fate specification in the developing neocortex (Gaiano et al., 2000; Yoon and Gaiano, 2005), these results raise the possibility that mPar3 acts through the Notch signaling pathway in generating the asymmetry in radial glial daughter cell fate specification.
Figure 5. mPar3 regulates endogenous Notch signaling activity in the developing neocortex.
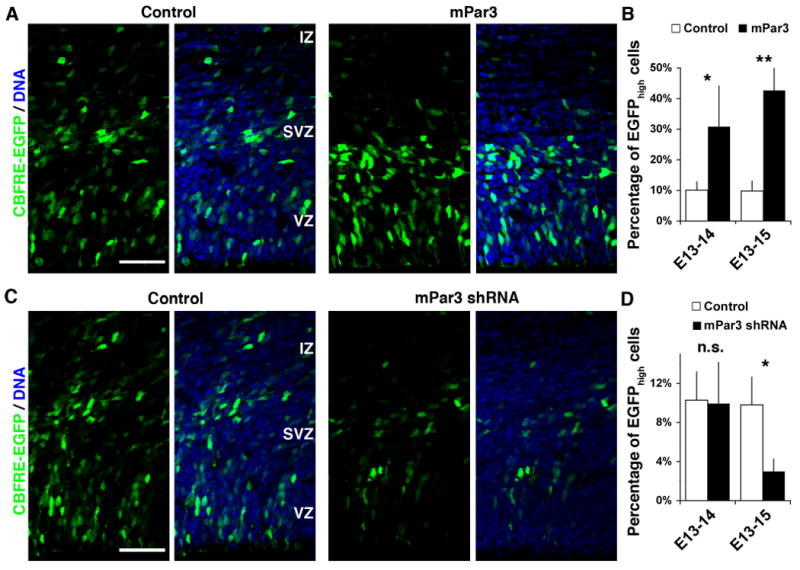
(A, B) Ectopic expression of mPar3 enhances endogenous Notch signaling activity. (A) Images of cortices expressing CBFRE-EGFP (green) together with control (left) or mPar3 (right) counterstained with a DNA dye (blue). Note that ectopic expression of mPar3 leads to an increase in EGFP expression, primarily in the VZ. Scale bar: 50 μm. (B) Quantification of the percentage of EGFPhigh cells in the developing neocortex (E13-14: Control, 236 cells from five animals; mPar3, 289 cells from five animals; E13-15: Control, 770 cells from five animals; mPar3, 555 cells from five animals). *, p<0.05; **, p<0.005. (C, D) Suppression of mPar3 expression decreases endogenous Notch signaling activity. (C) Images of cortices expressing CBFRE-EGFP (green) together with either Control shRNA (left) or mPar3 shRNA (right) counterstained with a DNA dye (blue). Note that suppression of mPar3 expression causes a decrease in EGFP expression. Scale bar: 50 μm. (D) Quantification of the percentage of EGFPhigh cells in the developing neocortex (E13-14: Control shRNA, 565 cells from five animals; mPar3 shRNA, 204 cells from four animals; E13-15: Control shRNA, 2,030 cells from seven animals; mPar3 shRNA, 2,123 cells from seven animals). n.s., not significant; *, p<0.05.
Notch signaling activity is required for mPar3 regulation of neocortical neurogenesis
To test the possibility that mPar3 acts through the Notch signaling pathway, we examined whether Notch signaling activity is required for mPar3-mediated regulation of radial glial cell division and daughter cell fate specification. It is known that upon activation, the Notch receptor is cleaved to produce the intracellular domain of Notch (NICD), which then enters the nucleus and cooperates with the DNA-binding protein CBF1 and its co-activator Mastermind (MAM) to promote transcription. Based on this, two mutant proteins have been widely used to manipulate Notch signaling activity; NICD for constitutively active Notch signaling and the dominant negative mastermind-like (DN-MAML) for inhibiting Notch signaling (Mizutani et al., 2007; Weng et al., 2003; Yoon et al., 2008). To test the functional relationship between mPar3 and Notch signaling activity, we examined the effect of ectopic mPar3 expression on neocortical neurogenesis in the presence or absence of the Notch signaling inhibitor, DN-MAML (Fig. 6 and 7). We found that, while ectopic expression of mPar3 restricted cells to the VZ and promoted a radial glial cell fate (Pax6+) (Fig. 6 A and B), co-expression of DN-MAML suppressed this effect of mPar3 ectopic expression (Fig. 7 A and B). Conversely, we examined the effect of suppression of mPar3 expression on neocortical neurogenesis in the presence or absence of constitutively active Notch signaling NICD (Fig. 6 and 7). We found that while depletion of mPar3 causes cells to exit the VZ and to adopt a neuronal fate (TUJ1+) (Fig. 6 C and D), co-expression of NICD largely eliminated this effect of mPar3 depletion on neocortical neurogenesis (Fig. 7 C and D). These results strongly support the notion that the Notch signaling pathway is downstream of mPar3 and is required for mPar3 function in regulating radial glial cell division and daughter cell fate specification.
Figure 6. Mammalian Par3 regulates radial glial daughter cell fate specification.
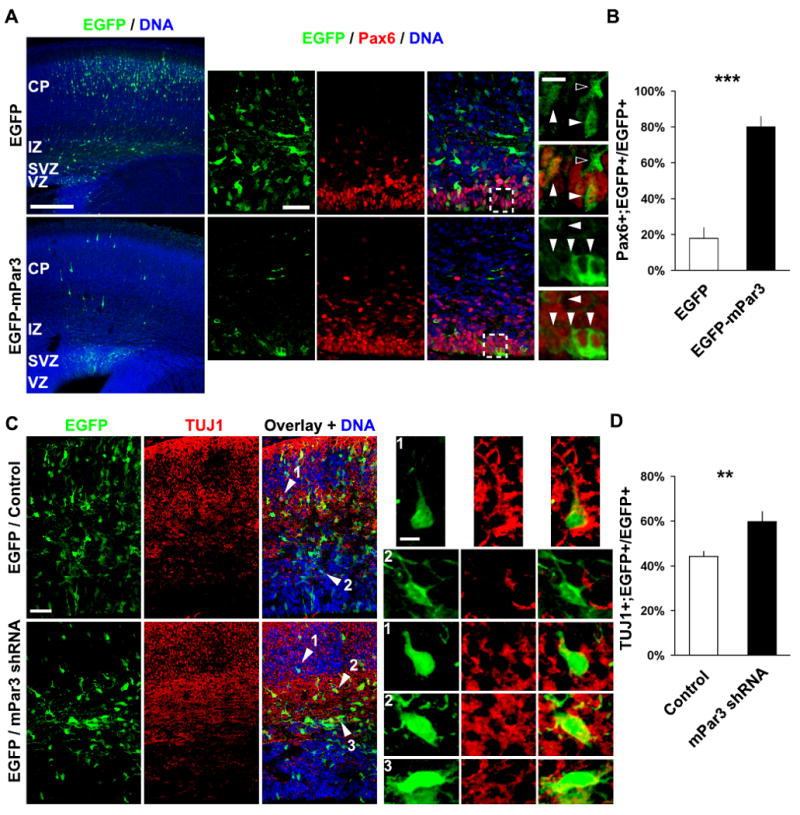
(A, B) Ectopic expression of mPar3 restricts cells to the VZ and promotes a radial glial cell fate. (A) Images of E18 cortices electroporated at E13 with EGFP (top) or EGFP-mPar3 (bottom) immunostained with the antibodies against EGFP (green) and Pax6 (red), a radial glial cell marker, and counterstained with a DNA dye (blue). High magnification images are shown to the right. Filled arrowheads indicate cells that are Pax6+ and open arrowheads indicates cells that are Pax6-. Note that the vast majority of cells expressing EGFP-mPar3 are in the VZ and Pax6+, while cell expressing EGFP are mostly in the CP and Pax6-. Scale bars: 250 μm, 50 μm and 10 μm. (B) Quantification of the percentage of transfected cells that are Pax6+ (Control, 654 cells from three animals; EGFP-mPar3, 143 cells from three animals). ***, p<0.0005. (C, D) Suppression of mPar3 expression causes cells to exit the VZ and leads to an increase in neuronal production. (C) Images of E16 cortices electroporated with EGFP/Control (top) and EGFP/mPar3 shRNA (bottom) at E13 immunostained with the antibodies against EGFP (green) and TUJ1 (red), a neuronal marker, and counterstained with a DNA dye (blue). High magnification images of transfected cells in different locations indicated by arrows and numbers are shown to the right. Note that cells expressing mPar3 shRNA exit the VZ and accumulate in the IZ, and are TUJ1+, while a substantial group of cells expressing control shRNA remain in the VZ and are TUJ1-. Scale bar: 50 μm and 5 μm. (D) Quantification of the percentage of transfected cells that are TUJ1+ (Control, 1,784 cells from six animals; mPar3 shRNA, 1,401 from five animals). **, p<0.001.
Figure 7. Notch signaling activity is required for mPar3 function.
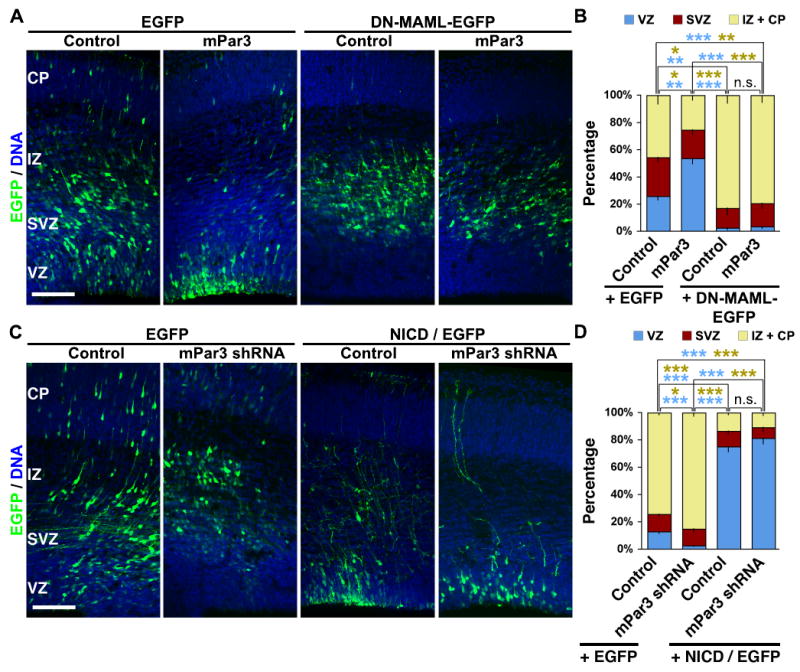
(A, B) DN-MAML suppresses the effect of mPar3 ectopic expression on neurogenesis. (A) Images of cortices expressing EGFP/Control, EGFP/mPar3, DN-MAML-EGFP, and mPar3/DN-MAML-EGFP (green) counterstained with a DNA dye (blue). Note that ectopic expression of mPar3 restricts cells to the VZ and this is suppressed by co-expression of DN-MAML. Scale bar: 200 μm. (B) Quantification of the distribution of EGFP-expressing cells in the developing neocortex (E13-15: Control, 945 cells from three animals; mPar3, 279 cells from four animals; DN-MAML-EGFP, 638 cells from three animals; mPar3/DN-MAML-EGFP, 370 cells from four animals). *, p<0.05; **, p<0.005; ***, p<5e-4; n.s., not significant. (C, D) NICD suppresses the effect of mPar3 depletion on neurogenesis. (C) Images of cortices expressing EGFP/Control shRNA, EGFP/mPar3 shRNA, EGFP/Control shRNA/NICD, and EGFP/mPar3 shRNA/NICD (green) counterstained with a DNA dye (blue). Note that suppression of mPar3 expression causes cells to exit the VZ and this is suppressed by co-expression of NICD. Scale bar: 200 μm. (D) Quantification of the distribution of EGFP-expressing cells in the developing neocortex (E13-16: Control, 1,504 cells from four animals; mPar3 shRNA, 863 cells from five animals; NICD, 500 cells from three animals; mPar3 shRNA/NICD, 239 cells from four animals). *, p<0.05; **, p<0.005; ***, p<5e-4; n.s., not significant.
Numb and Numb-like are required for mPar3 regulation of Notch signaling and neocortical neurogenesis
In Drosophila, Numb is a key player that functions between Par3 (i.e. Bazooka) and Notch signaling in regulating asymmetric cell division of neuroblasts and sensory organ precursors (SOPs) in the nervous system (Knoblich et al., 1995; Rhyu et al., 1994). In mammals, two Numb homologues, Numb (Nb) and Numb-like (Nbl), have been identified (Zhong et al., 1996). Genetic deletion studies demonstrate that Nb/Nbl is essential for the mammalian nervous system development (Li et al., 2003; Petersen et al., 2002; Petersen et al., 2004; Zhong et al., 2000; Zilian et al., 2001). To test whether mammalian Nb and Nbl are required for mPar3 regulation of Notch signaling and radial glial progenitor cell division, we suppressed the expression of Nb and Nbl using specific shRNA sequences against Nb and Nbl as previously published (Rasin et al., 2007) and examined their effect on mPar3 regulation of Notch signaling and neocortical neurogenesis (Fig. 8). Should the regulation of Notch signaling by mPar3 (Fig. 5) depend on Nb and Nbl, we would expect that depletion of Nb and Nbl abolishes the effect of manipulating mPar3 expression on Notch signaling activity. Indeed, we found that in the presence of Nb and Nbl shRNAs removal of mPar3 failed to reduce Notch signaling activation (Fig. 8 A and B), suggesting that Nb and Nbl are required for mPar3 regulation of Notch signaling. Consistent with the notion that Nb and Nbl antagonize Notch signaling, removal of Nb and Nbl led to an increase in Notch signaling activity (Fig. 8 A and B).
Figure 8. Nb and Nbl are required for mPar3 function.
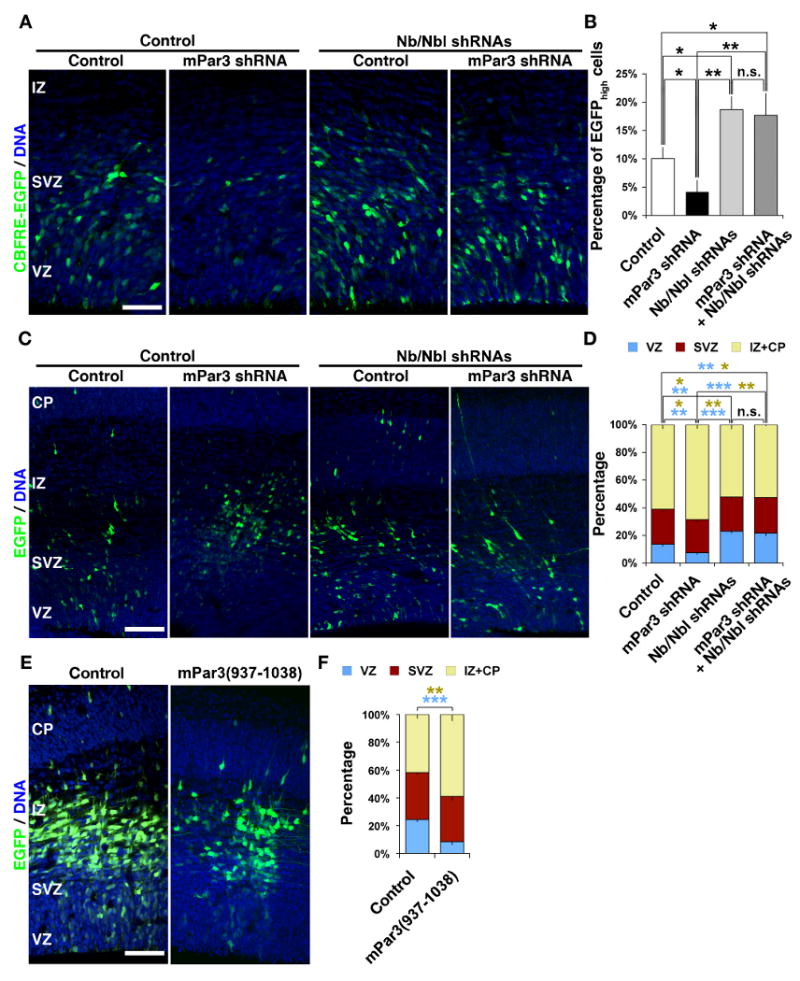
(A, B) Depletion of Nb and Nbl suppresses mPar3 regulation of Notch signaling. (A) Images of cortices expressing CBFRE-GFP (green) together with either Control shRNA or mPar3 shRNA in the absence (left) or presence (right) of Nb/Nbl shRNAs counterstained with a DNA dye (blue). Note that expression of mPar3 shRNA leads to a reduction in EGFP expression and this is suppressed by Nb/Nbl shRNAs. Scale bar: 50 μm. (B) Quantification of the percentage of EGFPhigh cells in the developing neocortex (Control, 2,185 cells from five animals; mPar3 shRNA, 1,014 cells from five animals; Nb/Nbl shRNAs, 1,204 cells from five animals; mPar3 shRNA & Nb/Nbl shRNAs, 1,680 cells from six animals). *, p<0.05; **, p<0.005. (C, D) Depletion of Nb and Nbl suppresses mPar3 regulation of neocortical neurogenesis. (C) Images of cortices expressing EGFP/Control or EGFP/mPar3 shRNA (green) in the absence (left) or presence (right) of Nb/Nbl shRNAs counterstained with a DNA dye (blue). Note that expression of mPar3 shRNA leads to a depletion of cells from the VZ and this is suppressed by Nb/Nbl shRNAs. Scale bar: 100 μm. (D) Quantification of the percentage of EGFP-expressing cells in different regions of the developing neocortex (Control, 1,948 cells from five animals; mPar3 shRNA, 1,153 cells from five animals; Nb/Nbl shRNAs, 3,434 cells from five animals; mPar3 shRNA & Nb/Nbl shRNAs, 3,032 cells from five animals). *, p<0.05; **, p<0.005; ***, p<5e-4; n.s., not significant. (E, F) Overexpression of the Nb-binding region of mPar3 results in a premature depletion of cells from the VZ. (E) Images of cortices expressing EGFP/Control (left) or EGFP/mPar3(937-1036) (right) counterstained with a DNA dye (blue). Scale bar: 50 μm. (F) Quantification of the percentage of EGFP-expressing cells in different regions of the developing neocortex (Control, 1,432 cells from six animals; mPar3(937-1038), 1,071 cells from six animals). **, p<0.005; ***, p<5e-4.
We next asked whether Nb and Nbl are required for mPar3 regulation of neocortical neurogenesis. While suppression of mPar3 expression led to a premature depletion of cells from the VZ (Fig. 6 C and D, Fig. 7 C and D, Fig. 8 C and D), depletion of Nb and Nbl largely eliminated this effect (Fig. 8 C and D), suggesting that Nb and Nbl are required for mPar3 regulation of neocortical neurogenesis. Recently, a direct interaction between mPar3 and Nb has been reported (Nishimura and Kaibuchi, 2007). To test whether this mode of action between mPar3 and Nb is critical, we examined the effect of overexpression of the region in mPar3 (amino acids 937-1038) that binds to Nb, mPar3(937-1038), on neocortical neurogenesis (Fig. 8 E and F). Interestingly, we found that overexpression of the Nb-binding region of mPar3 resulted in a premature depletion of cells from the VZ (Fig. 8 E and F), similar to removal of mPar3 (Fig. 6 C and D, Fig. 7 C and D, and Fig. 8 C and D). These results further support a role of Nb/Nbl in mediating the function of mPar3 in regulating Notch signaling and neocortical neurogenesis.
Discussion
In summary, the results presented here demonstrate that the evolutionarily conserved cell polarity protein mPar3 and the Notch signaling pathway act together to regulate the asymmetric cell division of radial glial progenitor cells in the developing neocortex (Fig. 9). Mammalian Par3 is not statically restricted to the apical membrane domain of radial glial cells as previously suggested (Costa et al., 2008; Kosodo et al., 2004); instead, its distribution is dynamic depending on the cell cycle progression. It is selectively localized to the ZO-1- expressing lateral membrane domain in the ventricular endfeet during interphase and then becomes dispersed during mitosis. This dynamic distribution of mPar3 can lead to asymmetric inheritance of mPar3 by the two daughter cells, which results in differential Notch signaling activation that depends on Numb/Numb-like and distinct daughter cell fate specification. While the daughter cell that inherits a greater amount of mPar3 develops high Notch signaling activity and remains a radial glial cell, the daughter cell that inherits less mPar3 harbors low Notch signaling activity and adopts either a neuronal or an IPC fate.
Figure 9. A model that illustrates mPar3 regulation of Notch signaling and asymmetric cell division of radial glial cells in the developing neocortex.
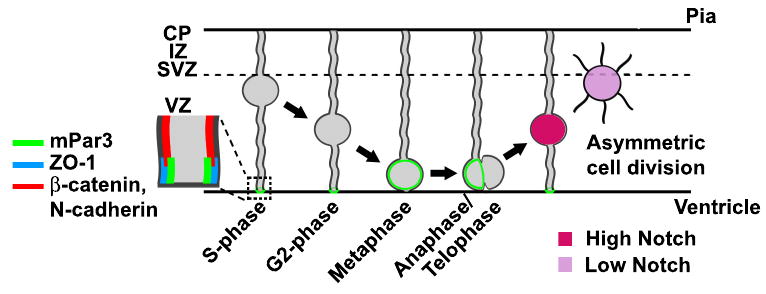
Dynamic distribution of mPar3 in radial glial cells leads to differential inheritance of mPar3 by the two daughter cells as the cell cycle progresses. The daughter cell that inherits a greater amount of mPar3 develops high Notch signaling activity and remains a radial glial cell, whereas the daughter cell that inherits less mPar3 harbors low Notch signaling activity and adopts an IPC or a neuronal fate.
The dynamic nature of mPar3 subcellular localization in radial glial progenitor cells has not been shown previously. In fact, the distribution of mPar3 in dividing radial glial progenitor cells has not been rigorously examined. A recent study suggests that the mPar protein promotes the proliferation of progenitor cells (Costa et al., 2008). However, it is unclear whether the mPar protein regulates asymmetric radial glial cell division. Precisely determining the subcellular distribution of mPar3 in dividing radial glial cells is of critical importance to understanding its function and the molecular control of asymmetric cell division. Given the enrichment of mPar3 in interphase radial glial cells at the luminal surface of the VZ (Fig. 1), where the cell bodies of scarce dividing radial glial cells are located (Fig. 2A), it is rather challenging to distinguish mPar3 in the cell bodies of dividing radial glial cells from that in the ventricular endfeet of interphase radial glial cells. To overcome this difficulty, we took advantage of the phospho-Vimentin antibody, which selectively labels radial glial cells in mitosis (Fig. 2). Moreover, the cytoplasmic labeling seen with this antibody helps to define the cell contour and its cleavage furrow, thereby facilitating the determination of the precise distribution of mPar3 and the cleavage plane of individual dividing radial glial cells (Fig. 2 and Supplementary Fig. 3). We found that at E14.5 in about half of radial glial cells with a defined cleavage plane (i.e. in anaphase/telophase), mPar3 shows asymmetric distribution and the axis of the mPar3 asymmetry is perpendicular to the cleavage plane; this would result in a preferential segregation of mPar3 into one of the two future daughter cells.
Previous studies showed that about half of the divisions in the VZ of the developing mouse cortex at this developmental stage are asymmetric and neurogenic (Takahashi et al., 1996). Although our analysis of mPar3 asymmetry in dividing radial glial cells is likely an underestimation, these data suggest that the subcellular distribution of mPar3 (i.e. symmetric vs. asymmetric) may be critical for determining the mode of division of radial glial cells. Indeed, we found that disrupting mPar3 asymmetry in radial glial cells either by depletion or by ectopic expression of mPar3 prevents asymmetric cell division and promotes symmetric cell division (Fig. 3 and 4). While the precise mechanisms underlying the establishment of the mPar3 asymmetry remain to be uncovered, our findings strongly suggest that mPar3 and its subcellular distribution regulate the mode of radial glial cell division and daughter cell fate specification in the developing neocortex.
Interestingly, while both suppression of mPar3 expression and ectopic mPar3 expression impair asymmetric radial glial cell division, their effects on daughter cell fate specification are rather different. Ectopic mPar3 expression promotes radial glial cell fate (Fig. 3, 4, 6 and 7), whereas suppression of mPar3 expression facilitates neuronal production (Fig. 3, 4, and 6-8). These results indicate that the inheritance level of mPar3 influences daughter cell fate specification, although mPar3 itself being an unlikely cell fate determinant. Intriguingly, we found that the expression level of mPar3 affects Notch signaling activity, a key cell fate regulator required for proper neocortical neurogenesis (Gaiano et al., 2000; Yoon and Gaiano, 2005). While a high level of mPar3 expression leads to high Notch signaling activity, a low level of mPar3 expression results in low Notch signaling activity. Previous studies have shown that Notch signaling activity is high in radial glial progenitor cells, but low in differentiating cells such as neurons (Gaiano and Fishell, 2002; Gaiano et al., 2000; Mizutani et al., 2007; Yoon and Gaiano, 2005; Yoon et al., 2008). However, it is unclear how differential regulation of Notch signaling activity is initialized in the daughter cells of dividing radial glial progenitors. Here, we found that asymmetric segregation of mPar3 can lead to differential Notch signaling activity in the two daughter cells.
In Drosophila neuroblasts, the asymmetric localization of Numb, a negative regulator of Notch signaling, is fundamental for differential Notch signaling activity and cell fate diversity in the central nervous system (Jan and Jan, 2001; Roegiers and Jan, 2004; Wodarz and Huttner, 2003). Furthermore, this asymmetry in Numb distribution depends on the asymmetric segregation of Bazooka, the mPar3 ortholog in Drosophila. In mammals there are two Numb homologues, Numb and Numb-like (Zhong et al., 1996). Previous studies suggest that Numb is essential for the proper development of the mammalian brain (Zhong et al., 2000; Zilian et al., 2001). However, the correlation between Numb protein segregation and asymmetric daughter cell fate specification has not been definitively established (Li et al., 2003; Petersen et al., 2002). In addition, recent studies suggest that Numb is involved in trafficking and proper localization of the junctional protein cadherin in radial glial cells and thereby functions in maintaining the tissue architecture of the developing neocortex (Kuo et al., 2006; Rasin et al., 2007). Here, we found that mPar3 acts through Numb and Numb-like in regulating Notch signaling activity. Moreover, our data suggest that a direction interaction between mPar3 and Numb is critical. Despite that it is unclear whether Numb is asymmetrically distributed in dividing radial glial progenitor cells, these findings suggest that asymmetric inheritance of mPar3, which interacts with Numb/Numb-like, results in differential activation of Notch signaling in the two daughter cells of asymmetrically dividing radial glial progenitors in the developing neocortex. Moreover, a recent study showed that removal of Cdc42 in the developing neocortex leads to mislocalization of mPar3 and defects in neocortical neurogenesis (Cappello et al., 2006). Given that mPar3 and activated Cdc42 interact with each other, our findings coupled with these observations suggest that the mPar protein complex and its interacting proteins, such as Cdc42 and Lgl (Klezovitch et al., 2004; Vasioukhin, 2006), likely represent an essential molecular pathway that regulates Notch signaling activity and asymmetric cell division of radial glial progenitor cells in the mammalian neocortex.
Materials and Methods
Immunohistochemistry, confocal imaging and analysis
Timed pregnant CD-1 mice at the appropriate embryonic age were anesthetized. Embryos were removed and transcardially perfused with ice-cold PBS followed by 4% paraformaldehyde (PFA). Brains were dissected out and coronal sections were prepared using a cryostat or a vibratome (Leica Microsystems). Tissue sections were incubated for one hour at room temperature in a blocking solution (10% normal goat or donkey serum as appropriate, 0.1% Triton X-100, and 0.2% gelatin in PBS), followed by incubation with the primary antibody overnight at 4°C. Sections were then washed in 0.1% Triton X-100 in PBS and incubated with the appropriate fluorescence conjugated secondary antibody for one to two hours at room temperature. For Pax6 and Tbr2 staining, an antigen retrieval procedure was performed before the blocking step by incubating tissue sections in 0.1 M sodium citrate for 5 minutes in a microwave pressure cooker at 50% power. The polyclonal mPar3 antibody was generated by immunizing rabbits with the purified recombinant protein GST-mPar3 (1-229) (Cocalico Biologicals, Inc.) and affinity-purified before use. Primary antibodies used were: Rabbit polyclonal anti-mPar3 (home-made, 1:300), Rabbit polyclonal anti-mPar3 (1:300, Millipore/Upstate), mouse monoclonal anti-β-catenin (1:100, Zymed), mouse monoclonal anti-phosphorylated Vimentin (clone 4A4; MBL, 1:500), mouse monoclonal anti-β-III tubulin (clone TUJ1) (Covance, 1:500), mouse monoclonal anti-Nestin (Millipore/Chemicon, 1:200), rabbit polyclonal anti-MAP2 (Millipore/Chemicon, 1:1000), rabbit polyclonal anti-Pax6 (Covance, 1:100), rabbit polyclonal anti-Tbr2 (kindly provided by Dr. Robert Hevner and Millipore/Chemicon, 1:500), chicken polyclonal anti-GFP (Aves, 1:400), mouse monoclonal ZO-1 (Zymed, 1:250), rabbit monoclonal ZO-1 (Invitrogen, 1:200) and rat anti-prominin-1 (eBioScience, 1:100). Secondary antibodies used were: goat or donkey anti-mouse or anti-rabbit Cy5 or Alexa 568 conjugated antibodies (1:500, Invitrogen/Molecular Probes) and goat anti-chicken Alexa 488 conjugated antibody (1:500, Invitrogen/Molecular Probes). DNA was stained with Propidium Iodide, 4′,6-diamidino-2-phenylindole (DAPI), or Syto-63 (Molecular Probes). Images were acquired with a Zeiss LSM Pascal or an Olympus FV1000 confocal microscope, and analyzed with LSM (Zeiss), Fluoview (Olympus), Volocity (ImproVision), and Photoshop (Adobe Systems).
For quantification of mPar3 immunofluorescence in dividing radial glial cells at the VZ surface, confocal images were taken to cover the entire cell. A contour was drawn around individual dividing cells based on the phospho-Vimentin (Ph-Vim) immunofluorescence in each confocal section, and the cell was then divided along the cleavage plane inferred from the constriction sites corresponding to the mitotic cleavage furrow revealed by the Ph-Vim immunofluorescence and the DNA labeling. Total or average fluorescence intensity for mPar-3, Ph-Vim, or DNA inside the two daughter cell areas over all z-sections was then measured (Supplementary Fig. 3). To quantitatively describe the distribution of mPar3, the normalized ratio of mPar3 immunofluorescence between the two future daughter cells was then calculated as , where “0” indicates perfect symmetry and “1” indicates absolute asymmetry. Similar measurements were also conducted for DNA staining, which served as a control. For quantification of CBFRE-EGFP expression, the EGFP fluorescence intensity in the cell bodies of transfected cells was measured and EGFPhigh cell was defined as the top 10% of the population under control conditions. For quantification of the distribution of EGFP-expressing cells in the developing neocortex, different cytoarchitectural regions of the neocortex (i.e. VZ, SVZ, IZ, and CP) were distinguished based on the cell organization and density reflected by the DNA labeling, and the number of EGFP-expressing cells with their nuclei located in these areas was then counted. Nearly identical areas in the neocortex of individual brains were chosen for analysis.
Data are presented as mean±s.e.m. and nonparametric tests (Mann-Whitney-Wilcoxon test for two groups of data and Kruskal-Wallis test for three or more groups of data) were used for statistical significance estimations.
Plasmids and in utero electroporation
Seven shRNA sequences against mPar3 were designed as follows: mPar3 shRNA-a (ACAGACTGGTAGCAGTAT), -b (ATGAAAACTACAGAAGCC), -c (CTATGCGTGCGCGTGTCA), -d (CTGAAGATGAGGACGTTG), -e (TCCTACGACAAGCCCATGG), -f (GAGAACCCCAGGTATTCCAG) and -g (GCTGAGCAAGAAAACCTT). Four shRNA sequences against mPar6 were designed as follows: mPar6 shRNA-1 (AGCAAATTTGACGCCGAG), -2 (GTGACTCGAGTGGCCTGGC), -4 (AGCAAGTTTGGAGCTGAG) and -12 (CCAACTGTTCCATCCGTG). The Numb- and Numb-like shRNA sequences were designed as previously described (Rasin et al., 2007). All sense and anti-sense oligos were purchased from Sigma. Annealed oligos were cloned into the HpaI and XhoI sites of the Lentiviral vector pLL3.7, which contains a separate CMV promoter that drives the expression of EGFP (Rubinson et al., 2003). In this study, mPar3 shRNA-a was primarily used after extensive characterization (Supplementary Fig. 3 and 4), while non-specific shRNA constructs or mPar3 shRNA constructs that failed to suppress mPar3 expression were used as control. EGFP-mPar3, CBFRE-GFP, Notch NICD, and DN-MAML constructs were generated as previously described (Mizutani et al., 2007; Shi et al., 2003; Weng et al., 2003). The mPar3(1-712), mPar3(1117-1232) (kinesin-II-binding domain) and mPar3(937-1038) (Numb-binding domain) fragments were generated by PCR and cloned into the EcoRI and XhoI sites of pCAG-IRES-EGFP. All plasmids were confirmed by sequencing.
In utero electroporation was performed as previously described (Tabata and Nakajima, 2001). In brief, a timed pregnant CD-1 mouse at 13 days of gestation (E13) was anesthetized, the uterine horns were exposed, and ∼1 μl of plasmid DNA (1-3 μg/μl) mixed with Fast green (Sigma) was microinjected through the uterus into the lateral ventricle manually using a beveled and calibrated glass micropipette (Drummond Scientific). For electroporation, five 50 ms pulses of 40-50 mV with a 950 ms interval were delivered across the uterus with two 9-mm electrode paddles positioned on either side of the head (BTX, ECM830). During the procedure, the embryos were constantly bathed with warm PBS (pH 7.4). After electroporation, the uterus was placed back in the abdominal cavity and the wound was surgically sutured. After surgery, the animal was placed in a 28°C recovery incubator under close monitoring until it recovered and resumed normal activity. All procedures for animal handling and usage were approved by the institutional research animal resource center (RARC).
Pair-cell analysis
Pair-cell analysis was performed as described (Shen et al., 2002). In brief, embryos were electroporated with DNA constructs at E13 and the brains were dissected out and sectioned using a vibratome (Leica Microsystems) at E14. Cortical sections containing EGFP-expressing cells in the VZ were isolated, incubated in a protease solution containing 10 units/ml papain (Fluka), 1000 units/ml DNAse I (Roche) and 5 mM L-cysteine in DMEM (Gibco), and triturated using a fire-polished Pasteur pipette to create a single-cell suspension. Cells were resuspended in a culture medium containing DMEM, glutamine, penicillin/streptomycin, sodium pyruvate (Gibco), 1 mM N-acetyl-L-cysteine (Sigma), B27, N2 and 10 ng/ml bFGF2 (Gibco) and plated onto coverslips coated with poly-L-lysine (Sigma) in 24-well plates at clonal density. The cultures were maintained in a humidified incubator at 37 °C with constant 5% CO2 supply. About 24 hours later, the cultures were fixed and immunostained with anti-GFP (1:500, Aves Labs), anti-TUJ1 (1:500, Covance) and anti-Pax6 (1:250, Covance) antibodies, and counterstained with the DNA dye. Images were acquired on an inverted epifluorescence microscope (Axiovert 2000, Carl Zeiss) equipped with a cooled CCD (Orca ER, Hamamatsu Photonics) and analyzed with Axiovision (Zeiss) and Photoshop (Adobe System).
Organotypic cortical slice culture and time-lapse confocal imaging
Twelve hours after in utero electroporation, embryos were removed and the brains were extracted into ice-cold artificial cerebro-spinal fluid (ACSF) containing (in mM): 125 NaCl, 5 KCl, 1.25 NaH2PO4, 1 MgSO4, 2 CaCl2, 25 NaHCO3 and 20 glucose; pH 7.4, 310 mOsm/L. Brains were embedded in 4% low-melting agarose in ACSF and sectioned at 400 μm using a vibratome (Leica microsystems). Brain slices that contained EGFP-expressing cells were then transferred onto a slice culture insert (Millicell) in a glass-bottom petri dish (MatTek Corporation) with culture medium containing (by volume): 66% BME, 25% Hanks, 5% FBS, 1% N-2, 1% Penicillin/Streptomycin/Glutamine (all from Gibco) and 0.66% D-(+)-glucose (Sigma). Cultures were maintained in a humidified incubator at 37°C with constant 5% CO2 supply. Twelve hours after plating, petri dishes with slice cultures were transferred to an inverted confocal microscope (LSM 5 Pascal, Carl Zeiss) and time-lapse images of EGFP-expressing cells were acquired every three to four hours for about 24 hours. Transmitted-light images were also taken at each time point to monitor the movement of EGFP-expressing cells in relation to the ventricular surface. Slices were kept in the incubator between time points. After imaging, slices were rinsed once in PBS and fixed in 4% PFA for 24 hours, and processed for immunohistochemistry using an anti-Tbr2 antibody (Millipore/Chemicon). EGFP-expressing cells that divided unambiguously during the imaging period were identified for the analysis of cell division location and mode.
Supplementary Material
Acknowledgments
We thank Drs. A. Hall, A.L. Joyner, S.C. Noctor, J. Kaltschmidt, Y. Chin and L.A. McDowell for comments on the manuscript and members of our laboratories for thoughtful discussions and valuable inputs, Dr. N. Gaiano for providing CBFRE-GFP construct, and Dr. Y. Li for providing Notch NICD and DN-MAML constructs. We thank Xin Pei, Michelle Wei, She Chen, Cathy S. Young, William Walantus, Jeanelle Agudelo, and Joy Mirjahangir for technical assistance. This work is supported by grants from March of Dimes Birth Defects Foundation, Whitehall Foundation, DANA Foundation, Autism Speaks Foundation, The Esther A. & Joseph Klingenstein Foundation, NARSAD (to S.-H.S.), and NIH (to S.-H.S. and A.R.K.). L.Y.J and Y.-N.J. are investigators of Howard Hughes Medical Institute.
Footnotes
Publisher's Disclaimer: This is a PDF file of an unedited manuscript that has been accepted for publication. As a service to our customers we are providing this early version of the manuscript. The manuscript will undergo copyediting, typesetting, and review of the resulting proof before it is published in its final citable form. Please note that during the production process errors may be discovered which could affect the content, and all legal disclaimers that apply to the journal pertain.
References
- Aaku-Saraste E, Hellwig A, Huttner WB. Loss of occludin and functional tight junctions, but not ZO-1, during neural tube closure--remodeling of the neuroepithelium prior to neurogenesis. Dev Biol. 1996;180:664–679. doi: 10.1006/dbio.1996.0336. [DOI] [PubMed] [Google Scholar]
- Adams RJ. Metaphase spindles rotate in the neuroepithelium of rat cerebral cortex. J Neurosci. 1996;16:7610–7618. doi: 10.1523/JNEUROSCI.16-23-07610.1996. [DOI] [PMC free article] [PubMed] [Google Scholar]
- Anthony TE, Klein C, Fishell G, Heintz N. Radial glia serve as neuronal progenitors in all regions of the central nervous system. Neuron. 2004;41:881–890. doi: 10.1016/s0896-6273(04)00140-0. [DOI] [PubMed] [Google Scholar]
- Astrom KE, Webster HD. The early development of the neopallial wall and area choroidea in fetal rats. A light and electron microscopic study. Adv Anat Embryol Cell Biol. 1991;123:1–76. [PubMed] [Google Scholar]
- Buchman JJ, Tsai LH. Spindle regulation in neural precursors of flies and mammals. Nat Rev Neurosci. 2007;8:89–100. doi: 10.1038/nrn2058. [DOI] [PubMed] [Google Scholar]
- Cappello S, Attardo A, Wu X, Iwasato T, Itohara S, Wilsch-Brauninger M, Eilken HM, Rieger MA, Schroeder TT, Huttner WB, et al. The Rho-GTPase cdc42 regulates neural progenitor fate at the apical surface. Nat Neurosci. 2006;9:1099–1107. doi: 10.1038/nn1744. [DOI] [PubMed] [Google Scholar]
- Chenn A, McConnell SK. Cleavage orientation and the asymmetric inheritance of Notch1 immunoreactivity in mammalian neurogenesis. Cell. 1995;82:631–641. doi: 10.1016/0092-8674(95)90035-7. [DOI] [PubMed] [Google Scholar]
- Chenn A, Zhang YA, Chang BT, McConnell SK. Intrinsic polarity of mammalian neuroepithelial cells. Mol Cell Neurosci. 1998;11:183–193. doi: 10.1006/mcne.1998.0680. [DOI] [PubMed] [Google Scholar]
- Costa MR, Wen G, Lepier A, Schroeder T, Gotz M. Par-complex proteins promote proliferative progenitor divisions in the developing mouse cerebral cortex. Development. 2008;135:11–22. doi: 10.1242/dev.009951. [DOI] [PubMed] [Google Scholar]
- Doe CQ, Fuerstenberg S, Peng CY. Neural stem cells: from fly to vertebrates. J Neurobiol. 1998;36:111–127. [PubMed] [Google Scholar]
- Fishell G, Kriegstein AR. Neurons from radial glia: the consequences of asymmetric inheritance. Curr Opin Neurobiol. 2003;13:34–41. doi: 10.1016/s0959-4388(03)00013-8. [DOI] [PubMed] [Google Scholar]
- Gaiano N, Fishell G. The role of notch in promoting glial and neural stem cell fates. Annu Rev Neurosci. 2002;25:471–490. doi: 10.1146/annurev.neuro.25.030702.130823. [DOI] [PubMed] [Google Scholar]
- Gaiano N, Nye JS, Fishell G. Radial glial identity is promoted by Notch1 signaling in the murine forebrain. Neuron. 2000;26:395–404. doi: 10.1016/s0896-6273(00)81172-1. [DOI] [PubMed] [Google Scholar]
- Haubensak W, Attardo A, Denk W, Huttner WB. Neurons arise in the basal neuroepithelium of the early mammalian telencephalon: a major site of neurogenesis. Proc Natl Acad Sci U S A. 2004;101:3196–3201. doi: 10.1073/pnas.0308600100. [DOI] [PMC free article] [PubMed] [Google Scholar]
- Haydar TF, Ang E, Jr, Rakic P. Mitotic spindle rotation and mode of cell division in the developing telencephalon. Proc Natl Acad Sci U S A. 2003;100:2890–2895. doi: 10.1073/pnas.0437969100. [DOI] [PMC free article] [PubMed] [Google Scholar]
- Izumi Y, Hirose T, Tamai Y, Hirai S, Nagashima Y, Fujimoto T, Tabuse Y, Kemphues KJ, Ohno S. An atypical PKC directly associates and colocalizes at the epithelial tight junction with ASIP, a mammalian homologue of Caenorhabditis elegans polarity protein PAR-3. J Cell Biol. 1998;143:95–106. doi: 10.1083/jcb.143.1.95. [DOI] [PMC free article] [PubMed] [Google Scholar]
- Jan YN, Jan LY. Asymmetric cell division in the Drosophila nervous system. Nat Rev Neurosci. 2001;2:772–779. doi: 10.1038/35097516. [DOI] [PubMed] [Google Scholar]
- Joberty G, Petersen C, Gao L, Macara IG. The cell-polarity protein Par6 links Par3 and atypical protein kinase C to Cdc42. Nat Cell Biol. 2000;2:531–539. doi: 10.1038/35019573. [DOI] [PubMed] [Google Scholar]
- Johansson A, Driessens M, Aspenstrom P. The mammalian homologue of the Caenorhabditis elegans polarity protein PAR-6 is a binding partner for the Rho GTPases Cdc42 and Rac1. J Cell Sci. 2000;113(Pt 18):3267–3275. doi: 10.1242/jcs.113.18.3267. [DOI] [PubMed] [Google Scholar]
- Johnson K, Wodarz A. A genetic hierarchy controlling cell polarity. Nat Cell Biol. 2003;5:12–14. doi: 10.1038/ncb0103-12. [DOI] [PubMed] [Google Scholar]
- Kamei Y, Inagaki N, Nishizawa M, Tsutsumi O, Taketani Y, Inagaki M. Visualization of mitotic radial glial lineage cells in the developing rat brain by Cdc2 kinase-phosphorylated vimentin. Glia. 1998;23:191–199. doi: 10.1002/(sici)1098-1136(199807)23:3<191::aid-glia2>3.0.co;2-8. [DOI] [PubMed] [Google Scholar]
- Kemphues K. PARsing embryonic polarity. Cell. 2000;101:345–348. doi: 10.1016/s0092-8674(00)80844-2. [DOI] [PubMed] [Google Scholar]
- Kemphues KJ, Priess JR, Morton DG, Cheng NS. Identification of genes required for cytoplasmic localization in early C. elegans embryos. Cell. 1988;52:311–320. doi: 10.1016/s0092-8674(88)80024-2. [DOI] [PubMed] [Google Scholar]
- Klezovitch O, Fernandez TE, Tapscott SJ, Vasioukhin V. Loss of cell polarity causes severe brain dysplasia in Lgl1 knockout mice. Genes Dev. 2004;18:559–571. doi: 10.1101/gad.1178004. [DOI] [PMC free article] [PubMed] [Google Scholar]
- Knoblich JA. Mechanisms of asymmetric stem cell division. Cell. 2008;132:583–597. doi: 10.1016/j.cell.2008.02.007. [DOI] [PubMed] [Google Scholar]
- Knoblich JA, Jan LY, Jan YN. Asymmetric segregation of Numb and Prospero during cell division. Nature. 1995;377:624–627. doi: 10.1038/377624a0. [DOI] [PubMed] [Google Scholar]
- Kosodo Y, Roper K, Haubensak W, Marzesco AM, Corbeil D, Huttner WB. Asymmetric distribution of the apical plasma membrane during neurogenic divisions of mammalian neuroepithelial cells. Embo J. 2004;23:2314–2324. doi: 10.1038/sj.emboj.7600223. [DOI] [PMC free article] [PubMed] [Google Scholar]
- Kuo CT, Mirzadeh Z, Soriano-Navarro M, Rasin M, Wang D, Shen J, Sestan N, Garcia-Verdugo J, Alvarez-Buylla A, Jan LY, Jan YN. Postnatal deletion of Numb/Numblike reveals repair and remodeling capacity in the subventricular neurogenic niche. Cell. 2006;127:1253–1264. doi: 10.1016/j.cell.2006.10.041. [DOI] [PMC free article] [PubMed] [Google Scholar]
- Lechler T, Fuchs E. Asymmetric cell divisions promote stratification and differentiation of mammalian skin. Nature. 2005;437:275–280. doi: 10.1038/nature03922. [DOI] [PMC free article] [PubMed] [Google Scholar]
- Li HS, Wang D, Shen Q, Schonemann MD, Gorski JA, Jones KR, Temple S, Jan LY, Jan YN. Inactivation of Numb and Numblike in embryonic dorsal forebrain impairs neurogenesis and disrupts cortical morphogenesis. Neuron. 2003;40:1105–1118. doi: 10.1016/s0896-6273(03)00755-4. [DOI] [PubMed] [Google Scholar]
- Lin D, Edwards AS, Fawcett JP, Mbamalu G, Scott JD, Pawson T. A mammalian PAR-3-PAR-6 complex implicated in Cdc42/Rac1 and aPKC signalling and cell polarity. Nat Cell Biol. 2000;2:540–547. doi: 10.1038/35019582. [DOI] [PubMed] [Google Scholar]
- Malatesta P, Hartfuss E, Gotz M. Isolation of radial glial cells by fluorescent-activated cell sorting reveals a neuronal lineage. Development. 2000;127:5253–5263. doi: 10.1242/dev.127.24.5253. [DOI] [PubMed] [Google Scholar]
- Manabe N, Hirai S, Imai F, Nakanishi H, Takai Y, Ohno S. Association of ASIP/mPAR-3 with adherens junctions of mouse neuroepithelial cells. Dev Dyn. 2002;225:61–69. doi: 10.1002/dvdy.10139. [DOI] [PubMed] [Google Scholar]
- Miyata T, Kawaguchi A, Okano H, Ogawa M. Asymmetric inheritance of radial glial fibers by cortical neurons. Neuron. 2001;31:727–741. doi: 10.1016/s0896-6273(01)00420-2. [DOI] [PubMed] [Google Scholar]
- Miyata T, Kawaguchi A, Saito K, Kawano M, Muto T, Ogawa M. Asymmetric production of surface-dividing and non-surface-dividing cortical progenitor cells. Development. 2004;131:3133–3145. doi: 10.1242/dev.01173. [DOI] [PubMed] [Google Scholar]
- Mizutani K, Yoon K, Dang L, Tokunaga A, Gaiano N. Differential Notch signalling distinguishes neural stem cells from intermediate progenitors. Nature. 2007;449:351–355. doi: 10.1038/nature06090. [DOI] [PubMed] [Google Scholar]
- Nishimura T, Kaibuchi K. Numb controls integrin endocytosis for directional cell migration with aPKC and PAR-3. Dev Cell. 2007;13:15–28. doi: 10.1016/j.devcel.2007.05.003. [DOI] [PubMed] [Google Scholar]
- Noctor SC, Flint AC, Weissman TA, Dammerman RS, Kriegstein AR. Neurons derived from radial glial cells establish radial units in neocortex. Nature. 2001;409:714–720. doi: 10.1038/35055553. [DOI] [PubMed] [Google Scholar]
- Noctor SC, Flint AC, Weissman TA, Wong WS, Clinton BK, Kriegstein AR. Dividing precursor cells of the embryonic cortical ventricular zone have morphological and molecular characteristics of radial glia. J Neurosci. 2002;22:3161–3173. doi: 10.1523/JNEUROSCI.22-08-03161.2002. [DOI] [PMC free article] [PubMed] [Google Scholar]
- Noctor SC, Martinez-Cerdeno V, Ivic L, Kriegstein AR. Cortical neurons arise in symmetric and asymmetric division zones and migrate through specific phases. Nat Neurosci. 2004;7:136–144. doi: 10.1038/nn1172. [DOI] [PubMed] [Google Scholar]
- Noctor SC, Martinez-Cerdeno V, Kriegstein AR. Distinct behaviors of neural stem and progenitor cells underlie cortical neurogenesis. J Comp Neurol. 2008;508:28–44. doi: 10.1002/cne.21669. [DOI] [PMC free article] [PubMed] [Google Scholar]
- Petersen PH, Zou K, Hwang JK, Jan YN, Zhong W. Progenitor cell maintenance requires numb and numblike during mouse neurogenesis. Nature. 2002;419:929–934. doi: 10.1038/nature01124. [DOI] [PubMed] [Google Scholar]
- Petersen PH, Zou K, Krauss S, Zhong W. Continuing role for mouse Numb and Numbl in maintaining progenitor cells during cortical neurogenesis. Nat Neurosci. 2004;7:803–811. doi: 10.1038/nn1289. [DOI] [PubMed] [Google Scholar]
- Rasin MR, Gazula VR, Breunig JJ, Kwan KY, Johnson MB, Liu-Chen S, Li HS, Jan LY, Jan YN, Rakic P, Sestan N. Numb and Numbl are required for maintenance of cadherin-based adhesion and polarity of neural progenitors. Nat Neurosci. 2007;10:819–827. doi: 10.1038/nn1924. [DOI] [PubMed] [Google Scholar]
- Rhyu MS, Jan LY, Jan YN. Asymmetric distribution of numb protein during division of the sensory organ precursor cell confers distinct fates to daughter cells. Cell. 1994;76:477–491. doi: 10.1016/0092-8674(94)90112-0. [DOI] [PubMed] [Google Scholar]
- Roegiers F, Jan YN. Asymmetric cell division. Curr Opin Cell Biol. 2004;16:195–205. doi: 10.1016/j.ceb.2004.02.010. [DOI] [PubMed] [Google Scholar]
- Ross SE, Greenberg ME, Stiles CD. Basic helix-loop-helix factors in cortical development. Neuron. 2003;39:13–25. doi: 10.1016/s0896-6273(03)00365-9. [DOI] [PubMed] [Google Scholar]
- Rubinson DA, Dillon CP, Kwiatkowski AV, Sievers C, Yang L, Kopinja J, Rooney DL, Zhang M, Ihrig MM, McManus MT, et al. A lentivirus-based system to functionally silence genes in primary mammalian cells, stem cells and transgenic mice by RNA interference. Nat Genet. 2003;33:401–406. doi: 10.1038/ng1117. [DOI] [PubMed] [Google Scholar]
- Sanada K, Tsai LH. G protein betagamma subunits and AGS3 control spindle orientation and asymmetric cell fate of cerebral cortical progenitors. Cell. 2005;122:119–131. doi: 10.1016/j.cell.2005.05.009. [DOI] [PubMed] [Google Scholar]
- Sauer F. Mitosis in the neural tube. J Comp Neurol. 1935;62:377–405. [Google Scholar]
- Shen Q, Zhong W, Jan YN, Temple S. Asymmetric Numb distribution is critical for asymmetric cell division of mouse cerebral cortical stem cells and neuroblasts. Development. 2002;129:4843–4853. doi: 10.1242/dev.129.20.4843. [DOI] [PubMed] [Google Scholar]
- Shi SH, Jan LY, Jan YN. Hippocampal neuronal polarity specified by spatially localized mPar3/mPar6 and PI 3-kinase activity. Cell. 2003;112:63–75. doi: 10.1016/s0092-8674(02)01249-7. [DOI] [PubMed] [Google Scholar]
- Shoukimas GM, Hinds JW. The development of the cerebral cortex in the embryonic mouse: an electron microscopic serial section analysis. J Comp Neurol. 1978;179:795–830. doi: 10.1002/cne.901790407. [DOI] [PubMed] [Google Scholar]
- Tabata H, Nakajima K. Efficient in utero gene transfer system to the developing mouse brain using electroporation: visualization of neuronal migration in the developing cortex. Neuroscience. 2001;103:865–872. doi: 10.1016/s0306-4522(01)00016-1. [DOI] [PubMed] [Google Scholar]
- Takahashi T, Nowakowski RS, Caviness VS., Jr The leaving or Q fraction of the murine cerebral proliferative epithelium: a general model of neocortical neuronogenesis. J Neurosci. 1996;16:6183–6196. doi: 10.1523/JNEUROSCI.16-19-06183.1996. [DOI] [PMC free article] [PubMed] [Google Scholar]
- Tamamaki N, Nakamura K, Okamoto K, Kaneko T. Radial glia is a progenitor of neocortical neurons in the developing cerebral cortex. Neurosci Res. 2001;41:51–60. doi: 10.1016/s0168-0102(01)00259-0. [DOI] [PubMed] [Google Scholar]
- Tawk M, Araya C, Lyons DA, Reugels AM, Girdler GC, Bayley PR, Hyde DR, Tada M, Clarke JD. A mirror-symmetric cell division that orchestrates neuroepithelial morphogenesis. Nature. 2007;446:797–800. doi: 10.1038/nature05722. [DOI] [PubMed] [Google Scholar]
- Vasioukhin V. Lethal giant puzzle of Lgl. Dev Neurosci. 2006;28:13–24. doi: 10.1159/000090749. [DOI] [PubMed] [Google Scholar]
- Weng AP, Nam Y, Wolfe MS, Pear WS, Griffin JD, Blacklow SC, Aster JC. Growth suppression of pre-T acute lymphoblastic leukemia cells by inhibition of notch signaling. Mol Cell Biol. 2003;23:655–664. doi: 10.1128/MCB.23.2.655-664.2003. [DOI] [PMC free article] [PubMed] [Google Scholar]
- Wodarz A, Huttner WB. Asymmetric cell division during neurogenesis in Drosophila and vertebrates. Mech Dev. 2003;120:1297–1309. doi: 10.1016/j.mod.2003.06.003. [DOI] [PubMed] [Google Scholar]
- Yoon K, Gaiano N. Notch signaling in the mammalian central nervous system: insights from mouse mutants. Nat Neurosci. 2005;8:709–715. doi: 10.1038/nn1475. [DOI] [PubMed] [Google Scholar]
- Yoon KJ, Koo BK, Im SK, Jeong HW, Ghim J, Kwon MC, Moon JS, Miyata T, Kong YY. Mind bomb 1-expressing intermediate progenitors generate notch signaling to maintain radial glial cells. Neuron. 2008;58:519–531. doi: 10.1016/j.neuron.2008.03.018. [DOI] [PubMed] [Google Scholar]
- Zhong W, Feder JN, Jiang MM, Jan LY, Jan YN. Asymmetric localization of a mammalian numb homolog during mouse cortical neurogenesis. Neuron. 1996;17:43–53. doi: 10.1016/s0896-6273(00)80279-2. [DOI] [PubMed] [Google Scholar]
- Zhong W, Jiang MM, Schonemann MD, Meneses JJ, Pedersen RA, Jan LY, Jan YN. Mouse numb is an essential gene involved in cortical neurogenesis. Proc Natl Acad Sci U S A. 2000;97:6844–6849. doi: 10.1073/pnas.97.12.6844. [DOI] [PMC free article] [PubMed] [Google Scholar]
- Zilian O, Saner C, Hagedorn L, Lee HY, Sauberli E, Suter U, Sommer L, Aguet M. Multiple roles of mouse Numb in tuning developmental cell fates. Curr Biol. 2001;11:494–501. doi: 10.1016/s0960-9822(01)00149-x. [DOI] [PubMed] [Google Scholar]
Associated Data
This section collects any data citations, data availability statements, or supplementary materials included in this article.