Abstract
In this paper, we report a method of precise in situ x-ray scattering measurements on protein solutions using small stationary sample cells. Although reduction in the radiation damage induced by intense synchrotron radiation sources is indispensable for the correct interpretation of scattering data, there is still a lack of effective methods to overcome radiation-induced aggregation and extract scattering profiles free from chemical or structural damage. It is found that radiation-induced aggregation mainly begins on the surface of the sample cell and grows along the beam path; the diameter of the damaged region is comparable to the x-ray beam size. Radiation-induced aggregation can be effectively avoided by using a two-dimensional scan (2D mode), with an interval as small as 1.5 times the beam size, at low temperature (e.g., 4 °C). A radiation sensitive protein, bovine hemoglobin, was used to test the method. A standard deviation of less than 5% in the small angle region was observed from a series of nine spectra recorded in 2D mode, in contrast to the intensity variation seen using the conventional stationary technique, which can exceed 100%. Wide-angle x-ray scattering data were collected at a standard macromolecular diffraction station using the same data collection protocol and showed a good signal∕noise ratio (better than the reported data on the same protein using a flow cell). The results indicate that this method is an effective approach for obtaining precise measurements of protein solution scattering.
INTRODUCTION
Small-angle x-ray scattering (SAXS) has proven to be a fundamental tool in the study of the low-resolution structure of proteins and other biological macromolecules in near physiological environments. It can reveal conformational changes in response to external conditions (for a review, see Refs. 1, 2, 3). Continuous progress in SAXS instrumentation and novel analysis methods have substantially improved the resolution and reliability of the structural models, making the method an important complementary tool for x-ray diffraction in structural biology. Wide-angle x-ray scattering (WAXS) has the potential to provide higher-resolution structural information of disordered and partially ordered systems. However, in contrast to SAXS, practical use of WAXS data has been limited by the difficulty of measuring weak protein scattering superimposed on a much stronger background from the solvent and sample container.
Solution x-ray scattering experiments including SAXS and WAXS typically require a homogeneous dilute solution of macromolecules in a near physiological buffer without special additives, i.e., a monodisperse system consisting of a random array of noninteracting identical particles. The isotropic intensity function I(s) is assumed proportional to the scattering from a single particle, averaged over all orientations. Under the illumination of an intense x-ray beam at a synchrotron radiation facility, this monodisperse assumption is unfortunately broken down due to the radiation-induced aggregation of protein, causing difficulties in the interpretation of the scattering patterns from macromolecular solutions. Radiation damage to biomacromolecules has become a serious problem in modern structural biology.
The long-standing issue in the exploitation of the solution scattering technique as a tool for structural genomics is how to extract a reliable scattering profile, free from the effects of chemical or structural damage on proteins induced by the high intensity of synchrotron x-ray sources. In the field of protein x-ray crystallography, the use of crystals at liquid-nitrogen temperatures has markedly alleviated the problem of radiation damage. Nevertheless, radiation-induced damage is still a significant problem (e.g., Ref. 4), leading to increased crystal mosaicity, Rsym, unit cell volume, and Wilson B factors.5, 6, 7, 8 Radiation exposure can also induce specific chemical and structural damage to protein crystals, such as cleavage of disulfide bonds, decarboxylation of acidic residues, and increases in individual atomic B-factors.4, 7, 9, 10, 11
The situation is much worse in protein solutions at room temperatures without cryocooling. Aggregation of the molecules becomes a significant problem during the collection of scattering data at several concentrations, which are needed to extrapolate a scattering profile to a concentration of zero. The accumulation of aggregates mostly interferes with the small-angle region, where the size and shape information of the target protein resides. For many SAXS experiments, low resolution scattering data are essential for data analysis. Guinier analysis is particularly demanding, as the scattering range over which a Guinier fit is valid moves to lower scattering angles with an increase in protein size. Accurate molecular size and shape are essential for the success of envelope based phasing.12, 13 A recent study pointed out that not only the small-angle but also the high-resolution WAXS could be influenced by the growth of radiation-induced aggregates.14
Although reduction in radiation damage is indispensable for correct interpretation of scattering data, an effective method to overcome radiation-induced aggregation in solutions at moderate temperatures is still lacking, in spite of intensive efforts in recent decades. The use of a flow cell has been successful in reducing radiation damage.14, 15 However, because of the relatively large amount of sample needed, usually at least tens of microliters for each measurement with a small capillary flow cell, and the complexity and expense of the experimental equipment, most solution scattering data to date have been measured using small stationary flat or capillary cells. Typically, solutions of several mg ml−1 concentration for the low-angle scattering region and tens of mg ml−1 concentration for the high-angle region are needed to achieve sufficient scattered intensity. Particular attention must be paid to x-ray sensitive proteins at high concentration since a single centering alignment with x rays may induce considerable change in the scattering profile in such a case. It has been reported that the addition of small amounts of materials, which are used as cryoprotectants in crystallographic experiments, such as glycerol, ethylene glycol, and sucrose, can effectively reduce radiation damage in solution.16 It is obvious, however, that this approach will lead to a variety of side effects on the protein solutions due to the cryoprotectant additive, such as alteration of protein stabilities, decrease in protein volumes, reduction in scattering contrasts, and increases in solvent viscosities, which would ultimately limit dynamic studies. Problems may arise in background scaling and subtraction because the identical concentration of cryoprotectant additive is difficult to achieve in sample and buffer due to the high viscosity of cryoprotectants. A data collection protocol alternating between protein and buffer is helpful for reducing radiation-induced protein damage, but aggregation of the molecules becomes inevitable when collecting the multiple data sets at different concentrations, which are required for extrapolating a scattering profile to a concentration of zero. Detailed methodological studies on stationary cells are needed to find an alternative method to the flow cell for avoiding radiation damage to protein samples. A small sample cell, with sample volume down to ∼10 μl, is also highly desirable.
We tackle this radiation-damage problem by measuring solution scattering data using a two-dimensional (2D) scan data collection mode at low temperature, in combination with small x-ray beam size. We designed three sets of solution scattering experiments to investigate the changes in scattering curves upon exposure to high intensity x rays. The first comprised measurement of the SAXS profile of a sensitive protein, bovine hemoglobin (bHb), under stationary (ST), and 2D modes of data acquisition. The second used detailed comparative measurements on samples of bovine serum albumin (BSA), the most common SAXS standard for molecular determination, at 4 and 20 °C, to investigate the temperature effect and whether radiation damage is negligible when just six exposures are taken in conventional stationary experiments. The last set of experiments were performed to demonstrate the capability of taking WAXS measurements on a protein solution to a resolution of 2.5 Å (or q=2.5 Å−1) at a traditional macromolecular diffraction station. We find that the low temperature 2D scan protocol can effectively eliminate observable changes in scattering due to radiation damage, i.e., it minimizes the radiation damage. Although the present example is focused on protein solution scattering, the method should be applicable to structural studies of other macromolecules as well.
EXPERIMENT AND METHOD
Materials
Bovine erythrocyte hemoglobin (molecular weight 64.5 kDa) from CalBiochem was dissolved in sterile phosphate-buffered saline (137 mM NaCl, 2.7 mM KCl, 10 mM Na2HPO4, and 2 mM KH2PO4) to 60 mg∕ml. BSA from Sigma was dissolved in 50 mM HEPES buffer with pH7.0 to 30 mg∕ml. Equine hemoglobin was dissolved in 50 mM HEPES buffer with pH7.0 to 30 mg∕ml. To remove high molecular weight protein aggregates from solution, protein samples were centrifuged through a centrifugal device at 10 000 rpm for 10 min prior to beam exposure. The upper clear liquids were kept for further x-ray scattering experiments.
Sample cell
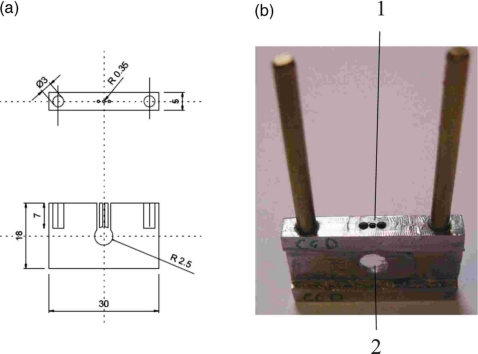
The sample cell system consists of two components, which are a water-cooled copper cell holder and an inner sample cell (Fig. 1). This system serves multiple purposes including the following: (1) facilitating fast sample and window changes, (2) minimizing sample volume and solution evaporation, and (3) providing low temperature and a chemically resistant enclosure for the protein sample. The removable inner sample cell (see Fig. 1) allows sample changes outside the water-cooled cell holder for SAXS or WAXS measurements. Samples are encapsulated in a 20 μl volume sandwiched between two thin parallel mica windows 1 mm apart. The mica sheets are glued on the faces of a stainless steel body, which is 1 mm thick in the central area. A hole 5.0 mm in diameter is drilled through the center, and three other holes of 0.7 mm diameter are drilled from the top of the steel body into the 5 mm hole to allow escape of bubbles formed during sample loading. Such a cell configuration can minimize solution evaporation and keep protein concentration stable during experiments. Stainless steel was chosen for its chemical resistance, thermoconductivity, and biocompatibility. Another cell with a polymer body of 2.2 mm thickness is also used for fast mica window replacement and experiments with higher energy incident x rays. The polymer body has a hole of 2.5 mm diameter through the center and a 1.2×1.0 mm2 channel running from the edge of the body to the central hole.17 A thin film of pressure-sensitive adhesive is spread on two sides of the cell. The cells facilitate rapid and easy window changes, eliminate the need to clean the cell between sample changes, and reduce the sample volume to as low as 10 μl. A water-tight cell is made by simply covering the center hole with a small mica sheet and pressing slightly. The sample is aligned by centering the aperture using an attenuated beam. Each sample cell can be reused for alternating buffer and protein measurements.
Figure 1.
(a) Side and top views of the inner sample cell with a three-hole configuration for sample loading; (b) photograph of the inner sample cell. In (b), 1: Loading holes, 2: Sample chamber.
The sample cell, with windows normal to the x-ray beam, is inserted into a copper sample holder, which is mounted on an X–Z translation stage and has a slot on the top to access the sample cell. SAXS experiments are usually carried out in a sample holder maintained at 4.0±0.1 °C by circulating water chilled to 3.4±0.1 °C. The holder can also be heated, easily reaching a temperature as high as 85 °C, facilitating the study of hydration of biological macromolecules, which may have an important role in their structural stability and functions.18
Small-angle x-ray scattering experiment
SAXS measurements were carried out at the Cornell High Energy Synchrotron Source (CHESS) G1 Station, equipped with a multilayer monochromator. Upstream of the sample, an 8.02 keV 300×300 μm2 beam was defined by helium-enclosed slits. Downstream of the sample, a 0.5 m vacuum flight path (∼10 mTorr) was installed between the sample and a 1024×1024 pixel charge coupled device (CCD) area detector (FLICAM). A PIN diode beamstop positioned close to the detector blocked the nonscattered beam while recording the transmitted intensity. The x-ray flux at the sample was approximately 1012 photons per second.
In order to assess the effects of radiation dose on proteins, two scattering data-collection modes were employed. (i) Data collected as a series of 10 s exposures from protein samples sitting stationary within the sample cell in the beam path (ST or stationary mode). (ii) Data collected for 10 s exposures at each spot of a 2D matrix with a spatial interval of 0.4 mm on protein samples (2D mode). Diffraction from silver behenate, a SAXS calibrant with a lamellar spacing of 58.376 Å,19, 20 was used to locate the beam center, calibrate sample-detector distance, and convert from image pixel coordinates to scattering vector q. The 2D scattering patterns were azimuthally integrated to one-dimensional scattering intensity profiles using the program FIT2D.21
Data reduction included normalization of the one-dimensional scattered data to the intensity of the transmitted beam and subtraction of the background scattering of the buffer. All of the scattering curves were then standardized to that of a protein concentration of 1 mg∕ml. The low angle data were extrapolated to infinite dilution and merged with the high angle data measured at high protein concentrations to yield a final SAXS curve.
Wide-angle x-ray scattering experiment
WAXS data were collected at the Cornell High Energy Synchrotron Source (CHESS) F1 station. A small copper sample holder, with a slot on top to access the sample cell, was cooled by chilling water running at 3.4 °C and attached to the spindle of the goniometer normally used for crystal mounting. The inner sample cell was the same as for the SAXS experiment. The experimental layout was as follows: A nitrogen-gas-filled ion chamber was used to record the x-ray beam intensity. In-vacuum guard slits were set to remove low-angle scatter from the x-ray optics and upstream windows. Beamline components were positioned as close together as possible to minimize air scattering. A tiny beamstop was located just downstream of the sample cell, positioned to minimize the x-ray background. A helium flight path with a Be entrance window and a thin mylar exit window was positioned between the sample cell and the detector. Scattering from the Be entrance and mylar exit windows was negligible because the direct beam was blocked by the tiny beam stop positioned in front of the Be window. The x-ray beam, with wavelength 0.9179 Å, was focused to 100 μm (full width at half maximum) at the sample position. An ADSC Quantum-270 CCD detector was positioned 293.76 mm from the sample. 2D translations of the goniometer normal to the incident x-ray beam were employed to accomplish a 2D scan with a spatial interval of 150 μm. Other experimental details were the same as for conventional crystal diffraction.
Crystallization and x-ray diffraction data collection
Crystals of equine hemoglobin (hHb) were obtained using the vapor-diffusion method and the Index crystallization screen from Hampton Research. Initial protein concentration was 20 mg∕ml in 50 mM HEPES at pH7.0. The best crystals, up to 1.0 mm in their maximum dimension, were obtained from the Index F3 conditions (5% v∕v Tacsimate pH7.0; 0.1M HEPES pH7.0 buffer; precipitant: polyethylene glycol monomethyl ether 5000). Crystallization of porcine hemoglobin (pHb) was carried out using the vapor-diffusion method under crystallization conditions similar to those described previously:22 pHb was dissolved in distilled water to a concentration of 60–80 mg∕ml, and a 2.8M phosphate solution, pH6.5–7.5 (made by mixing K2HPO4 and NaH2PO4), was used as the precipitant. The best pHb crystal diffracted to 1.9 Å resolution.
Crystallographic diffraction data were collected at the CHESS F2 station. Data sets of single-wavelength anomalous dispersion data on horse hemoglobin were collected at the iron K-edge (peak), while data sets of porcine hemoglobin were collected at 12.658 keV. Data reduction and scaling were performed with HKL-2000.23
RESULTS AND DISCUSSION
In SAXS experiments at high-brilliance synchrotron sources, protein aggregation results from radiation damage. Concentrated samples are much more susceptible to this aggregation than dilute ones. Hence, solution scattering experiments on proteins are usually carried out at a low protein concentration to minimize effects on scattering data in the small-angle region caused by aggregation or by ordering due to repulsive intermolecular interactions. To find a method to overcome such x-ray induced aggregation, we employed a sensitive protein, bHb, with a high protein concentration of 60 mg∕ml, in SAXS and WAXS experiments.
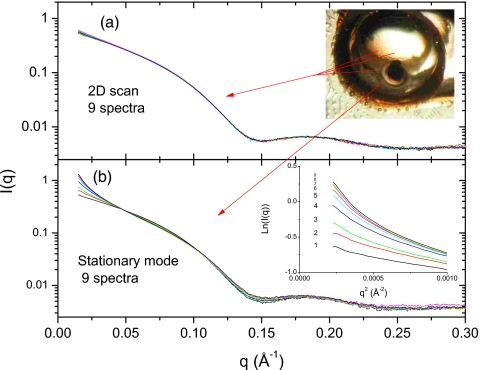
Figure 2 shows a data set of nine scattering profiles taken in 2D mode (nine shots at 10 s. each=90 s total exposure) contrasted with nine ST shots (9×10 s=90 s total exposure). The patterns for hemoglobin demonstrate significant differences between the 2D and the ST modes. The 2D data sets are nearly identical to each other, while the protein sample in the ST mode shows clear signs of degradation across the series. In ST mode, protein aggregation interferes significantly with the small-angle region where the size and shape information of the target proteins resides. Guinier plots of serially measured scattering curves [inset in Fig. 2b] exhibit obvious upward curvature as exposure increases. For many SAXS experiments, low-q data are essential for data analysis. Guinier analysis is particularly demanding as the q range over which a Guinier fit is valid moves to lower q with an increase in protein size. In addition, significant curve flattening can be seen in the range from 0.1 to 0.2 Å−1 using ST mode. The upper inset in Fig. 2a shows a photograph of the sample cell taken after the experiment, with the liquid sample removed. Dense precipitate was found to block the x-ray path with ST mode, while the areas used for 2D mode remained clear.
Figure 2.
Comparison of the solution scattering profiles obtained from hemoglobin using the 2D data-collection mode (a) and the ST data-collection mode (b). This curve set is a series of nine measured scattering profiles from a single stationary protein solution, in the exposure order of black(1)∕red(2)∕green(3)∕blue(4)∕cyan(5)∕magenta(6)yellow(7)∕dark yellow(8)∕navy(9). Inset shows the Guinier plot of ST mode data. Note that the ST mode curve shows clear upward curvature in the small angle region, indicating that aggregation has occurred. Top inset is a photograph of the sample chamber, without liquid sample, after experiments using 2D and ST modes.
It is known that the reaction of the incident x-rays with water molecules creates hydroxyl or hydroperoxyl radicals that rapidly attach to the backbones and∕or side chains of proteins. In many cases, the interactions between the radical-activated proteins give rise to radiation-induced aggregates connected to each other by covalent and∕or noncovalent bonds.24 As shown in Fig. 2a, data collection in the 2D mode can markedly alleviate the problem of radiation damage in solution scattering. In the 2D mode, the hydroxyl or hydroperoxyl radicals produced by x-ray exposure are distributed in a much larger area than for the ST mode, which reduces the effect of radical accumulation on protein molecules.
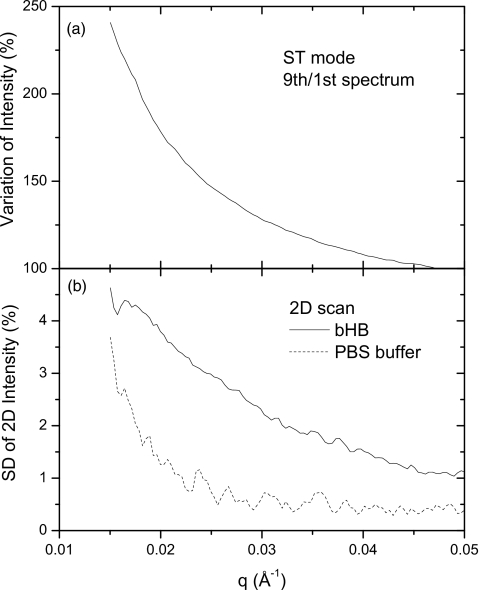
Detailed analysis of the x-ray induced variation in intensity is shown in Fig. 3. An increase of over 100% is found in the small angle region for the ST mode Fig. 3a, while the standard deviation (SD) among the same number of spectra in the 2D mode is less than 5% (Fig. 3b. Similar behavior is found for the SD of buffer as for that of protein, implying that the origin of the 5% SD might be related to beam characteristics, slight inhomogeneities in the mica windows, and possible microbubbles in the liquid.
Figure 3.
(a) X-ray induced variation in intensity over a series of spectra for ST data-collection mode; (b) SD of nine 2D mode scattering curves as a function of scattering vector.
The scattering intensity I(q,c), expressed by the Guinier equation,25
| (1) |
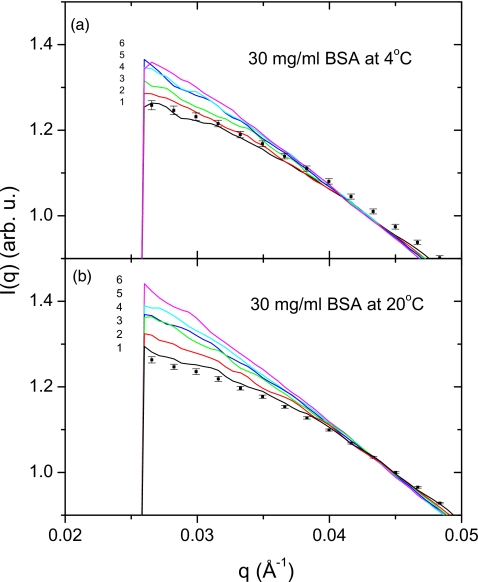
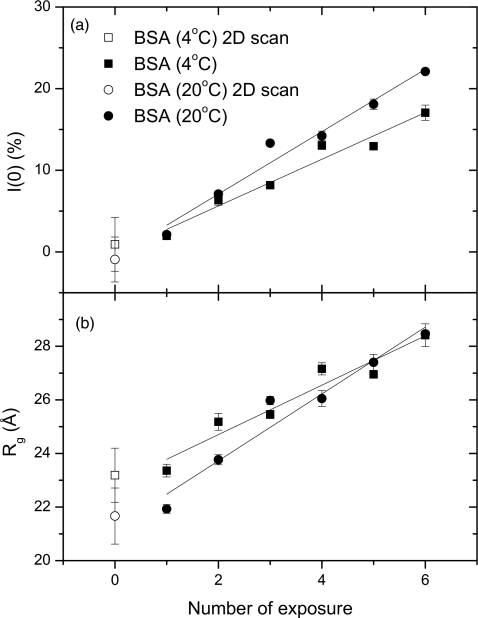
is a function of the scattering vector q and the protein concentration c. Here I(0,c) is the forward scattering intensity, and Rg(c) is the apparent radius of gyration at finite concentration. Figure 4 shows scattering data from 30 mg∕ml BSA solution at 4 °C [Fig. 4a] and 20 °C [Fig. 4b], taken using the ST and 2D modes, respectively. In solution scattering experiments, BSA is the most common SAXS standard material for molecular weight determination. Thus, understanding∕eliminating its radiation damage is very important for correctly scaling the molecular weight of the protein under study. In Fig. 4, squares with error bars represent the data obtained using 2D mode, while lines are used for the series of ST exposures. It can be seen that even a few exposures can remarkably change the scattering profile of BSA, and exceed the error bars of the 2D mode. It should be noted that the ST data at 20 °C move upwards faster than those at 4 °C, implying that lower temperature is helpful for reducing protein aggregation, i.e., radiation damage.
Figure 4.
Solution scattering profiles obtained from BSA at 30 mg∕ml using the ST data-collection mode at 4 °C (a) and 20 °C (b). Six spectra are shown in the exposure order of black(1)∕red(2)∕green(3)∕blue(4)∕cyan(5)∕magenta(6). Points with error bars are the average spectra from the 2D data-collection mode for comparison.
At low protein concentrations, the forward scattering intensity I(0,c) may be written as
| (2) |
where Kc is a constant determined by using a series of concentrations of BSA, molecular mass 67 kDa, as a reference protein.26MW is the molecular weight of the protein and can be obtained by extrapolating Kc∕I(0,c) to infinite dilution. A2 is the second virial coefficient, resulting from interparticle interference effects and can discriminate between attractive and repulsive interactions. Repulsive interactions lead to positive values of A2, and attractive interactions lead to negative values.
At the dilute limit, Rg(c) is given by
| (3) |
where R0 is the radius of gyration at infinite dilution, and Bif is a parameter reflecting intersolute force potential.27 The sign of Bif means the same as that of A2.
Figure 5 shows the detailed data analysis on the forward scattering intensity and radius of gyration of BSA in solution, quantitatively evaluated at 4 and 20 °C. The 2D data sets both at 4 °C [Fig. 5a] and at 20 °C [Fig. 5b] have the lowest I(0) and apparent radius of gyration, Rg demonstrating the efficiency of 2D mode. Moreover, the slopes of I(0) and Rg at 4 °C are lower than at 20 °C, showing that low temperature is helpful in reducing the protein aggregation slope.
Figure 5.
Comparison of (a) forward scattering, I(0) and (b) radius of gyration Rg of BSA (pH7.0) as a function of exposure at 4 and 20 °C, respectively. Open symbols are the values measured with the 2D data-collection mode at these temperatures.
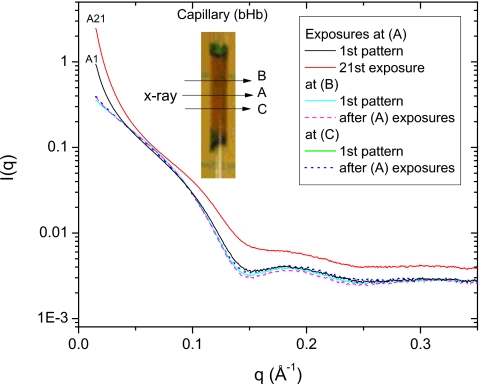
Figure 6 shows the scattering data of bHb at 60 mg∕ml obtained using a quartz capillary cell 1 mm in diameter. The cell was aligned using a horizontal x-ray scan across the capillary, with a step size of 50 μm and an exposure time of 1 s. The first scattering spectrum (black curve) was collected at the center of the scanned region, i.e., at the (A) position (Fig. 6, inset). The capillary cell was then moved 500 μm along the capillary for exposures at (B) (cyan∕thin gray curve) and (C) (green∕thick gray curve), without further alignment. The small angle region of the first scattering spectrum taken at (A) is much higher than that at (B) and (C), implying that the single x-ray alignment scan can significantly change the aggregation state of a sensitive protein. The effect of multiple exposures was evaluated at position (A) by taking an additional 20 exposures; the last of these is shown in Fig. 6 (top red∕gray curve). There are huge differences between the curves from the first and last exposures, reflecting the growth of protein precipitation inside the sample cell along the x-ray beam. Scattering spectra were subsequently collected at position (B) (magenta∕dashed curve) and position (C) (blue∕dotted curve) to check the effect of neighboring intensive exposures at position (A). As shown in Fig. 6, the scattering spectra taken at (B) and (C) positions exhibit good consistency, indicating the localization of radiation damage induced by multiple exposures at (A), with negligible influence on neighboring areas. The unexposed area between (A) and (B)∕(C) positions is only 200 μm, i.e., just slightly larger than the beam size. It is found that even a slight precipitation cloud is strongly attached to the cell wall and almost impossible to remove by flushing after the experiment. A capillary cell is often used in flow cell experiments to minimize sample volume, and a slow rate of flow may also be used to conserve protein samples. Radiation-induced aggregation accumulates first at the cell wall, where the flow velocity is zero no matter how fast the center velocity is, and can propagate some distance out into the cell, especially if the flow rate is low. For x-ray sensitive proteins, the growth of protein aggregation along the x-ray beam path inside the sample cell would produce increasing scattering imposed on the real solution and buffer scattering. To avoid troubles in background scaling and subtraction, a fresh cell area every few exposures is obviously better than a stationary cell, even one with a flowing sample inside it.
Figure 6.
Localization of radiation-induced aggregation by multiple exposures at position (a). After center alignment by x rays at the (a) position, first scattering spectra were collected at (a) (black, A1), (b) (cyan∕thin gray), and (c) (green∕thick gray). After 20 sequential exposures were performed at (a) (spectrum from the last: red∕top gray curve, A21), scattering spectra were collected at (b) (magenta∕thin dash curve) and (c) (blue∕thick dot curve).
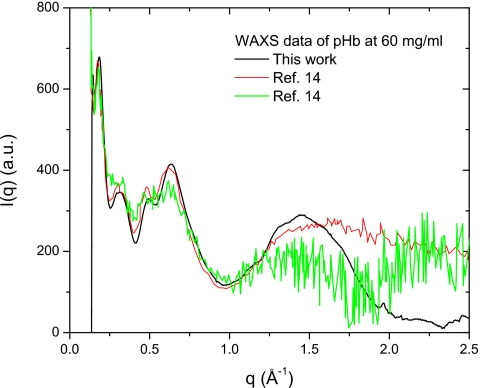
It is known that WAXS is a sensitive indicator of conformational changes of a protein in solution and can serve as a monitor of the effect of chemical denaturing conditions on proteins. We have succeeded in performing WAXS at a standard macromolecular diffraction station using the same 2D data collection mode to a resolution of 2.5 Å (or q=2.5 Å−1). Figure 7 shows WAXS data of bHb at 60 mg∕ml using the 2D mode (black curve), compared to flow cell data on the same protein taken from Ref. 14. Besides the excellent signal∕noise (S∕N) ratio, which profits from more solution scattering data and stable buffer scattering in 2D mode, the WAXS data measured in the present work show no evidence of degradation, which is signified by the flattening of peaks from 0.2 to 0.6 Å−1 and collapse of the peak at 1.5 Å−1 (green∕thick gray curve), as described in Ref. 14.
Figure 7.
WAXS data of bHb at 60 mg∕ml measured at a standard macromolecular diffraction station (CHESS F1) using a small stationary cell with the 2D mode (black). For comparison, scattering data of the same bHb protein with a flow cell (red, thin gray) and a similar ST mode (green, thick gray) were taken from Ref. 14. Note that the black curve has much better S∕N ratio and no sign of degradation.
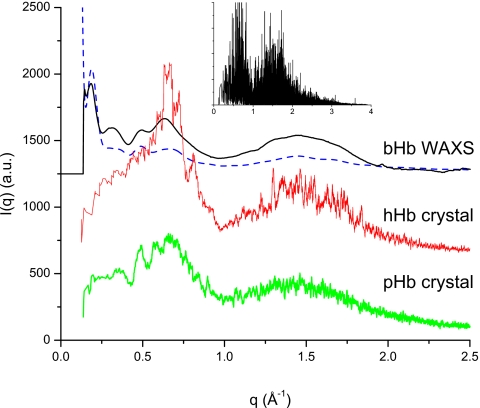
In addition, a distinct peak is located in the region of 1.0 to 2.0 Å−1 in contrast to the data from the flow cell (red∕thin gray curve). To crosscheck and assess the validity of WAXS data at crystallographic resolution, we employed crystallographic data of hemoglobins. Figure 8 shows the scattering curves calculated from the x-ray crystallographic data of pHb (bottom curve) and hHb (middle curve), together with the WAXS data (top curve) of Fig. 7. The inverse d spacing, calculated with the MTZDUMP program of CCP4,28 was translated to q. For clarity, the 34 391 reflections in the data set (inset in Fig. 8) of hHb and the 43 227 reflections from pHb were smoothed using a 50-point running average, and the curves were offset along the y-axis. All the crystallographic data exhibit a clear maximum at approximately 1.5 Å−1, confirming that the solution scattering peaks at this location are real and not artifacts arising from improper data reduction. Figure 8 also shows the theoretical solution scattering curve (dashed curve) calculated from the crystallographic coordinates of bovine hemoglobin (PDB file: 1G09)29 and fit to the experimental data by the program CRYSOL (Ref. 30) (version 2.6, http:∕/www.embl-hamburg.de∕ExternalInfo∕Research∕Sax∕crysol.html), using 50 spherical harmonics and default parameters for calculation of the solvation shell and particle envelope. There is considerable deviation between the experimental WAXS data and the theoretical curve calculated using CRYSOL, indicating that the intramolecular structure, which is assumed to be unity in the representation by spherical harmonics, should be taken into account in the interpretation of solution WAXS data at crystallographic resolution.
Figure 8.
Smoothed crystallographic data of pHb (bottom curve) and hHb (middle curve) together with bHb WAXS data of Fig. 7 (top solid curve). The dashed curve is the theoretical fitting curve of bovine hemoglobin (PDB file: 1G09) calculated using CRYSOL with 50 spherical harmonics. The inverse d spacing, calculated with the MTZDUMP program of CCP4 (Ref. 28), was translated to q. The inset shows the original reflections of the hHb data set. All crystallographic data exhibit a peak in the region of 1.0 to 2.0 Å−1 confirming the significance of the corresponding peak in the WAXS curve. There is considerable underestimation of the experimental WAXS data by the sum-of-spherical-harmonics curve produced using CRYSOL.
The results clearly illustrate that data collection using the 2D mode with a small stationary cell is a viable approach for precise measurements on protein solution scattering, with quality at least as good as that of the flow cell method. It should be mentioned that the sample area illuminated by x-rays in the present 2D measurements is only 0.16 mm2 for WAXS and 1.21 mm2 for SAXS data, corresponding to a volume of about 0.2 and 1.5–3.0 μl, respectively, implying that the sample volume for solution scattering with the described method could be much smaller, perhaps down to the order of 1 μl.
CONCLUSIONS
In summary, we have introduced an effective method for precisely measuring x-ray scattering, including SAXS and WAXS, from protein solutions. It has been proven to markedly alleviate the problem of radiation damage induced by brilliant synchrotron sources. More reliable scattering data could be obtained by a combination of a 2D scan and low temperature (e.g., 4 °C) than with the ST mode, especially for an x-ray sensitive protein. The results clearly illustrate that the method of 2D mode is an alternative approach to the flow cell for precise measurements on protein solution scattering. This method would be applicable for in situ determination of x-ray scattering curves of protein solutions and other x-ray sensitive biological macromolecular materials using an ultrasmall stationary sample cell.
ACKNOWLEDGMENTS
We would like to thank M. Szebenyi for critical reading of the manuscript and R. Gillilan and A. Woll for their help in the experiment. This work is based on research conducted at the CHESS, which is supported by the National Science Foundation under Award No. DMR 0225180, using the Macromolecular Diffraction at CHESS (MacCHESS) facility, supported by Award No. RR-01646 from the National Institutes of Health through its National Center for Research Resources.
References
- Trewhella J., Curr. Opin. Struct. Biol. 7, 702 (1997). [DOI] [PubMed] [Google Scholar]
- Koch M. H. J., Vachette P., and Svergun D. I., Q. Rev. Biophys. 10.1017/S0033583503003871 36, 147 (2003). [DOI] [PubMed] [Google Scholar]
- Grossmann J., J. Appl. Crystallogr. 40, s217 (2007). [Google Scholar]
- Ravelli R. B. and McSweeney S. M., Structure (London) 10.1016/S0969-2126(00)00109-X 8, 315 (2000). [DOI] [PubMed] [Google Scholar]
- O’Neill P., Stevens D. L., and Garman E. F., J. Synchrotron Radiat. 10.1107/S0909049502014553 9, 329 (2002). [DOI] [PubMed] [Google Scholar]
- Murray J. and Garman E., J. Synchrotron Radiat. 10.1107/S0909049502014632 9, 347 (2002). [DOI] [PubMed] [Google Scholar]
- Teng T. -Y. and Moffat K., J. Synchrotron Radiat. 10.1107/S0909049500008694 7, 313 (2000). [DOI] [PubMed] [Google Scholar]
- Teng T. -Y. and Moffat K., J. Synchrotron Radiat. 10.1107/S0909049502008579 9, 198 (2002). [DOI] [PubMed] [Google Scholar]
- Helliwell J. R., J. Cryst. Growth 10.1016/0022-0248(88)90322-3 90, 259 (1988). [DOI] [Google Scholar]
- Burmeister W., Acta Crystallogr., Sect. D: Biol. Crystallogr. 10.1107/S0907444999016261 56, 328 (2000). [DOI] [PubMed] [Google Scholar]
- Weik M., Ravelli R. B. G., Kryger G., McSweeney S., Raves M. L., Harel M., Gros P., Silman I., Kroon J., and Sussman J. L., Proc. Natl. Acad. Sci. U.S.A. 10.1073/pnas.97.2.623 97, 623 (2000). [DOI] [PMC free article] [PubMed] [Google Scholar]
- Hao Q., Dodd F. E., Grossmann J. G., and Hasnain S. S., Acta Crystallogr., Sect. D: Biol. Crystallogr. 10.1107/S0907444998011342 55, 243 (1999). [DOI] [PubMed] [Google Scholar]
- Hao Q., Acta Crystallogr., Sect. D: Biol. Crystallogr. 10.1107/S0907444906014089 62, 909 (2006). [DOI] [PubMed] [Google Scholar]
- Fischetti R. F., Rodi D. J., Mirza A., Irving T. C., Kondrashkina E., and Makowski L., J. Synchrotron Radiat. 10.1107/S0909049503016583 10, 398 (2003). [DOI] [PubMed] [Google Scholar]
- Lipfert J., Millett I. S., Seifert S., and Doniach S., Rev. Sci. Instrum. 10.1063/1.2194484 77, 046108 (2006). [DOI] [Google Scholar]
- Kuwamoto S., Akiyama S., and Fujisawa T., J. Synchrotron Radiat. 10.1107/S0909049504019272 11, 462 (2004). [DOI] [PubMed] [Google Scholar]
- Ando N., Chenevier P., Novak M. et al. , J. Appl. Crystallogr. 10.1107/S0021889807056944 41, 167 (2008). [DOI] [Google Scholar]
- Israelachvili J. and Wennerstrom H., Nature (London) 10.1038/379219a0 379, 219 (1996). [DOI] [PubMed] [Google Scholar]
- Huang T. C., Toraya H., Blanton T. N., and Wu Y., J. Appl. Crystallogr. 10.1107/S0021889892009762 26, 180 (1993). [DOI] [Google Scholar]
- Blanton T. N., Huang T. C., Toraya H., Hubbard C. R., Robie S. B., Louer D., Goebel H. E., Will G., Gilles R., and Raftery T., Powder Diffr. 10, 91 (1995). [Google Scholar]
- Hammersley A. P., Svensson S. O., Hanfland M., Fitch A. N., and Hausermann D., High Press. Res. 10.1080/08957959608201408 14, 235 (1996). [DOI] [Google Scholar]
- Lu T. -H., Panneerselvam K., Liaw Y. -C., Kan P., and Lee C. -J., Acta Crystallogr., Sect. D: Biol. Crystallogr. 56, 304 (2000). [DOI] [PubMed] [Google Scholar]
- Otwinowski Z., Minor W., and C. W.Carter, Jr., Methods in Enzymology (Academic, New York, 1997), Vol. 276, p. 307. [DOI] [PubMed] [Google Scholar]
- Garrison W. M., Chem. Rev. 87, 381 (1987). [Google Scholar]
- Guinier A. G. and Fournet G., Small Angle Scattering X-rays (Wiley, New York, 1955). [Google Scholar]
- Porod G., Small Angle X-ray Scattering (Academic, London, 1982). [Google Scholar]
- Izumi Y., Kuwamoto S., Jinbo Y., and Yoshino H., FEBS Lett. 495, 126 (2001). [DOI] [PubMed] [Google Scholar]
- Collaborative Computational Project, Number 4, Acta Crystallogr., Sect. D: Biol. Crystallogr. 10.1107/S0907444994003112 50, 760 (1994). [DOI] [PubMed] [Google Scholar]
- Mueser T. C., Rogers P. H., and Arnone A., Biochemistry 39, 15353 (2000). [DOI] [PubMed] [Google Scholar]
- Svergun D., Barberato C., and Koch M. H. J., J. Appl. Crystallogr. 10.1107/S0021889895007047 28, 768 (1995). [DOI] [Google Scholar]


