Abstract
Objective
This study was conducted to determine whether increased body mass index (BMI) affects oral contraceptive (OC) pharmacokinetics and suppression of hypothalamic-pituitary-ovarian (HPO) axis activity.
Study design
Ovulatory reproductive-age women of normal (< 25 kg/m2; n = 10) and obese (> 30 kg/m2; n = 10) BMI received OCs for two cycles (prospective cohort). Subjects were admitted for two 48-h inpatient stays at the beginning and end of the hormone-free interval. Ethinyl estradiol (EE) and levonorgestrel (LNG) levels were evaluated during both inpatient stays. Gonadotropin pulsatility (FSH and LH) was measured during the second inpatient stay. Estradiol (E2) and progesterone (P) were measured daily during inpatient stays and twice per week in Cycle 2.
Results
BMI was greater in the obese, compared to the normal BMI group [37.3 kg/m2 (SD 6.0) versus 21.9 kg/m2 (SD 1.6); p < 0.05]. The LNG half-life was significantly longer in the obese group (52.1 ± 29.4 h versus 25.6 ± 9.3 h, p < 0.05) which correlated with a lower maximum LNG concentration on Cycle 2, Day 1 [1.9 ng/mL (SD 0.5) versus 2.5 ng/mL (SD 0.7)] and a longer time to reach steady-state (10 versus 5 days), in obese women. There were no significant differences in volume of distribution between groups. LH pulse parameters did not differ statistically between groups but trended towards greater HPO activity in the obese group. Additionally, more obese (6/10 versus 3/10 normal BMI, p > 0.05) women exhibited E2 levels consistent with development of a dominant follicle, and P levels consistent with ovulation (2/10 versus 1/10) during Cycle 2.
Conclusions
Compared to women of normal BMI, obese women exhibit differences in OC pharmacokinetics that are associated with greater HPO activity.
1. Introduction
Forty-nine percent of all pregnancies in the United States are unintended, and about half of these occur in couples using contraception [1]. Recent epidemiologic evidence suggests that obese women may have higher rates of hormonal contraceptive failure than women of normal body mass indices (BMI) [2,3]. However, this finding is not present in many studies [4–6]. If a difference in contraceptive efficacy does exist, identifying the mechanism for failure is critical to creating a contraceptive strategy with better efficacy for obese women.
In general, the effect of obesity on drug pharmacokinetics is poorly understood. This is particularly true of oral contraceptives (OCs), as most investigational studies have excluded women over 130% of ideal body weight, and no prior studies exist regarding OC pharmacokinetics in obese women. Depending on the drug studied, BMI can affect pharmacokinetics in several different ways including bioavailability and hepatic clearance [alterations in enzymatic proteins (CYP3A activity)], renal clearance (alterations in glomerular filtration and/or secretion), and volume of distribution (lipophilic properties and/or alterations in levels of drug binding proteins) [7].
The main contraceptive effect of OCs is via negative feedback inhibition of the hypothalamic-pituitary-ovarian (HPO) axis, which has only been studied in normal BMI women [8]. A difference in OC pharmacokinetics due to obesity could lead to inadequate suppression of the HPO axis, thus allowing follicular development to occur leading to ovulation. This study was designed to determine whether increased BMI affects OC pharmacokinetics and the suppression of the HPO axis.
2. Materials and methods
A prospective cohort study was conducted at Oregon Health & Science University (OHSU) in Portland, Oregon, from March 2006 to September 2007. The OHSU Institutional Review Board and OHSU Clinical & Translational Research Institute (OCTRI) approved the study protocol and all patients underwent informed written consent.
Twenty, healthy, reproductive-aged (18–35 years old) women, not currently using hormonal contraception but seeking to initiate contraception with COCs, were recruited. Subjects were either of normal (BMI < 25 kg/m2) or obese BMI (BMI >30 kg/m2) with regular menstrual cycles, not actively seeking weight gain or loss, no evidence of anemia (hematocrit ≥ 36%), no contraindications to hormonal contraception, no use of tobacco or drugs known to interfere with the metabolism of sex steroids, and no overt clinical features of or prior treatment for metabolic disorders (i.e., polycystic ovarian syndrome).
To ensure enrollment of ovulatory women, a progesterone level of ≥3 ng/mL was confirmed during the luteal phase (Days 18 to 25) of the menstrual cycle prior to treatment with OCs. Demographic information was gathered along with several obesity biomarkers including weight, height, body composition measurements by air displacement plethysmorgraphy, and waist-to-hip ratios.
All study subjects were placed on a combination monophasic birth control pill containing 20 mcg ethinyl estradiol (EE)/100 mcg levonorgestrel (LNG) (Alesse; Wyeth, Madison, NJ) at the onset of menses following the pre-treatment cycle. The medication was dosed in a cyclic fashion (21 days active pill with a 7-day hormone-free interval) for a total of two treatment cycles. Women were instructed to take the pill at 0900 AM daily. Self-reported compliance with the medication was recorded on a calendar and women were also asked to contact investigators if there was a delay in time of pill ingestion and/or missed 2 or more pills in 1 cycle. Two or more delayed and/or missed pills prompted study withdrawal (women were not informed of this consequence but were educated regarding the importance of compliance).
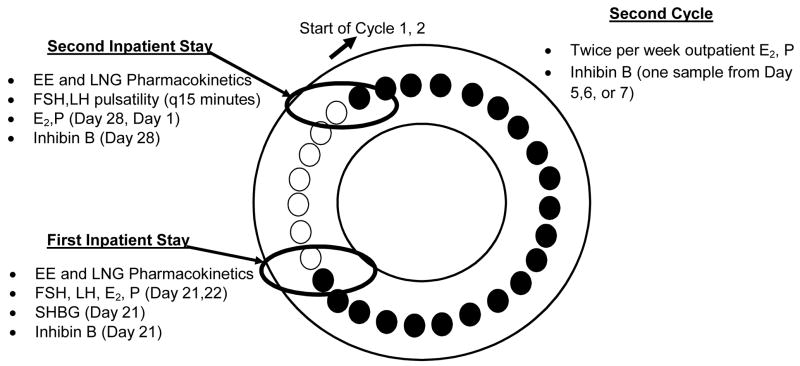
The study flow is illustrated in Fig. 1. Serum samples were obtained during two 48-h inpatient stays [on the last day of active pills (Cycle 1, Day 21) to the first day of the 7-day hormone-free interval (Cycle 1, Day 22) and at the end of the 7-day hormone-free interval to the first day of active pills in Cycle 2 (Cycle 1, Day 28 – Cycle 2, Day 1)] and also during outpatient visits, twice per week during Cycle 2.
Figure 1.
Study flow after eligibility cycle (black circles = active pills, white circles = 7-day hormone OC-free interval or placebo pills)
2.1. Pharmacokinetics & Sex Hormone Binding Globulin: timing of samples and assay characteristics
As pharmacokinetic measurements can vary after single and multiple dose exposure, samples were obtained at two specific time points that represent the cumulative steady-state exposure of a 21-day cycle [following 21 days of active pills (Cycle 1, Day 21-Day 22)] and the effect of re-initiation of the next cycle after the 7-day hormone-free interval (Cycle 1, Day 28-Cycle 2, Day 1) (see Fig. 1). EE and LNG levels were measured in serum samples collected during the first inpatient stay on Cycle 1, Day 21 at 0 (0900 AM; time of drug ingestion), and 0.5, 1, 1.5, 2, 3, 4, 6, 8, 12 h and continued on Cycle 1, Day 22 (first day of hormone-free interval in Cycle 1 at 0 (0900 AM), 4, 8, 12, 24 h. This process was repeated on Cycle 1, Day 28 (last day of the hormone-free interval) until the completion of the second 48-h stay except the sampling protocol was reversed [starting on Cycle 1, Day 28 at 0, 4, 8, 12 h and then initiating the more intensive monitoring at time zero (0900 AM) on Cycle 2, Day 1 (first active treatment day of Cycle 2)].
Assays were performed at the University of Southern California. LNG and EE levels in serum samples were quantified by specific and sensitive radioimmunoassays (RIAs) as described previously [9,10]. Prior to RIA, each analyte was extracted with ethyl acetate:hexane (3:2) and separated by Celite column partition chromatography to remove interfering steroids. Procedural losses were estimated by adding approximately 800 dpm of titrated internal standard (3H-LNG or 3H-EE) to the serum prior to the extraction step. The losses ranged from 20–30% and the values were used to correct the RIA results. A highly specific antiserum was used in conjunction with an iodinated radioligand in each RIA. Separation of free from antiserum-bound LNG or EE was achieved by use of a second antibody. The sensitivities of these RIAs are 0.05 ng/mL for LNG and 15 pg/mL for EE. Intra-assay and inter-assay coefficients of variation are 4.4% and 8.9% for LNG RIAs and 6.9% and 11% for EE RIAs, respectively.
Additionally, since sex hormone binding globulin (SHBG) binds LNG and could potentially lower the amount of free LNG, SHBG levels were assayed in serum on Cycle 1, Day 21 and Cycle 1, Day 28. SHBG was quantified by a solid-phase, two-site chemiluminescent immunoassay using the Immulite Analyzer (Siemens Medical Solutions Diagnostics, Los Angeles, CA). The solid phase is a polystyrene bead with a monoclonal antibody specific for SHBG. The intra-assay CVs range from 4.1% to 7.7% and the inter-assay CVs range from 5.8% to 11%.
2.2. Gonadotropins and ovarian hormones: timing of samples and assay characteristics (see Figures 1 and 5)
Fig. 5.
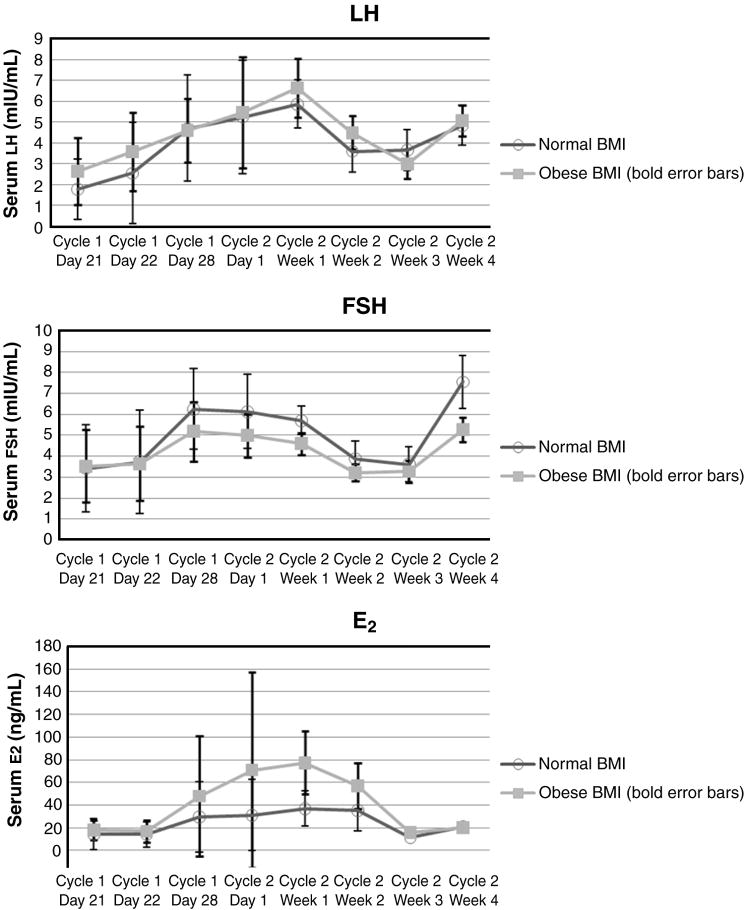
Mean LH, FSH, and estradiol (E2) levels
Gonadotropin pulsatility (FSH, LH) data were obtained from serum samples collected every 15 min during the first 8 h of Cycle 1, day 28 (last day of the hormone-free interval for Cycle 1) and Cycle 2, Day 1 (first active treatment day of Cycle 2). In addition, blood samples were drawn at 0 (0900 AM), 4, and 8 h daily during both 48-h stays and then twice per week during Cycle 2 for steroid hormone [estradiol (E2) and progesterone (P)] analyses.
FSH, LH, and steroid hormone assays were performed by the OCTRI laboratory. FSH, LH and P were measured using the automated Immulite chemiluminescent assay system (Diagnostic Products Corporation, Los Angeles, CA 90045). Assay sensitivity of both LH and FSH assays is 0.1 mIU/mL while the assay sensitivity of the progesterone assay is 0.1 ng/mL. Average assay precision as provided by the manufacturer is as follows: LH intra-assay CV = 5.7, LH interassay CV = 10.0, FSH intra-assay CV = 6.4, FSH interassay CV = 7.5, progesterone intra-assay CV = 6.3, progesterone interassay CV = 8.1. E2 was measured using an ultra-sensitive competitive binding radioimmunoassay (Diagnostic Systems Laboratories, Webster, TX, 77598). The theoretical assay sensitivity is 2.2 pg/mL. The average intra-assay CV is 7.5% and the average interassay CV is 9.4%.
Inhibin B, a marker of follicular response to FSH, was measured in serum samples from Cycle 1, Day 21 (baseline) and then collected at time intervals most likely to capture follicular activity [Day 28 and once during the first week of Cycle 2 (Day 5,6, or 7)]. Inhibin B was measured by ELISA using an enzymatically amplified two-site, two-step, sandwich-type ELISA (Diagnostic Systems Laboratories, Webster, TX). The intra-assay CVs range from 3.5% to 5.6%, and the interassay CVs range from 6.2% to 7.6%.
2.3. Pharmacokinetic and pulsatile parameter analysis
2.3.1. Pharmacokinetics
LNG and EE pharmacokinetic data from the first and second inpatient stays were analyzed separately by noncompartmental methods using WinNonLin (Pharsight, Mountain View, CA; v 5.2). Maximum serum LNG and EE concentrations (Cmax) and time to maximum concentration (Tmax) were observed values. Area under the curve (AUC) was calculated from time zero to 48 h (AUC0-t) using the linear trapezoidal rule and then extrapolated to infinity (AUC0–∞) which provides a more accurate calculation of drug clearance [11]. Drug half-life (t1/2), oral clearance (CL), and volume of distribution (VD) were generated using standard pharmacokinetic calculations (t1/2= 0.693/λz, where λz is the terminal elimination rate constant; CL= dose/AUC0–∞; VD= CL//λz). One normal BMI subject exhibited out of range values for clearance; thus, she was excluded from the pharmacokinetic analyses.
2.3.2. LH pulsatility
The deconvolution method was used to analyze the pulsatile characteristics of each LH series using analytic software provided by the University of Virginia’s Center for Biological Timing (weblink: http://mljohnson.pharm.virginia.edu/home.html) [12]. This estimation algorithm resulted in estimates of the number of LH pulses, half-life (t1/2), average pulse mass, total hormone secreted, and inter-pulse interval. Missing data were minimal with the exception of one obese subject who was missing 8 points (2 h) at the start of the second day of observation (Cycle 2, Day 1) due to a nonfunctional I.V. site. This subjects’ series was truncated for analysis and the number of pulses extrapolated to the 8-h time period of observation. All other missing data points were linearly interpolated prior to the deconvolution analysis.
2.4. Comparisons of group and day differences
Differences between normal and obese BMI group demographic and obesity biomarker measures (weight, height, body composition measurements by air displacement plethysmorgraphy, and waist-to-hip ratios) were assessed using a two-sample t-test (or chi-squared for race/ethnicity). In addition, inhibin levels were compared between BMI groups using a two-sample t-test and SHGB levels were compared between BMI groups using a two-sample t-test and between days using a paired t-test. Repeated measures analysis of variance (RMANOVA) was used to assess whether changes between Cycle 1, Day 28 and Cycle 2, Day 1 differed between the obese and normal BMI groups on any of the pharmacokinetic or pulsatile parameters. To further understand differences, pair-wise comparisons were performed between groups on Cycle 1, Day 28 and Cycle 1, Day 2 using a two-sample t-test and within groups (comparing Cycle 1, Day 28 and Cycle 2, Day 1 comparisons) using paired t-tests. Mean values were generated for LH, FSH, FSH/LH ratio, E2 and P on Cycle 1, Days 21, 22, 28 and Cycle 2, Day 1. The average values were compared between days within each subject using a paired t-test and between groups for each day using a two-sample t-test. Additionally, the proportion of subjects with an E2 level ≥75 pg/mL and/or a P level ≥3 ng/mL were compared to the proportion of women with E2 levels <75 pg/mL and/or progesterone levels <3 ng/mL using Fisher’s exact test.
3. Results
Thirty-six subjects were screened for the study with 20 subjects (10 obese, 10 normal BMI) meeting eligibility criteria and completing the study (1 subject lost to follow-up prior to luteal phase P, 9 subjects with luteal phase P < 3 ng/mL, 1 subject with uncontrolled hypertension, 1 subject pregnant, 1 subject discontinued secondary to undesired OC side effects, 1 subject withdrawn from study due to OC noncompliance, 2 subjects unable to complete inpatient visits).
3.1. Demographics
There were no significant demographic differences between groups except mean BMI, waist/hip ratio, and percent body fat were significantly greater (p < 0.05) in the obese compared to the normal BMI group (see Table 1).
Table 1.
Demographics
| Normal BMI (n = 10) | Obese BMI (n = 10) | |
|---|---|---|
| Age, years | 29.2 (SD 4.9) | 29.8 (SD 7.1) |
|
| ||
| Race | ||
| Non-Hispanic, Caucasian | 8 | 9 |
| Other | 2 | 1 |
|
| ||
| BMI | 21.9 kg/m2 (SD 1.6) | 37.3 kg/m2 (SD 6.0)* |
|
| ||
| % body fat | 27.6% (SD 7.2) | 50.3% (SD 3.5)* |
|
| ||
| Waist/hip ratio | 0.83 (SD 0.06) | 0.91 (SD 0.09)* |
p < 0.05.
3.2. Pharmacokinetics
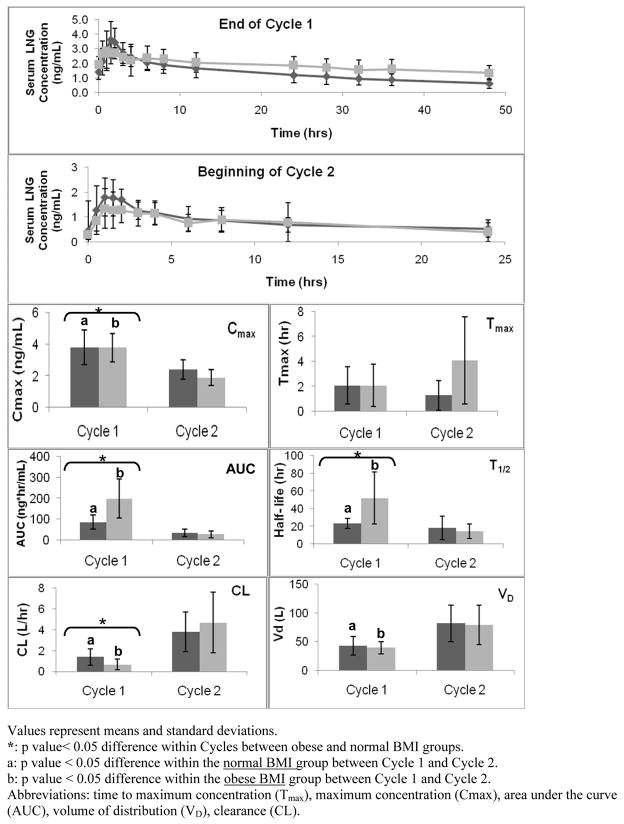
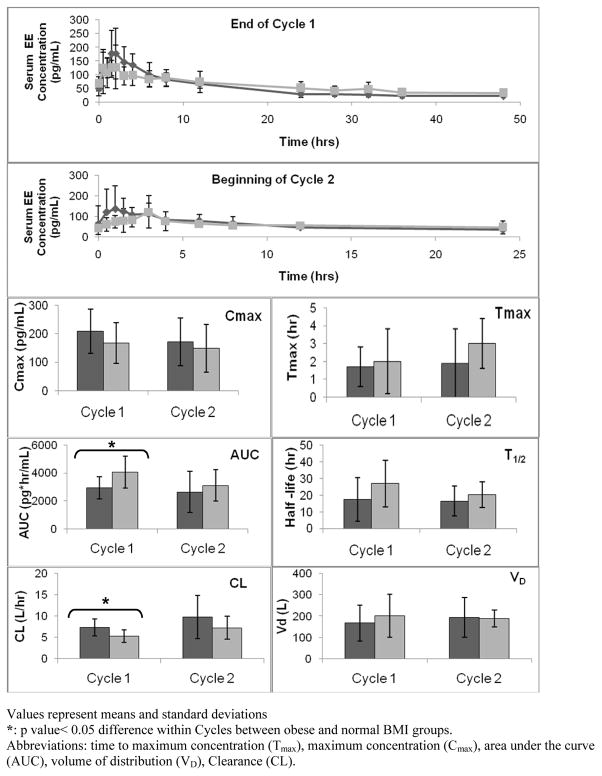
Fig. 2 and 3 depict the LNG and EE pharmacokinetic parameters. The top two panels of each figure display serum concentration versus time curves at two different time intervals; the end of Cycle 1 (after 21 days of active hormone use but before the hormone-free interval) and at the beginning of Cycle 2 (after a 7-day hormone-free interval and re-initiating active hormone use). The box plots below in Fig. 2 and 3 represent each of the individual pharmacokinetic parameter values (i.e., T1/2, Tmax, Cmax, AUC, Vd, and CL) for both BMI groups at the two time points studied.
Fig. 2.
LNG Pharmacokinetic Parameters (Dark grey = normal BMI, light grey = obese BMI)
Values represent means and standard deviations.
*: p value< 0.05 difference within Cycles between obese and normal BMI groups.
a: p value < 0.05 difference within the normal BMI group between Cycle 1 and Cycle 2.
b: p value < 0.05 difference within the obese BMI group between Cycle 1 and Cycle 2.
Abbreviations: time to maximum concentration (Tmax), maximum concentration (Cmax), area under the curve (AUC), volume of distribution (VD), clearance (CL).
Fig. 3.
EE Pharmacokinetic parameters (Dark grey = normal BMI, light grey = obese BMI)
Values represent mseans and standard deviations
*: p value< 0.05 difference within Cycles between obese and normal BMI groups.
Abbreviations: time to maximum concentration (Tmax), maximum concentration (Cmax), area under the curve (AUC), volume of distribution (VD), Clearance (CL).
The Cmax, Tmax, and AUC were directly derived for the serum concentration versus time curves (Fig. 2 and 3). No differences were found in mean Cmax and mean Tmax for LNG or EE between BMI groups at either time point. However, a significant difference in mean AUC for both EE and LNG existed between BMI groups at the end of Cycle 1 (after 21 days of active hormonal exposure) with a larger AUC in the obese group as compared to the normal BMI group (p < 0.05).
With a larger mean AUC, mean T1/2 was significantly longer (LNG p < 0.05) and CL was significantly less in the obese group (LNG and EE p < 0.05). This also correlates with a lower but not statistically significant maximum LNG concentration on Cycle 2, Day 1 [1.9 ng/mL (SD 0.5) versus 2.5 ng/mL (SD 0.7)]. There were no differences in volume of distribution (Vd) for either EE or LNG between groups at either time point.
SHBG levels were no different between groups, but significantly different between days (p < 0.05) with lower levels found following the 7-day hormone-free interval [mean 49 nmol/L (SD 16)] and higher levels following 21 days of OC use [mean 70 nmol/L (SD 23)].
3.3. Gonadotropins and ovarian hormones
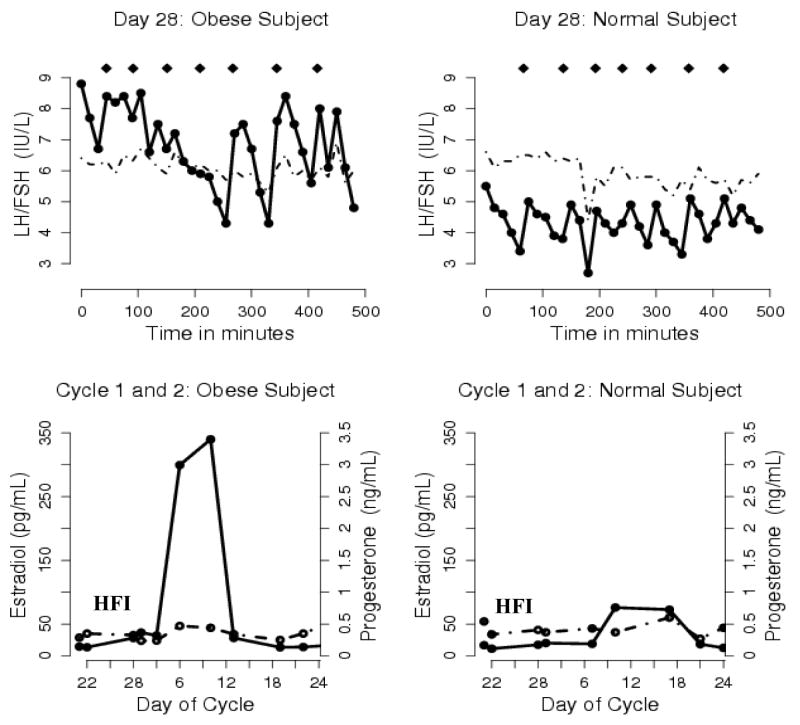
Pulsatile LH secretion was present in both groups at the end of the 7-day hormone-free interval [average number of pulses: normal BMI 5 (SD 2), obese BMI 6 (SD 1); average inter-pulse interval: normal BMI 102 min (SD 54), obese BMI 82 (SD 26)]. Fig. 4 depicts the gonadotropin pulsatility pattern and ovarian hormones of one typical obese and normal BMI study subject. There were no significant differences in mean LH pulse parameters (baseline, half-life, average pulse mass, pulse number, and inter-pulse interval) for the two groups for each day measured at the end of the hormone-free interval (Cycle 1, Day 28) and the beginning of Cycle 2 (Cycle 2, Day 1).
Fig. 4. Gonadotropin pulsatility on the last day of the 7-day hormone-free interval (Top Panel) and ovarian hormone levels during the hormone-free interval in Cycle 1 and during the first week of Cycle 2 (bottom panel) in one typical obese subject who developed a dominant follicle and one typical normal BMI subject.
HFI: hormone-free interval; Diamonds (◆) mark LH pulses; Solid line: LH and E2; Dashed line: FSH and P.
Consistent with the presence of pulsatility activity at the end of the 7-day hormone-free interval, mean FSH and mean LH levels increased in both groups after cessation of OC use from the beginning to the end of the 7-day hormone-free interval (Fig. 5.). Although no significant statistical differences were found, several trends emerged. Both BMI groups had similar mean levels of FSH at the end of Cycle 1 (after 21 days of active hormone use) but the normal BMI group had marginally higher mean FSH levels at the end of the 7-day hormone-free interval (Cycle 1, Day 28, p = 0.1) and the beginning of Cycle 2 (Cycle 2, Day 1, p = 0.1) than the obese group. E2 levels were also similar in both groups at the end of Cycle 1 but then rise rapidly with the start of the 7-day hormone-free interval in the obese group suggestive of greater follicular activity (Fig. 5.); although no statistically significant differences were found. Consistent with ovarian activity, inhibin B levels followed the same pattern but with small sample sizes no differences were found between BMI groups or those with high versus low E2 levels. There were no differences in mean P levels between groups with OC cessation until the end of the hormone-free interval.
Obese women continued to have higher levels of ovarian hormone production with reinitiation of active hormone use in Cycle 2. Six obese versus three normal BMI subjects had at least two consecutive elevated E2 levels (>75 pg/mL) during outpatient sampling in Cycle 2. Two of the six obese subjects and one of the three normal BMI subjects had at least two consecutive P levels ≥3 ng/mL during the first week of Cycle 2 consistent with ovulation or luteinization of the follicle.
4. Discussion
While some (but not all) epidemiologic studies suggest that obesity reduces the efficacy of OCs, a mechanism for this effect has not been elucidated [2,3]. The current study was designed to determine whether obesity alters the pharmacokinetics of OCs and results in inadequate HPO axis suppression and ovulation. Our results show significant differences in LNG half-life, clearance and time to reach steady-state between obese and normal BMI women. Consistent with these changes, more obese women demonstrated hormonal changes associated with recruitment and maturation of a dominant follicle, and even ovulation but the sample size was too small to achieve statistical significance.
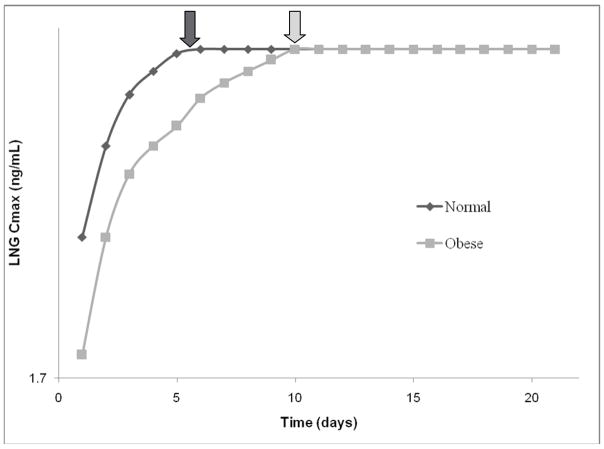
It is widely assumed that hormonal contraceptive failure in obese subjects is due to lower plasma concentrations of contraceptive steroid hormones arising out of greater drug distribution in the fat mass. Unexpectedly, our results demonstrated no differences in LNG or EE volume of distribution between obese and normal BMI subjects. Instead, we found that obesity adversely affected the time to reach LNG steady-state due to a larger mean AUC. The LNG half-life (T1/2) in obese subjects was twice that of normal BMI subjects, and therefore the time to reach steady state (approximately 5–7 * T1/2) was doubled (obese BMI 10 days versus normal BMI 5 days; p < 0.05; Fig 6). This prolonged time suggests that obese women using OCs may require a longer time interval following resumption of active pills to experience inhibitory drug concentrations, and that this creates a “window of opportunity” for follicular recruitment, ovulation, and even pregnancy. The length of this “window” may vary significantly, as one obese subject (BMI = 37) had a calculated time to reach steady-state of greater than 20 days and may have never been adequately suppressed for the entire OC cycle.
Fig. 6.
Calculated time to reach LNG steady-state (steady-state = T1/2 × 5) concentrations based on the serum sample series from Cycle 2, Day 1 (the first day of restarting active oral contraceptive pills after a 7-day hormone-free interval).
Little is known regarding drug pharmacokinetics in the obese population. Obesity reportedly decreases CYP3A activity in animal studies [13,14]. However, data in humans are conflicting [14]. Since the major route of EE metabolism is through the cytochrome p450 enzyme system, we expected and found a decrease in the total clearance of EE in obese subjects. Also, EE clearance values in both BMI groups increased from the beginning to end of the hormone-free interval. In other words, the 7-day hormone-free or EE exposure-free interval normalized EE clearance.
With EE inhibiting the cytochrome p450 enzyme system in the liver and increasing binding proteins (SHBG) during chronic EE exposure, we expected and found a decrease in the total clearance of LNG and an increase in LNG volume of distribution in both BMI groups from the beginning versus the end of the hormone-free interval [15,16,17,19]. However, the obese group had a significantly lower clearance than the normal BMI group at the beginning of the hormone-free interval even with similar levels of binding proteins (SHBG). This suggests that 21 days of EE exposure affects the metabolism/clearance of LNG via unidentified metabolic pathways.
The corresponding gonadotropin and ovarian hormone data support conclusions from the pharmacokinetic observations that differences exist between OC users of differing BMI. Evidence of HPO reactivation was present in both groups, however the number of pulses and inter-pulse interval at the end of the hormone-free interval in the obese BMI group were more consistent with follicular phase activity [8]. Although not statistically significant, physiologically, even small differences in gonadotropin levels, like we found, are important with only a 10% rise in FSH triggering follicle growth and a difference in 1 pulse indicating follicular rather than luteal phase activity [8]. Consistent with follicular development, mean FSH levels were lower in the obese group as E2 levels began to rise. In addition, more obese than normal BMI women demonstrated E2 and P levels consistent with follicular development and ovulation during the first 7–10 days of Cycle 2. Overall, the differences observed are of potential clinical significance.
Collectively, these data provide evidence that biologic differences exist between OC users of differing BMIs and that this may affect OC efficacy. However, there are several limitations to this study. By limiting the BMI categories to normal and obese (excluding the overweight category), we hoped to maximize the possible effect of size in this study. Several epidemiologic studies have shown that even women in the overweight BMI (25–30 kg/m2) category may be at increased risk for contraceptive failure [2,3]. Perhaps the risk of failure increases linearly as BMI increases, although a sub-analysis of several of our heaviest subjects (BMI ≥ 40 kg/m2) revealed no pharmacokinetic differences from the other obese subjects. In addition, the choice of an OC with the lowest EE component (20 mcg) was deliberately made to maximize the ability to detect a mechanism of action for OC failure; this choice also correlated well with current clinical practice. Although no differences in thrombosis risk have been found between an OC with a 20 mcg versus 30 mcg EE component, it has been observed that many clinicians preferentially prescribe these very-low estrogen dose pills to obese women in an effort to decrease their risk of venous thrombosis. Additionally, our pharmacokinetic data were found to have wide intra-subject variability. Intra-subject variability is due to inherent variations among subjects and within analytic assays. However, the variability of our EE and LNG analytical assays was low (10%) and our intrasubject variability (30–60%) was consistent with findings of published studies [19]. Our sampling length of 8 h at 15 min intervals only performed at the end of the 7-day hormone-free interval may have impaired our ability to determine a statistical difference in LH pulse parameters between groups although this is the first report on gonadotropin pulsatility in obese OC users. As prior studies have shown some escape of the HPO axis from OC inhibition at the end of the 7-day hormone-free interval in normal BMI women, we chose this time point to monitor for HPO axis escape in obese women [20,21]. Finally, our study provides only indirect measures of follicle development and ovulation and does not address all potential contraceptive mechanisms or fertility.
Although this study gives credence to the hypothesis that BMI affects OC pharmacokinetics resulting in greater follicle development and possible ovulation, essential factors in OC efficacy, additional studies are needed before we recommend a change in clinical practice in regard to use of oral contraception in obese women.
Acknowledgments
The authors would like to thank the Women’s Health Research Unit, the Department of Obstetrics & Gynecology, and the Oregon Clinical & Translational Research Institute at Oregon Health & Science University
Financial Support: HD 01243-03 Women’s Reproductive Health Research Fellow (NICHD K-12), PHS Grant 5 M01 RR000334, and 1 R03 HD 053611-01.
Footnotes
Publisher's Disclaimer: This is a PDF file of an unedited manuscript that has been accepted for publication. As a service to our customers we are providing this early version of the manuscript. The manuscript will undergo copyediting, typesetting, and review of the resulting proof before it is published in its final citable form. Please note that during the production process errors may be discovered which could affect the content, and all legal disclaimers that apply to the journal pertain.
References
- 1.Finer LB, Henshaw SK. Disparities in rates of unintended pregnancy in the United States, 1994 and 2001. Perspect Sex Reprod Health. 2006;38:90–6. doi: 10.1363/psrh.38.090.06. [DOI] [PubMed] [Google Scholar]
- 2.Holt VL, Cushing-Haugen KL, Darling JR. Body weight and risk of oral contraceptive failure. Obstet Gynecol. 2002;99:820–7. doi: 10.1016/s0029-7844(02)01939-7. [DOI] [PubMed] [Google Scholar]
- 3.Hol VL, Scholes D, Wickland KG, Cushing-Haugen KL, Darling JR. Body mass index, weight, and oral contraceptive failure risk. Obstet Gynecol. 2005;105:46–52. doi: 10.1097/01.AOG.0000149155.11912.52. [DOI] [PubMed] [Google Scholar]
- 4.Brunner LR, Hogue CJ. The role of body weight in oral contraceptive failure: results from the 1995 National Survey of Family Growth. Ann Epidemiol. 2005;15:492–9. doi: 10.1016/j.annepidem.2004.10.009. [DOI] [PubMed] [Google Scholar]
- 5.Brunner Huber LR, Toth JL. Obesity and oral contraceptive failure: findings from the 2002 National Survey of Family Growth. Am J of Epidemiol. 2007;166:1306–11. doi: 10.1093/aje/kwm221. [DOI] [PubMed] [Google Scholar]
- 6.Kaneshiro B, Edelman A, Carlson N, Nichols M, Jensen JT. The relationship between body mass index and unintended pregnancy results from the 2002 National Survey of Family Growth. Contraception. 2008;77:234–8. doi: 10.1016/j.contraception.2007.10.012. [DOI] [PubMed] [Google Scholar]
- 7.Blouin RA, Warren GW. Pharmacokinetic considerations in obesity. J Pharm Sci. 1999;88:1–7. doi: 10.1021/js980173a. [DOI] [PubMed] [Google Scholar]
- 8.Speroff L, Glass RH, Kase NG. Clinical Gynecologic Endocrinology and Infertility. 6. Baltimore, Maryland: Lippencott Williams & Wilkins; 1999. [Google Scholar]
- 9.Price TM, Dupuis RE, Carr BR, Stanczyk FZ, Lobo RA, Droegemueller W. Single and multiple dose pharmacokinetics of a low dose oral contraceptive in women with chronic renal failure undergoing peritoneal dialysis. Am J Obstet Gynecol. 1993;168:1400–6. doi: 10.1016/s0002-9378(11)90772-8. [DOI] [PubMed] [Google Scholar]
- 10.Stanczyk FZ, Hiroi M, Goebelsmann U, Brenner PF, Lumkin ME, Mishell DR., Jr Radioimmunoassay of serum d-Norgestrel in women following oral and intravaginal administration. Contraception. 1975;12:279. doi: 10.1016/0010-7824(75)90088-8. [DOI] [PubMed] [Google Scholar]
- 11.Rowland M, Tozer TN. Clinical Pharmacokinetics: Concepts and Applications. Philadelphia, PA: Lea & Febiger; 1980. [Google Scholar]
- 12.Veldhuis JD, Johnson ML. Deconvolution analysis of hormone data. Methods Enzymol. 1992;210:539–75. doi: 10.1016/0076-6879(92)10028-c. [DOI] [PubMed] [Google Scholar]
- 13.Irizar A, Barnett CR, Flatt PR, Ioannides C. Defective expression of cytochrome P450 proteins in the liver of the genetically obese Zucker rat. Eur J Pharmacol. 1995;293:385–93. doi: 10.1016/0926-6917(95)90059-4. [DOI] [PubMed] [Google Scholar]
- 14.Yoshinari K, Takagi S, Yoshimasa T, Sugatani J, Miwa M. Hepatic CYP3A expression is attenuated in obese mice fed a high-fat diet. Pharm Res. 2006;23:1188–200. doi: 10.1007/s11095-006-0071-6. [DOI] [PubMed] [Google Scholar]
- 15.Fotherby K. Levonorgestrel. Clinical pharmacokinetics Clin Pharmacokinet. 1995;28:203–15. doi: 10.2165/00003088-199528030-00003. [DOI] [PubMed] [Google Scholar]
- 16.Sambol NC, Harper CC, Kim L, Liu CY, Darney P, Raine TR. Pharmacokinetics of single-dose levonorgestrel in adolescents. Contraception. 2006;74:104–9. doi: 10.1016/j.contraception.2006.01.011. [DOI] [PubMed] [Google Scholar]
- 17.Wang B, Sanchez RI, Franklin RB, Evans DC, Huskey SE. The involvement of CYP3A4 and CYP2C9 in the metabolism of 17 alpha-ethinylestradiol. Drug Metab Dispos. 2004;32:1209–12. doi: 10.1124/dmd.104.000182. [DOI] [PubMed] [Google Scholar]
- 18.Fotherby K. Pharmacokinetics of gestagens: some problems. Am J Obstet Gynecol. 1990;163:323–8. doi: 10.1016/0002-9378(90)90576-s. [DOI] [PubMed] [Google Scholar]
- 19.Goldzieher J, Stanczyk FZ. Oral contraceptives and individual variability of circulating levels of ethinyl estradiol and progestins. Contraception. 2008;78:4–9. doi: 10.1016/j.contraception.2008.02.020. [DOI] [PubMed] [Google Scholar]
- 20.van Heusden AM, Fauser BCJM. Activity of the pituitary-ovarian axis in the pill-free interval during use of low-dose combined oral contraceptives. Contraception. 1999;59:237–43. doi: 10.1016/s0010-7824(99)00025-6. [DOI] [PubMed] [Google Scholar]
- 21.Cohen BL, Katz M. Pituitary and ovarian function in women receiving hormonal contraception. Contraception. 1979;20:475–87. doi: 10.1016/0010-7824(79)90053-2. [DOI] [PubMed] [Google Scholar]


