

SUMMARY
The mutagenic and cytotoxic effects of many alkylating agents are reduced by O6-alkylguanine-DNA alkyltransferase (AGT). In humans this protein protects the integrity of the genome, but also contributes to the resistance of tumors to DNA-alkylating chemotherapeutic agents. Here we describe and test models for cooperative multi-protein complexes of AGT with single-stranded and duplex DNAs that are based on in vitro binding data and the crystal structure of a 1:1 AGT-DNA complex. These models predict that cooperative assemblies contain a 3-start helical array of proteins with dominant protein-protein interactions between the amino-terminal face of protein n and the carboxy-terminal face of protein n + 3, and they predict that binding duplex DNA does not require large changes in B-form DNA geometry. Experimental tests using protein crosslinking analyzed by mass spectrometry, electrophoretic and analytical ultracentrifugation binding assays and topological analyses with closed circular DNA show that the properties of multiprotein AGT-DNA complexes are consistent with these predictions.
Keywords: O6-alkylguanine-DNA alkyltransferase, methylguanine methyltransferase, DNA repair, binding cooperativity, protein contacts
INTRODUCTION
The O6-alkylguanine-DNA alkyltransferase1 (AGT, also called O6-methylguanine DNA methyltransferase, MGMT) repairs O6-alkylguanine and O4-alkylthymine adducts that occur in DNA that has been exposed to alkylating agents1; 2; 3. Both adducts are mutagenic and carcinogenic1; 4; 5 and O6-alkylguanine adducts are also cytotoxic6. AGT also protects tumor cells against chemotherapeutic drugs that methylate or chloroethylate DNA6; 7, and clinical trials are underway to determine whether AGT-inhibitors can increase the efficacy of DNA-alkylating drugs8; 9. This relevance to cancer etiology and chemotherapy has stimulated research on the structure of AGT10; 11; 12, its synthesis and degradation13; 14 and its mechanisms of DNA repair15; 16, but important gaps remain in our understanding of how AGT interacts with DNA and with proteins bound to DNA.
Human AGT is a monomeric protein (207 amino acids, Mr = 21,519) that is expressed constitutively in normal cells3; 7; 17. It binds single-stranded and duplex DNAs with little sequence- or lesion-specificity, modest affinity and significant cooperativity18,19; 20. In the repair reaction, a single alkyl group is transferred from the O6-position of guanine or O4-position of thymine to an active-site cysteine (C145 in the human protein). This returns the DNA base to its unmodified state, but the alkylated form of the “enzyme” is a dead-end state that is rapidly degraded21; 22. Because repair by AGT is stoichiometric, the number of O6-alkylguanine and O4-alkylthymine adducts that can be repaired at one time depends on the cellular concentration of the un-alkylated form of AGT 2; 3 and on its distribution between alkylated and competing undamaged sites throughout the genome. This fact motivates our study of AGT-DNA interactions.
AGT repairs both single-stranded and duplex DNAs23; 24; 25 and recent data indicate that the equilibrium constants, cooperativity parameters and limiting binding densities are remarkably similar for complexes formed with single- and double-stranded templates18; 26. The simplest models that account for these results are ones in which the protein-protein contacts are similar in complexes formed with single- and double-stranded DNAs and in which the helical twist of double-stranded DNA in complex with AGT is similar to that of free DNA. Here we describe and test structural models based on these properties. These models predict the identities of residues in the protein-protein interface, the conformation of DNAs in the complexes and the numbers of ionic contacts formed between AGT and substrate DNAs.
RESULTS
Models of cooperative AGT-DNA complexes
An AGT monomer occupies a DNA surface that spans ~8 bp11 but the occluded binding site sizes in cooperative complexes are significantly smaller (4.03 ± 0.18 nt/single stranded site and 4.00 ± 0.13 bp/double stranded site18; 26). These values suggest that the topologies of complexes on single stranded and duplex DNAs are likely to be similar, with overlapping binding sites starting every four base-pairs (or nucleotides) along the DNA contour. This notion is supported by similar values for binding cooperativity on single stranded and duplex templates18; 26, which are most simply explained by models that bring the same protein surfaces into contact. Finally, the small changes in the CD spectrum of duplex DNA that accompany AGT binding27; 28 suggest that the conformation of duplex DNA in complexes is unlikely to differ much from that of the free DNA. These features allow us to construct models of cooperative complexes formed with single- and double stranded DNAs that require few assumptions and predict a wide array of structural and functional properties that are available to experimental test.
The repeating unit of assembly that forms the basis of our models is the structure of AGT plus the four central base-pairs, as represented in the crystal structure of Daniels et al.11, available in PDB file 1T38. A similar model can be built using the crystal structure of Duguid et al.12 as the source of the repeating unit (result not shown). Both of these structures feature single molecules of AGT bound to isolated DNA sites. To model the tight-packed cooperative complex, repeating units were stacked so that the neighboring base-pairs of adjacent units were related by B-form DNA helical parameters (separation =3.4 Å, twist = 34.6 degrees/bp). The result is a 3-start helical array of proteins with a right-handed rotation of 138 degrees/protein and with proteins separated by 4 bp along the DNA contour (Figs. 1a and 1b). The DNA occupies a channel of positive electrostatic potential in the center of the protein assembly (Fig. 1c). In this assembly, there is little contact between the nth protein and proteins n+1 and n+2, but the N-terminal surface of the nth protein is positioned to contact the C-terminal surface of protein n+3. Although this model was constructed without conformational adjustment of either protein or DNA, there is almost no steric clash between adjacent proteins and all spatial overlap is restricted to side chain atoms. Using a 1.4Å probe, we estimate that the n-to-n+3 protein-protein interface occludes ~1100Å2 that are solvent exposed in the free monomer. This value is about 70% of the area occluded in a single protein-DNA interface (~1600Å2). The comparatively large protein-protein interface suggests that entropy gain accompanying water release from protein surfaces may play an important role in stabilizing the cooperative complex. In addition, the n-to-n+3 protein interface is rich in charged residues, some of which may form ion-pairs to stabilize the complex. Shown in Fig. 1d is a view of the predicted interface demonstrating the structural and charge complementarity of adjacent proteins; charged residues that may form interfacial ion-pairs are listed in Table II. This view also emphasizes that the protein-protein interface is dominated by loops that do not contain canonical helix or β-sheet secondary structures; it is possible that these loops provide flexibility at the interface. A flexible interface may allow assemblies to accommodate changes in protein juxtaposition caused by small changes in DNA twist or curvature.
Figure 1.
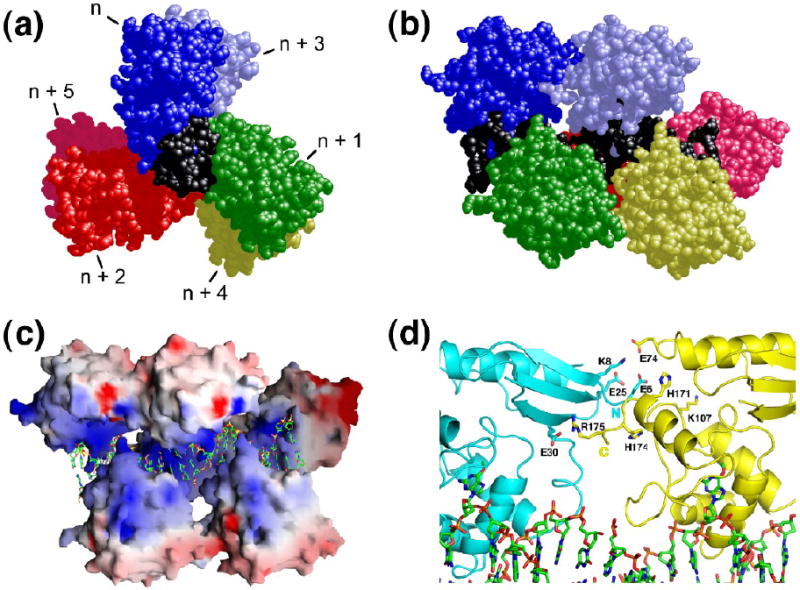
Models of AGT-DNA complexes with double-stranded DNA. Panels a and b: Model of the cooperative complex formed with duplex DNA. The repeating unit of this model is one molecule of AGT (colors) plus 4 base-pairs of DNA (black); the coordinates were derived from the crystal structure of Daniels et al.11. Repeating units were juxtaposed with preservation of B-DNA helical parameters (separation =3.4 Å, twist = 34.6 degrees) between base-pairs of adjacent units. The result is a 3-start helical array (panel a) with important contacts between proteins n and n + 3 (panel b). Electrostatic potentials calculated with for the protein array using the program GRASP are shown in panel c. Potentials ranged from -8kT (red) to +8kT (blue). In panel a, the C-terminal surfaces of proteins are shown. In panels b and c, the C-termini are oriented to the left. Panel d: Interface between proteins n (cyan) and n + 3 (yellow), view perpendicular to the DNA axis. Proteins are oriented with N-termini to the right; for clarity only charged side chains in the interface are shown. This view emphasizes surface and charge complementarities generated by the model without conformational adjustment of proteins or DNA.
Table II.
Predicted Juxtaposition of Ionic Groups in the Protein-Protein Interface*
| N-terminal surface of protein 1 | C-terminal surface of protein 4 |
|---|---|
| E30 | R175 |
| K8 | E74 |
| H85 | E172 |
| E6 | H174 |
| E6 | H171 |
Charged interfacial residues separated by ~3Å or less are listed.
In the model described above, all extrahelical DNA bases representing residues being sampled for repair are located on one DNA strand. This strand also makes the majority of ionic and uncharged contacts with each protein molecule. These features suggest that the complex with single-stranded DNA may resemble one that can be obtained by simply deleting the less-contacted strand from the duplex DNA model (Figs. 2a and b). The resulting model assumes that the protein conformation and protein-protein contacts are similar in complexes containing single-stranded and duplex DNAs. The similar site sizes and cooperativity values for binding single-and double-stranded DNAs, described above, are consistent with this idea.
Figure 2.

A model of AGT-DNA complexes containing single-stranded DNA. Panel a: view parallel to the DNA axis. The C-terminal faces of proteins are shown. Panel b: view perpendicular to the DNA axis. The C-termini of proteins are toward the left. The color scheme is the same as that used in Fig. 1. This model was built from the model containing duplex DNA (Fig. 1, panels a and b), retaining the DNA strand with extrahelical bases bound by the enzyme and deleting the complementary DNA strand. No conformational adjustment or energy minimization has been done.
Testable predictions
These models make detailed predictions that are amenable to experimental test. They predict that a surface on the N-terminal face of the protein, including residues 6-9; 25, 26, 29, 30, 32, 85-87 and 91, will be in contact with a corresponding surface on the C-terminal face of the protein, including residues 73, 74; 108, 109 and 171-176 (Fig. 3a). They also predict that a molecule of AGT protein will make 3 ionic contacts with double stranded DNA or 2 with single stranded DNA (Fig. 3b). Since counterion condensation in 1:1 salt solutions results in fractional charge neutralizations of 0.88 for duplex and 0.71 for single stranded DNAs29; 30, this leads to the expectation that binding will be accompanied by net release of ~2.6 cations from duplex DNA and ~1.4 cations from single-stranded templates1. Finally, these models predict that cooperative binding to duplex DNA takes place without a large deviation of the DNA from relaxed B-form helical parameters. Experiments designed to test these explicit predictions are described below.
Figure 3.

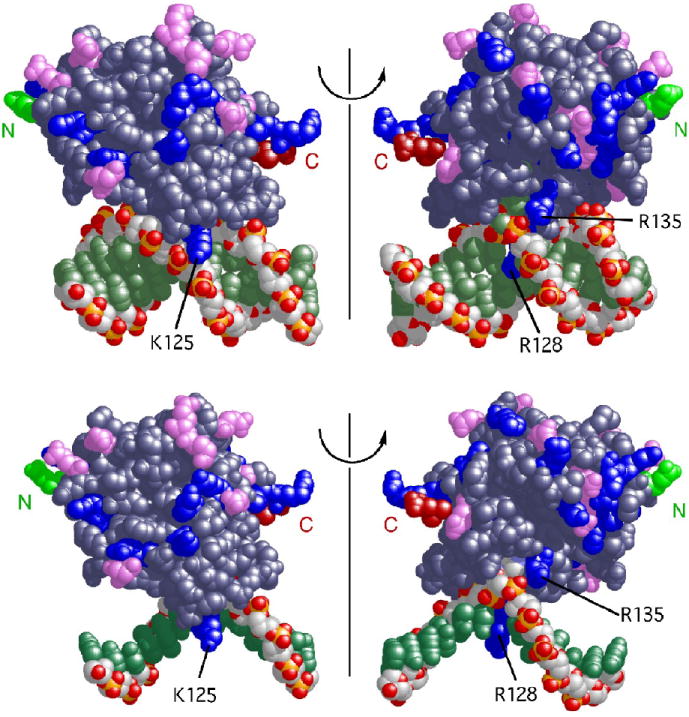
Interactions predicted by the structural model. Panel a: protein-protein contacts. This representation contains 4 protein molecules bound to 16 bp of duplex DNA. Proteins are oriented with N-terminal surfaces toward the right. Protein monomers colored blue and pink are in contact; contact residues on the N-terminal face (residues 6-9; 25, 26, 29, 30, 32, 85-87 and 91) are colored deep blue, contact residues on the C-terminal face (residues 73, 74, 108, 109 and 171-176) are colored red. A subset of these residues are indicated by number. The DNA is shown in black. Panel b: Structural models predict 3 ionic contacts with duplex DNA and 2 contacts with single stranded DNA. A single protein-DNA unit is shown. The model containing duplex DNA (top row) is the structure specified by PDB file 1T38. The model for the complex with single stranded DNA (bottom row) is isosteric with that for duplex DNA, except that the least-contacted DNA strand has been deleted. Two rotational orientations of each structure are shown. Basic protein residues are colored blue, acidic residues, violet; the amino-terminal residues in the structure are colored green and labeled N, the carboxy-terminal residues are colored red and labeled C. Residues R128 and R135 are positioned to contact both single stranded and duplex DNAs, while in the absence of allosteric adjustment, residue K125 is positioned to contact only duplex DNA.
Identification of residues in the protein-protein interface
For [AGT] ≤ 15μM, intermolecular crosslinking by formaldehyde is more efficient in the presence of DNA than in its absence (Fig. 4a). Similar results (not shown) were obtained with crosslinking reagents differing in mechanism and specificity, including dimethyl suberimidate31, sulfo-SANPAH32 and Tris (2,2’-Bipyridyl) ruthenium(II) chloride (Ru(II))33. It is significant that the dominant crosslinked species obtained with 16-nt DNA (16mer oligo A) is the dimer; our models predict that in this 4 protein/1 DNA complex, 2 protein molecules are in intimate n-to-n+3 contact and that other protein contacts that might lead to larger crosslinked species are minimal. Together, the observations that AGT molecules within the cooperative complex are more efficiently crosslinked than free AGT molecules and that DNA-dependent crosslinking is obtained with reagents of differing specificity argue that the increased crosslinking efficiency reflects the juxtaposition of protein surfaces and not simply a change in the reactivity of a single class of residues. This forms the basis of our strategy for mapping protein-protein contacts within the cooperative complex.
Figure 4.
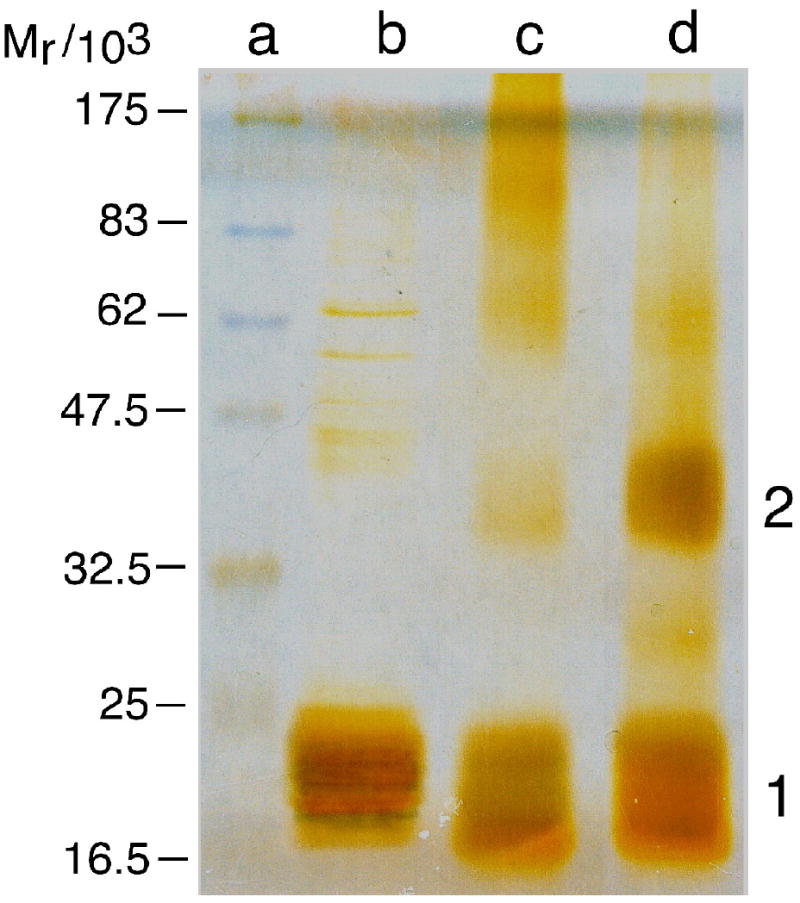

Crosslinking and mass spectroscopy analysis of AGT-DNA complexes. Panel a: Formaldehyde crosslinking of AGT-complexes detected by SDS-PAGE. Lane a, molecular weight standards (scale shown at left). Lane b, uncrosslinked AGT (15.8 μM). Lane c, AGT (15.8 μM) crosslinked in the absence of DNA for 120 min with formaldehyde (5 mM). Lane d, AGT (15.8 μM) plus 16mer DNA (15.8μM) crosslinked for 120 min with formaldehyde (5 mM). Samples (30 μL) were resolved in a 15% SDS-polyacrylamide gel49. Protein bands were detected by silver-staining50. Band assignments 1, monomer; 2, dimer based on apparent molecular weight. Panel b: Representative MALDI-mass spectra of trypsin fragments obtained from crosslinked AGT monomer (upper panel) and dimer (lower panel). Protein digestion and mass spectroscopy conditions were as described in Methods.
AGT complexes formed on 16mer DNA (oligo A) were crosslinked with either Ru(II) or formaldehyde and proteolytic fragments derived from monomeric and dimeric forms of AGT were characterized by MALDI-mass spectrometry. Representative monomer and dimer spectra for the range 1500 ≤ m/z ≤ 2500 are shown in Fig. 4b. Some mass peaks present in the monomer are shifted to higher mass values in the dimeric protein. Small mass shifts may reflect the formation of adducts with formaldehyde, or in the case of Ru(II) reactions, with buffer components; larger shifts are more consistent with the crosslinking of protein fragments. Fifteen assignable fragments that undergo large (>200 Da) mass shifts are listed in Supplementary Table I. Assignments were attempted for mass peaks that were substantially reduced in amplitude (reduction > 80%) on crosslinking. As a result, this list does not contain every fragment that can become crosslinked. On the other hand, the sequences of these efficiently-crosslinked fragments overlap, indicating that different combinations of crosslinking reagents and proteases are sampling the same ensemble of interactions. Consistent with this interpretation, the fragments map to two distinct zones on the surface of the monomeric AGT-DNA structure (Supplementary Fig. 1). Each of these zones contains one of the surfaces predicted by our models to form the protein-protein interface in the cooperative complex.
Peaks in the mass spectrum that appear as a result of crosslinking offer the potential to identify pairs of peptide segments brought into juxtaposition on complex formation. Listed in Table III are the most abundant of these peaks detected for the cooperative AGT-DNA complex. These candidates may represent intermolecular crosslinks or intramolecular crosslinks made possible by conformational change accompanying binding. However, crosslinks between polypeptides that are well-separated in the protein structure are not easily explained by the small conformational transitions that distinguish free and DNA-bound AGT monomers11; our interpretation of these crosslinks is that they identify polypeptides located near or within protein-protein interfaces in the cooperative assembly. Representative pairs of polypeptides that meet this criterion are shown in Figure 5. The surfaces represented by assigned crosslinks are concentrated near the N-and C-termini of AGT, within the candidate regions mapped on the basis of crosslink-dependent shift of fragment mass (discussed above). In addition, all pairs of non-adjacent crosslinked polypeptides have one member that is located close to the protein’s N-terminus in the protein-DNA structure while the other is located near the C-terminus. This pairing is consistent with the head-to-tail arrangement of proteins envisioned in the models shown in Figures 1 and 2.
Table III.
Assigned Crosslinks
| Assignment |
||||||
|---|---|---|---|---|---|---|
| Crosslinking Reagenta | Proteolytc Enzymeb | Mass Observed | Mass Predicted.c | Residue Numbers | Peptides adjacent in monomerd | Peptides adjacent across protein-protein interface in modeld |
| F | C | 1412 | 1408.5 | 61-65 and 170-176 | ||
| F | C | 1430 | 1427.5 | 66-69 and 159-167 | ||
| F | C | 1786 | 1785 | 60-66 and 169-176 | ||
| F | C | 1786 | 1788 | 1-7 and 163-169 | + | |
| F | C | 2272 | 2276 | 8-19 and 159-167 | + | |
| F | C | 2428 | 2425 | 54-60 and 70-84 | + | |
| F | C | 2877 | 2874 | 17-28 and 104-117 | + | |
| F | C | 3155 | 3152 | 18-42 and 61-66 | + | |
| F | C+T | 1673 | 1672 | 1-7 and 170-176 | + | |
| F | C+T | 2001 | 1993 | 1-7 and 105-114 | + | |
| F | C+T | 2177 | 2180 | 10-18 and 166-175 | + | |
| F | C+T | 2246 | 2243 | 8-19 and 167-176 | + | |
| F | C+T | 2427 | 2431 | 22-34 and 159-167 | + | + |
| F | C+T | 3840 | 3843 | 10-32 and 136-147 | + | |
| F | C+T | 4330 | 4329 | 166-175 and 176-207 | e | e |
| F | C+T | 5034 | 5033 | 19-32 and 37-70 | + | |
| Ru(II) | T | 2169 | 2167 | 61-65 and 193-207 | e | e |
| Ru(II) | C+T | 2372 | 2375 | 19-32 and 169-175 | + | |
| Ru(II) | C+T | 2552 | 2549 | 22-34 and 105-114 | + | |
| Ru(II) | C+T | 2695 | 2698 | 19-32 and 105-114 | + | |
| Ru(II) | C+T | 3309 | 3308 | 4-18 and 19-32 | + | |
F, formaldehyde; Ru(II), Tris (2,2’-Bipyridyl) ruthenium(II) chloride.
C, chymotrypsin; T, trypsin, C+T, double digest with chymotrypsin and trypsin.
Predicted using the ExPASy Compute pI/MW tool (http://www.expasy.org/tools/pi_tool.html) using average isotopic masses for amino acids.
Symbol: + denotes juxtaposition in structure
Contact between polypeptides could not be evaluated because the protein structure used in the model does not extend beyond residue 176.
Figure 5.
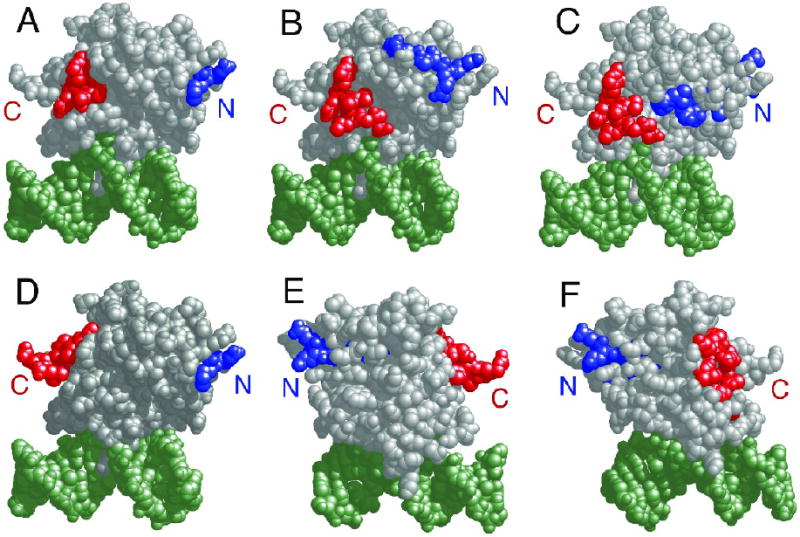
Proteolytic fragments of AGT assigned to intermolecular crosslinks. Representative fragment-pairs from the ensemble listed in Table III, mapped on the crystal structure of the monomeric AGT-DNA complex determined by Daniels et al.11. In each pair the fragment with sequence nearest the N-terminal end of the protein is colored blue, the one nearest the C-terminal end, red. Panel a: Fragments 1-7 and 163-169. Panel b: Fragments 8-19 and 159-167. Panel c: Fragments 22-34 and 159-167. Panel d: Fragments 1-7 and 169-176. Panel e: Fragments 19-32 and 169-176. Panel f: Fragments 19-32 and 105-114. Amino-terminal surfaces are labeled with a blue N, carboxyl-terminal surfaces with a red C.
Ion-release stoichiometries are nearly the same for single-and double-stranded DNAs
The models described above predict that AGT binding to duplex DNA will be accompanied by net release of ~2.6 cations, while binding single-stranded DNA will be accompanied by release of ~1.4. Binding measurements were made to test these predictions. The titration of short DNAs with AGT produces single mobility-shifted complexes at all protein concentrations, regardless of whether the DNA is single-stranded or duplex (Fig. 6a). Sedimentation equilibrium analyses indicate that n = 3.98 ± 0.07 for the 16nt DNA and 3.94 ± 0.08 for 16bp DNA shown in this example20. Because free AGT protein is monomeric under these solution conditions20, the formation of ~4:1 complexes without detectable intermediates of lower stoichiometry indicates that the binding is positively cooperative. Accordingly, the short-lattice variant34 of the McGhee-von Hippel relation (Eq. 1) was used to analyze binding distributions in these systems (Fig. 6b).
Figure 6.

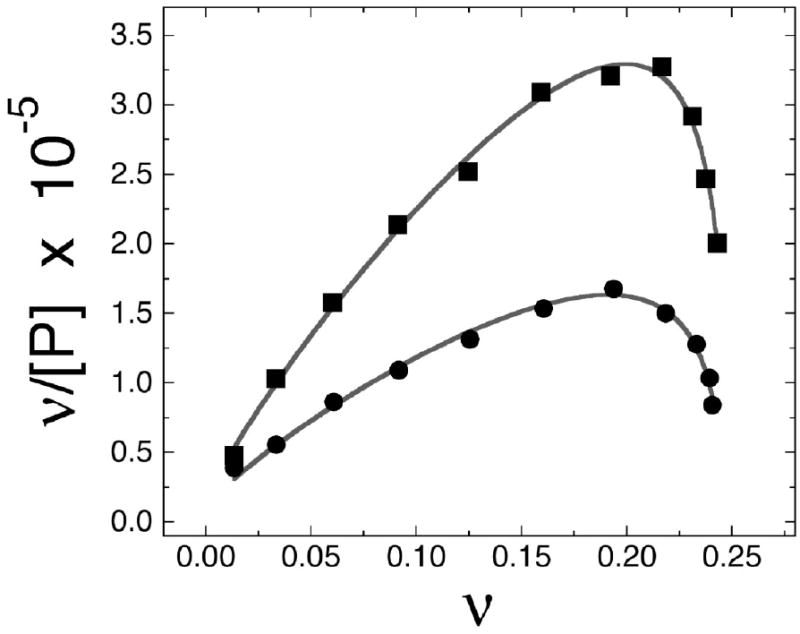
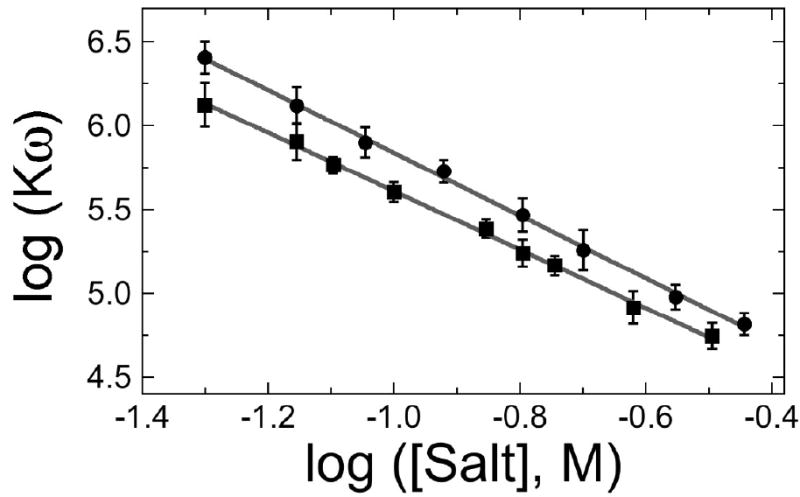
Analysis of ion-release stoichiometry of AGT binding to DNA. Panel a: Representative electrophoretic mobility shift assays. Binding was carried out at 20 ± 1°C in 10 mM Tris (pH 7.6), 50mM NaCl, 1mM dithiothreitol, and 10 μg/ml bovine serum albumin. Band designations: B, bound DNA; F, free DNA. Upper pane: binding to single-stranded 16mer DNA. Samples contained 5.3 × 10⁻⁷ M DNA (16mer A) and 0–4.9 × 10⁻⁶ M AGT. Lower pane: binding to duplex 16mer. Samples contained 4.8 × 10⁻⁷ M duplex DNA and 0–3.1 × 10⁻⁶ M AGT. Although these images have been cropped for efficient presentation, no additional electrophoretic bands are detectable in the originals. Panel b. Representative Scatchard plots of binding data for single-stranded and duplex DNAs. Data from experiments shown in panel a. Symbols: binding to single stranded DNA (●); binding to duplex DNA (■). The smooth curves are fits of Eq. 1 to these data sets, returning K = 1.69 ± 0.18 × 10⁴ M-1, ω = 151 ± 17 and s = 4.00 ± 0.13 for duplex 16-mer DNA, and K = 1.22 ± 0.19 × 10⁴ M-1, ω = 109 ± 16 and s = 4.03 ± 0.18 for the single-stranded 16-mer. Panel c: Dependence of log Kω on log [NaCl] for single-stranded and duplex DNAs. Binding assays were carried out at 20 ± 1 °C in 10 mM Tris (pH 7.5 at 20°C), 1 mM EDTA, 1mM DTT buffer containing 0.05-0.36M NaCl. Binding was detected by EMSA as shown in panel a and the product K•ω evaluated by Scatchard analysis as shown in panel b. Symbols: (■) data for single-stranded 16 mer DNA, (●), data for duplex 16 mer DNA. The solid lines are fits of the relation log Kω = log K1M − (Δm + Δx) log [MX] to the data, returning values of (Δm + Δx) = 1.74 ± 0.21 and log K1M = 3.86 ± 0.02 for single-stranded DNA and (Δm + Δx) = 1.87 ± 0.17 and log K1M = 3.97± 0.02 for duplex DNA.
| (1) |
Here ν is the binding density (protein molecules/nucleotide or base pair), [P] is the free protein concentration, K is the equilibrium association constant for binding a single site, ω is the cooperativity parameter, N is the length of the DNA in nucleotides or base pairs and s is the size of the site (in nucleotides or base pairs) that a protein molecule occupies to the exclusion of others. In our standard buffer containing 50 mM NaCl, K = 1.69 ± 0.18 × 10⁴ M-1, ω = 151 ± 17 and s = 4.00 ± 0.13 for duplex 16-mer DNA, while K = 1.22 ± 0.19 × 10⁴ M-1, ω = 109 ± 16 and s = 4.03 ± 0.18 for the single-stranded 16-mer. The product K•ω is a measure of affinity that takes into account both protein-DNA and protein-protein interactions. Values of K•ω for single-stranded DNA (1.36 ± 0.40 × 10⁶ M-1) and duplex DNA (2.58 ± 0.56 × 10⁶ M-1) are consistent with previous measurements made under similar buffer conditions18; 26.
The addition of a molecule of AGT to an AGT-DNA complex containing n protein molecules can be represented by
| (2) |
Here, n and n+1 represent AGT stoichiometries and Δm cations (M+) and Δx anions (X-) are released on protein binding. The stoichiometric differences Δm and Δx can be positive (corresponding to net ion release) or negative (corresponding to net ion uptake). With appropriate assumptions about macromolecular hydration and ion activities35, the composite cation and anion stoichiometry differences of this reaction can be estimated from the dependence of log Kω on log [MX].
| (3) |
A graph of the dependence of log(Kω) on log[NaCl] for single-stranded and duplex 16mer DNAs is shown in Fig. 6c. The solid lines are fits of the relation log Kω = log K1M − (Δm + Δx)log [MX] to the data30; 36. The slopes indicate that 1.74 ± 0.21 ions are released per AGT monomer added to a cooperative complex formed on single-stranded DNA and 1.87 ± 0.17 ions are released per AGT monomer added to a cooperative complex on duplex DNA. These values are remarkably similar, given the difference in charge density of single- and double-stranded DNAs. Record and colleagues have shown that the binding and screening effects of a 1:1 salt like NaCl are thermodynamically-equivalent to the association of 0.88 cation per duplex DNA phosphate and 0.71 cation per single-stranded DNA phosphate, over a wide range of salt concentrations30; 35. Thus if the ionic stoichiometry is due solely to the release of cations from DNA, our results support models in which one molecule of AGT makes 2.1 ± 0.2 ionic contacts with a double-stranded DNA substrate and 2.5 ± 0.3 contacts with single-stranded DNA.
The similarity of these ion-stoichiometry values to one another and the fact that they lie between those predicted for single-stranded and duplex complexes, opens to question whether the DNAs in our samples have different secondary structures prior to binding and whether AGT can change the secondary structure of the DNA to which it binds. To address these questions we performed a binding competition analysis37. Shown in Fig. 7a, an equimolar mixture of single stranded and duplex 16mer DNAs was titrated with AGT. Distinct electrophoretic mobilities of the two free DNA species indicate that the starting materials for single-stranded and duplex DNA binding assays were indeed different; the relative electrophoretic mobilities of free DNA species are the same as those of samples for which the secondary structure was verified by sedimentation equilibrium analysis (result not shown). A weak binding preference for duplex DNA can be seen in this titration. A graph of the ratio Yds/Yss as a function of AGT concentration is shown in Fig. 7b. As described in Methods, is a measure of Kds/Kss; for the 16mer system the limiting value of Kds/Kss = 1.47 ± 0.03. These values compare well with the ratio K•ω(ds)/K•ω(ss) (~1.9) that can be calculated from binding affinities measured for single-stranded and duplex 16mer samples in separate reactions as described above. The weak preference for duplex DNA shown here is incompatible with the possibility that AGT destabilizes the duplex form of the 16mer; by the same token, the small difference in complex stabilities (amounting to ~0.2 kcal/mole at 20°C) argues against the possibility that AGT is an effective stabilizer of a duplex form composed of two molecules of the 16mer oligonucleotide A2. These conclusions are supported by the results of experiments with supercoiled DNAs (described below) that indicate that AGT unwinds DNA by an amount that is too small to be compatible with DNA melting.
Figure 7.


Equilibrium partition of AGT between single stranded and duplex 16mer DNAs. Upper panel: binding detected by mobility shift assay. Binding reactions were carried out at 20 ± 1 °C in 10mM Tris (pH 7.5 at 20°C), 50 mM NaCl, 1mM dithiothreitol, and 10μg/mL bovine serum albumin. Samples contained 4.2 × 10⁻⁷ M of each DNA and 0 - 6.0 × 10⁻⁶ M AGT. Band designations: B, bound DNAs; F, free DNAs. Lower Panel: Dependence of binding ratio Yds/Yss on AGT concentration. As described in Methods, in the limit of low [AGT], Yds/Yss = Kds/Kss. The solid lines are linear fits to the data, returning Kds/Kss = 1.47 ± 0.03.
The measured number of ionic contacts for complexes formed from duplex 16mer DNA is ~1 unit smaller than that predicted from the crystal structure of the AGT-DNA interface while the value for complexes formed from single-stranded DNA is ~0.5 unit larger than that predicted by the isosteric model of that complex (Fig. 3b). These departures from the predicted values suggest that an additional process, such as the formation of protein-protein contacts may contribute modestly to the overall ionic stoichiometry. Charged residues located in the protein-protein interface (listed in Table I) may provide ion-binding sites that contribute to this effect. The similarity of ion-release stoichiometries for binding single stranded and duplex DNAs indicates that the electrostatic contributions to the binding free energy are similar; this accounts, in part, for the strikingly similar binding affinities for single- and double-stranded DNAs, described above.
Table I.
Oligonucleotides used in these studies
| Name | Sequence |
|---|---|
| 16mer A | 5’- GAC TGA CTG ACT GAC T -3’ |
| 16mer B | 5’- AGT CAG TCA GTC AGT C -3’ |
DNA is slightly underwound in the cooperative AGT-complex
AGT binds double stranded DNAs at densities up to 1 protein/4bp18,20. If, at binding saturation, every AGT molecule makes identical contact with canonical B-DNA, each protein will be rotated approximately (4 bp•protein-1/10.4 bp•turn-1) × 360 deg•turn-1 = 138.4 deg•protein-1 with respect to its immediate neighbor. If protein contacts constrain the geometry of the complex to values other than ~138°/binding step, cooperative binding should cause local DNA unwinding (at rotation angles < 138°/binding step) or overwinding (at rotation angles > 138°/binding step). Supercoil relaxation assays performed with E. coli and vaccinia topoisomerases were used to test these alternatives3, with covalently-closed circular pUC19 DNA as the substrate. As shown in Fig. 8a, increasing [AGT] biased topoisomer distributions in favor of species that migrate more rapidly during agarose-gel electrophoresis. Two-dimensional electrophoresis, with migration in the second dimension carried out in the presence of ethidium bromide38 established that the DNA became underwound with respect to relaxed circular DNA as a consequence of AGT binding (result not shown). Integrated band intensities of representative topoisomer populations are graphed in Fig. 8b; analysis with Eq. 6 shows that the mean linking difference (ΔLkm) decreases from 0 to ~-7 over the range of AGT concentrations tested.
Figure 8.
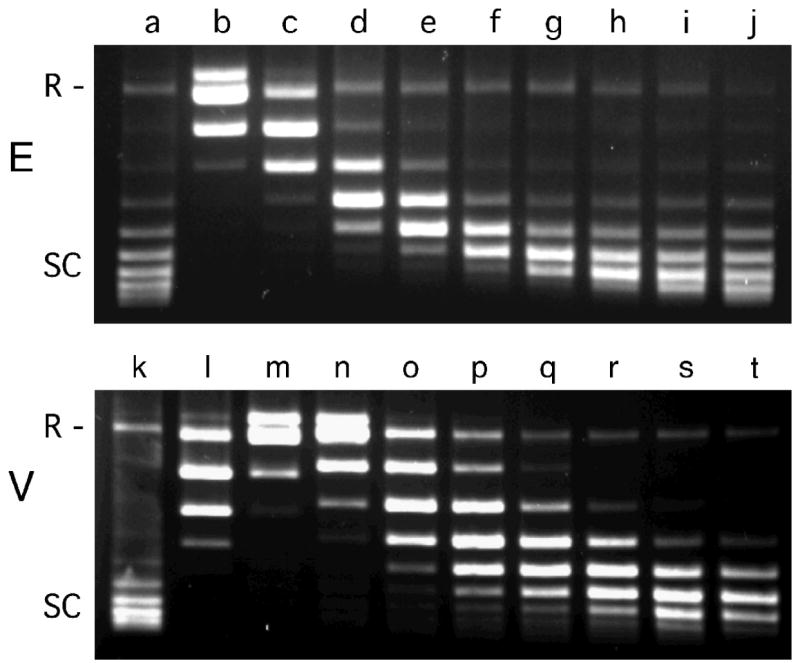

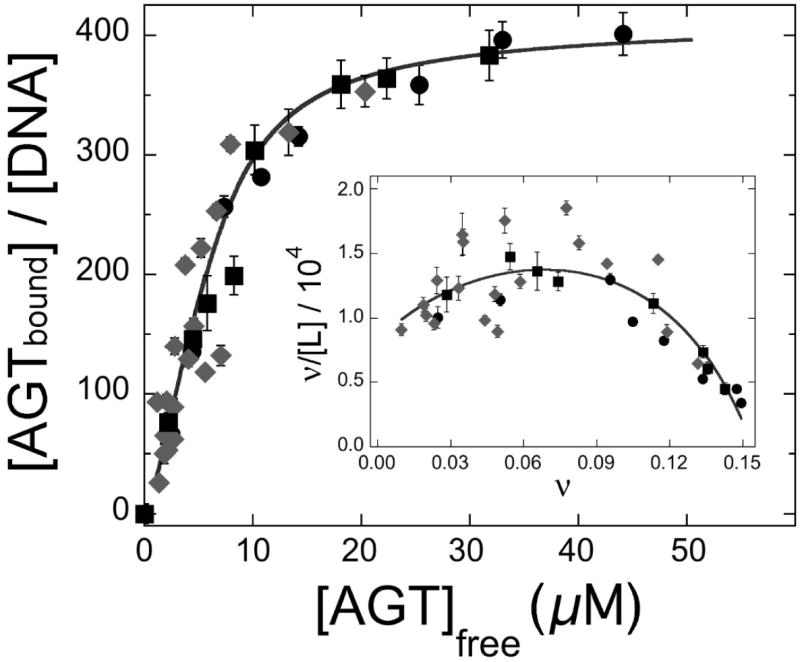
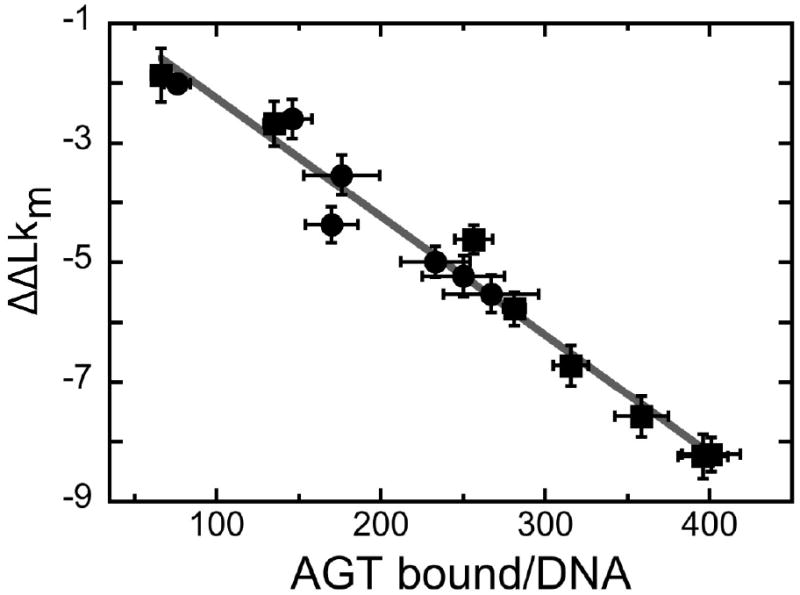
Determination of the DNA linking number difference for AGT binding to pUC19 DNA. Panel a: Electrophoretic resolution of topoisomerase I assay samples. Top image: experiment conducted with E. coli topoisomerase I (designated E). Bottom image: experiment conducted with Vaccinia topoisomerase I (designated V). All samples contained closed circular pUC19 DNA (12.0 nM). Samples c-j contained AGT protein at final concentrations of 4.2μM, 8.5μM, 10.9μM, 14.6μM, 18.2μM, 22.5μM, 26.7μM and 36.4μM, respectively. Samples m-t contained AGT protein at final concentrations of 4.2μM, 8.3μM, 15μM, 22μM, 28μM, 36μM, 46μM and 60μM, respectively. Samples b-j were treated with E. coli topoisomerase I (2 units) for 1.5h at 20°C; samples l-t were treated with Vaccinia topoisomerase I (2 units) for 2.5h at 20°C. Samples were split and one half of each sample was deproteinized with phenol and subjected to electrophoresis on a 1.4% agarose gel. The gel was stained with ethidium bromide and photographed digitally with UV transillumination. Panel b: Distribution of ΔLk for samples c-g. Integrated band intensities from the gel shown in (a) were normalized to the highest intensity band in each supercoiled ensemble. The smooth curves are fits of Eq. 6 to this data, allowing the most probable value of the linking difference to be determined for each sample. Panel c: Dependence of binding stoichiometry on free AGT concentration. Stoichiometries were inferred from the weight-average reduced molecular weights of AGT-DNA complexes, measured at sedimentation equilibrium. Black symbols (■,●) represent values of samples taken from topoisomerase reactions shown in panel a, and subjected to analytical ultracentrifugation without further treatment. Grey diamonds (◆) represent data from independent experiments carried out with linear pUC19. Error bars represent 95% confidence limits for the individual parameters. The smooth curve is an isotherm calculated with Eq. 4 using parameters determined from the Scatchard plot shown in the inset. Inset: Scatchard plot for the data ensemble shown in the main panel. The solid curve is a fit of Eq. 4 to the data, returning K = 7,890 ± 1,030 M-1, ω = 51.9 ± 4.2 and s = 6.6 ± 0.2. Panel d: Dependence of the linking difference ΔΔLk on binding stoichiometry, n. Data from the experiments shown in panels a and c. The error bars represent standard errors of the measurement distributions in each dimension. The line is a linear fit to the points; the slope dΔΔLk/dn = -0.020 ± 0.001, equivalent to a net unwinding of 7.31 ± 0.35 deg/protein bound.
Aliquots from each topoisomerase reaction were analyzed at sedimentation equilibrium and weight-average binding stoichiometries (n) were calculated from the reduced molecular weights of AGT-DNA complexes. Shown in Fig. 8c is a graph of stoichiometry as a function of free [AGT] for binding to topoisomerase-relaxed closed-circular and linearized pUC19 DNAs; the very similar binding densities observed for these DNAs indicate that the closed-circular DNAs were fully-relaxed and that structural differences that distinguish circular from linear DNAs (e.g., the presence of molecular ends in the linear form) did not greatly affect binding. Shown in the inset is a Scatchard plot of the same data; the solid curve is a fit of the infinite lattice form of the McGhee-von Hippel equation (Eq. 4)
| (4) |
in which ν = n/2686, [P] = [P]input − n[pUC19]input, K is the equilibrium association constant for binding a single site, ω is the cooperativity parameter and s is the size of the site (in base pairs) that a protein molecule occupies to the exclusion of others39. This analysis returned K = 8266 ± 1018, ω = 43.9 ± 3.2 and s = 6.8 ± 0.2. These values of K and ω are smaller than ones observed for binding to the duplex 16-mer (see above), while the occluded binding site size (6.8 ± 0.2) is larger. These differences may reflect the different buffer compositions used in binding and topoisomerase assays, or they may reflect the packing inhomogeneities expected for binding to a large DNA that are largely absent when short templates are used. The change of the mean linking difference ΔLkm with binding stoichiometry (n) is shown in Fig. 8d. Over a wide stoichiometry range, AGT binding is accompanied by a linking difference of -0.020 ± 0.001/protein molecule, equivalent to a net unwinding of 7.12 ± 0.33 deg/protein. Consistent values were obtained with both E. coli and vaccinia topoisomerases, indicating that the measured linking difference is unlikely to be an artifact of topoisomerase mechanism or of interactions between AGT and topoisomerase molecules bound to DNA4. The small value of ΔΔLkm/n attributable to AGT binding is too small to be compatible with DNA melting, and in addition, indicates that torsional distortion of DNA is unlikely to make a large contribution to ΔG° (assembly) of AGT-DNA complexes.
DISCUSSION
Many proteins bind DNA with secondary structure specificity. Examples of this are the single-strand binding proteins (SSBs) that participate in DNA replication, recombination, and repair40; 41 and the transcription factors and type II restriction endonucleases that bind preferentially to duplex DNA42; 43. AGT is unlike these classes of proteins, in that it binds short single-stranded and duplex DNAs with equal densities and closely-similar affinities and cooperativities (Fig. 6b). These characteristics are remarkable, because single stranded and duplex DNAs differ in charge density, conformational flexibility and in the relative amounts of polar and non-polar surface available for interaction, and because such factors are commonly thought to exert strong influences on the structure and stability of protein-DNA complexes44; 45; 46.
We have proposed simple structural models that account for these features of AGT complexes with single- and double stranded DNAs. The models require few assumptions and make explicit predictions about the quaternary structures of the complexes, the conformations of protein and DNA, the identities of residues that mediate protein-protein contact and the numbers of ionic contacts between protein and DNA. The most important assumption is that the structure of protein in the cooperative complex is similar to that in the 1:1 complex crystallized by Tainer and co-workers. This seems reasonable because circular dichroism and crystallographic data indicate that the structure of AGT is little changed on DNA binding11; 27 and because the model requires no conformational adjustment to avoid backbone-level steric clash between proteins. In addition, the crosslinking data (Fig. 5) are consistent with the juxtaposition of the amino-terminal and carboxyl-terminal protein surfaces predicted by the models. While this reasoning does not rule out protein conformational change, any change must allow juxtaposition of the protein surfaces that are found to be adjacent by crosslinking.
A second assumption is that the helical twist of the DNA is similar to that of the canonical B-form duplex. Similarities in overall affinity (K•ω) for single- and double-stranded templates indicate that binding is not accompanied by a large change in twist that would be energetically costly when the substrate is duplex DNA but much less so when it is single-stranded. Topoisomerase experiments (Fig. 8) show that AGT binding is accompanied by a small but measurable net unwinding (7.14 ± 0.33 deg/protein), consistent with the observed widening of the minor groove where it interacts with the helix-turn-helix structure of the protein11. This degree of unwinding suggests that the helical pitch of the complex might be as small as 131 deg/ protein, instead of the value of 138 deg/protein used to build the current models. This would reduce the rotational displacement of protein n+3 with respect to protein n, and increase the likelihood of contact between these proteins.
A third assumption is that protein-protein contacts are the same in complexes with single-stranded and duplex DNAs. The crosslinking experiments described above were carried out with single-stranded DNA only, so our experimental data does not address this assumption. However, analysis of the CD spectra of complexes formed with single-stranded and duplex templates indicates that any differences in protein conformation are not large (M. Melikishvili, unpublished result). In addition, nearly identical values of binding density and similar values of binding cooperativity (Fig. 6) as well as the ability to efficiently repair both single- and double-stranded templates23; 24; 25 are most simply explained by complexes that have close structural and functional similarity.
Finally, these models assume that AGT interactions with the DNA strand that is undergoing repair are the same in complexes containing single-stranded DNA as they are in complexes containing duplex. Our current data does not directly address this assumption. However, because AGT repairs both single-stranded and double-stranded DNAs 23; 24; 25, contacts with the extrahelical base itself are likely to be similar. In addition, since the occluded binding site sizes are effectively the same (4.03 ± 0.18 nt/single stranded site and 4.00 ± 0.13 bp/double stranded site18; 26) and since double-stranded DNA is only slightly bent in its complex with AGT11, single-stranded DNA can not follow a much-more curved trajectory in its contacts with protein, since this would require a significantly longer contour length than is occupied on binding double-stranded DNA. This consideration constrains the single-stranded DNA to a path that lies close to the one assumed in the model.
The models proposed here account for a number of features that have been observed for AGT-DNA complexes. Cooperative binding with overlapping sites spaced every 4 bp (nt) along the DNA accounts for the 4bp (nt) period of oscillations in the apparent binding site size and in binding cooperativity that have been found with double-stranded and single stranded DNAs as functions of template length18; 26. The three-start helical array of proteins with weak contacts between proteins n, n+1 and n+2 and strong contacts between proteins n and n+3 accounts for the weak cooperativity observed in 2:1 and 3:1 complexes and the striking increase in cooperativity for stoichiometries ≥ 4:118; 26. As cooperative arrays increase in length, the increasing proportion of proteins with satisfied n-to-n+3 and n-to-n-3 contacts accounts for the observed increase in basal cooperativity underlying the length-dependent oscillation18. The small difference of affinity for ss- and dsDNAs (Fig. 6b) may reflect the asymmetric DNA interactions featured in our models, in which AGT makes extensive contacts with the DNA strand containing exocyclic bases, but few with its complement. On this basis, loss of contact with the complementary strand as AGT transfers from duplex to single-stranded substrates should have little effect on complex stability. By the same token, the ability to form similar protein-protein contacts when bound to single stranded and duplex DNAs accounts for the similar values of ω (Fig. 6), with the result that transfer between duplex and single-stranded DNAs is not affected by a change in the contribution of binding cooperativity to complex stability. These features may account for AGT’s ability to repair single stranded and duplex DNA substrates with similar efficacy.
The models proposed here make additional predictions that remain to be tested. First, they predict that the dimensions and hydrodynamic properties of complexes containing equal numbers of protein molecules but formed on single- or double-stranded DNAs will be closely similar. Second, the models identify AGT surfaces that are essential for protein-protein interaction and that do not contact DNA. We expect that mutation of residues within these surfaces will change the free energy of protein-protein interaction (measurable as binding cooperativity, ω) but not the free energy of DNA interaction (measurable as intrinsic association constant K). Third, the models predict that all AGT molecules in a cooperative unit will have the same orientation with respect to one DNA strand. In our models and in the structure of Daniels et al., the N-terminal end of the protein is oriented toward the 5’ end of the repaired strand11. Polarized binding may account for the differences in repair efficiency observed for lesions located near the 5’ and 3’ ends of single-stranded substrates25. If binding is polarized with respect to one strand, complexes formed with duplex DNA will have a two-fold degeneracy reflecting the fact that there are two possible orientations of the bound protein, while complexes with single stranded DNA will be homogeneous. We anticipate that this difference will result in quite distinct patterns of DNA protection when complexes containing single-stranded and duplex DNAs are probed with hydroxyl radicals or other reagents.
Finally, the small unwinding angles obtained in our topoisomerase assays (Fig. 8) and the small changes in the CD spectra of duplex DNA when AGT binds27 indicate that the formation of a cooperative AGT-DNA complex has little effect on base-stacking and DNA backbone conformations. Together, these results suggest that within the cell, AGT may interact preferentially with regions of torsionally-relaxed duplex DNA. Since the exposure of such DNA in the nucleus depends on the activities of chromatin-remodelling and topoisomerase enzymes47; 48 and since these activities are required for DNA replication and transcription, we predict that the activities of AGT will be concentrated near replication forks and in regions of actively-transcribed chromatin. The ability to bind and repair single-stranded DNAs further suggests that AGT may be active within the replication fork itself. Experiments designed to test these predictions are underway.
MATERIALS AND METHODS
Enzymes and Reagents
T4 polynucleotide kinase and E. coli topoisomerase I were purchased from New England Biolabs. Vaccinia topoisomerase I was from Sigma. Sequencing grade trypsin and chymotrypsin were from Worthington. [γ-32P]ATP was from ICN Radiochemicals. Tris (2,2’-Bipyridyl) ruthenium(II) chloride was purchased from Aldrich.
Human AGT Protein
Recombinant human AGT protein (tagged with His6 at its C-terminal end) was purified to apparent homogeneity by the method of Daniels et al.11. Samples were stored at -80°C until needed. The purity of the protein was verified by SDS-gel electrophoresis followed by silver-staining49; 50. The protein sedimented in the analytical ultracentrifuge as a single species with Mr = 21,860 ± 400 (M. Fried, unpublished result). This value agrees well with previous measurements19 and is consistent with the value (Mr = 21,614) predicted from the sequence of this variant of the protein. The preparations used were >95% active in transfer of methyl groups from O6-[3H]methyl guanine-labeled calf-thymus DNA to AGT and >95% active in debenzylating O6-benzylguanine, as previously described51; 52. AGT concentrations were measured spectrophotometrically using the molar extinction coefficient, ε280 = 3.93 × 10⁴ M-1 cm-1, determined by Roy et al.53.
DNA substrates
Sixteen-residue oligodeoxyribonucleotides (sequences given in Table 1) were purchased from Gibco-BRL. To obtain duplex forms, oligonucleotide samples were combined and annealed as described51. DNA samples were labeled at 5’ termini with 32P as described by Maxam and Gilbert54. Unincorporated [γ32P]-ATP was removed using Sephadex G-25 centrifuge columns (Pharmacia). Plasmid pUC19 DNA was purchased from Sigma. Stock DNA concentrations were measured spectrophotometrically, using ε260 = 1.3 × 10⁴ M-1 cm-1 (per base pair) for duplex samples and ε260 = 9.475 × 10³ M-1 cm-1 (per base) for single-stranded samples55; 56.
Electrophoretic mobility shift assays (EMSA)
Binding reactions were carried out at 20 ± 1 °C in 10mM Tris (pH 7.6), 50 mM NaCl, 1mM dithiothreitol, and 10μg/mL bovine serum albumin, as described26. Solutions of AGT protein (typically 5 × 10⁻⁷ M ≤ [AGT] ≤ 3 × 10⁻⁵ M) were added directly to 32P-DNA solutions (typically ~5 × 10⁻⁸M). Mixtures were equilibrated at 20 (±1) °C for 30 min. Duplicate samples incubated for longer periods gave identical results, indicating that equilibrium had been attained (result not shown). Electrophoresis was carried out in 10% polyacrylamide gels. Autoradiographic images were captured on storage phosphor screens (type GP, GE Healthcare) detected with a Typhoon phosphorimager and quantitated with Image-Quant software (GE Healthcare).
Competition assays were carried out using solutions containing equimolar mixtures of single-stranded and duplex 16mer DNAs. For these experiments, duplex DNA was formed by annealing the labeled oligonucleotide with 0.5 equivalent of unlabeled complementary strand, ensuring that single-stranded (ss) and duplex (ds) forms had the same specific radioactivity. AGT binds single stranded and duplex 16mer DNAs cooperatively to form 4:1 complexes20. This binding can be described by the saturation functions Yss = Kss[P]n/(1 + Kss[P]n), and Yds = Kds[P]n/(1 + Kds[P]n) in which Yss and Yds are the mole fractions of single-stranded and double stranded DNAs bound, respectively; [P] is the free protein concentration, n is the stoichiometry and Kss and Kds are formation constants for complexes with single- and double-stranded DNAs, respectively. The distribution of AGT between double-stranded and single-stranded DNAs is given by the ratio
| (5) |
In the limit of low [P], Yds/Yss = Kds/Kss. Similar methods have been used to analyze non-cooperative binding37; 57.
Protein crosslinking and mass spectrometry
AGT-DNA complexes were formed under conditions of DNA-excess, in 10mM sodium phosphate (pH 7.6), 100 mM NaCl buffer. The DNA used was the single-stranded 16mer (Oligonucleotide A shown in Table I). Crosslinking reactions were performed with either Tris (2,2’-Bipyridyl) ruthenium(II) chloride (Ru(II)) or formaldehyde according to published methods33; 58. Monomeric and covalently-dimeric proteins were resolved by SDS-PAGE49. Gel slices corresponding to monomer and dimer gel bands were digested with sequencing grade trypsin and/or chymotrypsin. Soluble polypeptides were extracted into aqueous buffer, adjusted to 2.5 mg/mL alpha-cyanohydroxycinnamic acid, 0.05% trifluoroacetic acid, 50% acetonitrile and spotted on a gold target. Dried spots were washed five times with 0.1% trifluoroacetic acid and re-dried. Mass spectrometry was performed using a Ciphergen (Fremont, CA) PBSIIc MALDI-TOF mass spectrometer operated at a digitizer rate of 250 MHz, pulse voltage 3000 V and source voltage 20,000 V. Comparison of the spectra of fragments from crosslinked and uncrosslinked protein samples allowed identify-cation of crosslinked species; comparison of spectra from monomeric and dimeric AGT samples allowed identification of crosslinked species that are unique to the covalent dimer. Assignment of peaks was made by comparison of measured masses with those predicted for proteolytic fragments of AGT using the Peptide Mass program available on the ExPASy web server (http://www.expasy.ch/tools/peptide-mass.html). Peaks in the mass spectrum that were produced by crosslinking were assigned by comparison of measured masses with those predicted for pairs of proteolytic fragments.
Topoisomerase assays
Covalently closed circular pUC19 DNA (12 nM), AGT (0-36.4 μM) and E. coli topoisomerase I (2 units) or Vaccinia topoisomerase I (2 units) were equilibrated at 20°C for 90 min in 50 mM potassium acetate, 20 mM Tris acetate, 10 mM magnesium acetate, 1 mM DTT; pH 7.9. One-half of each sample was resolved by electrophoresis in 1.4% agarose gels run at 2 V/cm. Gels were stained with 0.5 μg/mL ethidium bromide (Sigma) and photographed with UV illumination (254 nm) using a digital camera (BioRad). Relative band intensities were determined by integration of selected portions of the digital image using the QuantityOne program (BioRad). The integrated intensities were graphed as a function of the linking difference of an electrophoretic band with respect to relaxed circular DNA (ΔLk). This gives a Boltzmann distribution of intensities from which the mean linking difference, ΔLkm, was calculated by fitting the dependence of band intensity on ΔLk using Eq. 6.
| (6) |
Here I and IM are, respectively, integrated band intensity and maximum band intensity at the peak of the topoisomer distribution and w is the width of the distribution38. The remaining half of each sample was analyzed at sedimentation equilibrium to determine the AGT binding density generating observed values of ΔLkm.
Sedimentation equilibrium analysis
Analytical ultracentrifugation was performed at 20°C in a Beckman XL-A centrifuge using an AN60Ti rotor. Scans were obtained at 260 nm. Equilibration was considered to be complete when scans taken 6h apart were indistinguishable. Typically, equilibration times ≥24h met this criterion for AGT-DNA mixtures. Five scans were averaged for each sample at each wavelength and rotor speed. For large DNAs with many protein-binding sites (such as pUC19 DNA), the concentration of protein-free DNA molecules becomes negligible long before all available binding sites are saturated. In such systems, one observes mixtures of free protein and protein-DNA complex, with the weight-average molecular weight of the complex increasing smoothly until saturation is approached. These systems were analyzed using equation 7.
| (7) |
Here, A(r) is the absorbance at radial position r and αP, and αPnD are absorbances of protein and protein-DNA complex at the reference position, ro, and ε is a baseline offset that accounts for radial position-independent differences in the absorbances of different cell assemblies. The reduced molecular weights of AGT protein, and protein-DNA complexes are given by σP = MP(1 - ν̄ P ρ)ω2/(2RT) and σPnD = (nMP + MD)(1 -ν̄PnD ρ)ω2/(2RT). Here MP and MD are the molecular weights of protein and DNA, n is the protein:DNA ratio of the complex; ρ is the solvent density, ω, the rotor angular velocity, R is the gas constant and T the temperature (Kelvin). The partial specific volume of AGT (ν̄ P = 0.744 mL/g) was calculated by the method of Cohn and Edsall59, using partial specific volumes of amino acids tabulated by Laue and co-workers60. The partial specific volume of duplex NaDNA at 0.1M NaCl (ν̄ D = 0.55 ml/g) was estimated by interpolation of the data of Cohen and Eisenberg61. Partial specific volumes of each protein-DNA complex were estimated using Eq. 8.
| (8) |
Model calculations
Models of the cooperative complex were built using the program O62. Except where noted, structure figures were generated using RASMOL63. Solvent-accessible surface areas were calculated by the Connolly method64 implemented in the program GRASP65. Electrostatic charge distributions were also calculated using GRASP.
Supplementary Material
Acknowledgments
Mass spectrometric analyses were performed at the University of Kentucky Center for Structural Biology Protein Core Facility. This facility is supported in part by funds from NIH National Center for Research Resources (NCRR) grant P20 RR020171. We gratefully acknowledge the help of Dr. Carol Beach in acquiring this data. Research in this report was supported by NIH grants GM-070662 (to M.G.F.), CA-018137 and CA-097209 (to A.E.P.), NS-38041, DA-02243, and RR-20171 (to D.W.R.), and Medical Scientist Training Program Grant 5 T32 GM-08601-05 (to J.J.R.).
Footnotes
For linear polyelectrolytes dissolved in 1:1 salt solutions, Record and colleagues30; 35 have shown that the fractional charge neutralization (ψ) is the sum of contributions from counterion condensation (c) and screening (s) and that this sum depends on the charge density parameter ξ:
| (9) |
For single-stranded DNAs, these authors have shown that ξ = 1.7 and ψ ~0.71. For duplex DNAs, ξ = 4.2 and ψ = 0.88.
We view the formation of a duplex from our single-stranded 16mer as unlikely, given that the best alignment of two molecules of 16merA DNA gives only five Watson-Crick base-pairs and that all base-pairs are separated by at least one unpaired residue.
E. coli topoisomerase I preferentially relaxes negatively-supercoiled DNAs while the vaccinia enzyme relaxes both negatively- and positively-supercoiled molecules 66; 67; 68.
The topoisomer distributions obtained with vaccinia topoisomerase are offset in the direction of positive supercoiling when compared to those obtained with the E. coli enzyme. This is an expected consequence of the preferential binding of vaccinia topoisomerase with positively supercoiled DNA67; 68. When this offset is taken into account, the AGT-dependent linking differences observed with vaccinia and E. coli topoisomerases are fully compatible with each-other (Fig. 8d).
Publisher's Disclaimer: This is a PDF file of an unedited manuscript that has been accepted for publication. As a service to our customers we are providing this early version of the manuscript. The manuscript will undergo copyediting, typesetting, and review of the resulting proof before it is published in its final citable form. Please note that during the production process errors may be discovered which could affect the content, and all legal disclaimers that apply to the journal pertain.
References
- 1.Loveless A. Possible relevance of O-6 alkylation of dexoyguanosine to the mutagenicity and carcinogenicity of nitrosamines and nitrosamides. Nature (London) 1969;223:206–207. doi: 10.1038/223206a0. [DOI] [PubMed] [Google Scholar]
- 2.Pegg AE. Mammalian O6-alkylguanine-DNA alkyltransferase: regulation and importance in response to alkylating carcinogens and therapeutic agents. Cancer Res. 1990;50:6119–6129. [PubMed] [Google Scholar]
- 3.Margison GP, Santibáñez-Koref MF. O6-Alkylguanine-DNA alkyltransferase: role in carcinogenesis and chemotherapy. BioEssays. 2002;24:255–266. doi: 10.1002/bies.10063. [DOI] [PubMed] [Google Scholar]
- 4.Snow ET, Mitra S. Do carcinogen-modified deoxynucleotide precursors contribute to cellular mutagenesis? Cancer Invest. 1987;5:119–125. doi: 10.3109/07357908709018466. [DOI] [PubMed] [Google Scholar]
- 5.Encell LP, Loeb lA. Enhanced in vivo repair of O4-methylthymine by a mutant human DNA alkyltransferase. Carcinogenesis. 2000;21:1397–1402. [PubMed] [Google Scholar]
- 6.Gerson SL. Clinical relevance of MGMT in the treatment of cancer. J Clin Oncol. 2002;20:2388–2399. doi: 10.1200/JCO.2002.06.110. [DOI] [PubMed] [Google Scholar]
- 7.Pegg AE. Repair of O(6)-alkylguanine by alkyltransferases. Mutat Res. 2000;462:83–100. doi: 10.1016/s1383-5742(00)00017-x. [DOI] [PubMed] [Google Scholar]
- 8.Ranson M, Middleton MR, Bridgewater J, Lee SM, Dawson M, Jowle D, Halbert G, Waller S, McGrath H, Gumbrell L, McElhinney RS, Donnelly D, McMurry TB, Margison GP. Lomeguatrib, a potent inhibitor of O6-alkylguanine-DNA-alkyltransferase: phase I safety, pharmacodynamic, and pharmacokinetic trial and evaluation in combination with temozolomide in patients with advanced solid tumors. Clin Cancer Res. 2006;12:1577–1584. doi: 10.1158/1078-0432.CCR-05-2198. [DOI] [PubMed] [Google Scholar]
- 9.Hegi ME, Liu L, Herman JG, Stupp R, Wick W, Weller M, Mehta MP, Gilbert MR. Correlation of O6-methylguanine methyltransferase (MGMT) promoter methylation with clinical outcomes in glioblastoma and clinical strategies to modulate MGMT activity. J Clin Oncol. 2008;26:4189–4199. doi: 10.1200/JCO.2007.11.5964. [DOI] [PubMed] [Google Scholar]
- 10.Daniels DS, Mol CD, Arval AS, Kanugula S, Pegg AE, Tainer JA. Active and alkylated human AGT structures: a novel zinc site, inhibitor and extrahelical binding. DNA damage reversal revealed by mutants and structures of active and alkylated human AGT. EMBO J. 2000;19:1719–1730. doi: 10.1093/emboj/19.7.1719. [DOI] [PMC free article] [PubMed] [Google Scholar]
- 11.Daniels DS, Woo TT, Luu KX, Noll DM, Clarke ND, Pegg AE, Tainer JA. DNA binding and nucleotide flipping by the human DNA repair protein AGT. Nat Struct Mol Biol. 2004;11:714–720. doi: 10.1038/nsmb791. [DOI] [PubMed] [Google Scholar]
- 12.Duguid EM, Rice PA, He C. The Structure of the Human AGT Protein Bound to DNA and its Implications for Damage Detection. J Mol Biol. 2005;350:657–666. doi: 10.1016/j.jmb.2005.05.028. [DOI] [PubMed] [Google Scholar]
- 13.Lavon I, Fuchs D, Zrihan D, Efroni G, Zelikovitch B, Fellig Y, Siega lT. Novel mechanism whereby nuclear factor kappaB mediates DNA damage repair through regulation of O(6)-methylguanine-DNA-methyltransferase. Cancer Res. 2007;67:8952–8959. doi: 10.1158/0008-5472.CAN-06-3820. [DOI] [PubMed] [Google Scholar]
- 14.Kuo CC, Liu JF, Shiah HS, Ma LC, Chang JY. Tamoxifen accelerates proteasomal degradation of O6-methylguanine DNA methyltransferase in human cancer cells. Int J Cancer. 2007;121:2293–2300. doi: 10.1002/ijc.22927. [DOI] [PubMed] [Google Scholar]
- 15.Coulter R, Blandino M, Tomlinson JM, Pauly GT, Krajewska M, Moschel RC, Peterson LA, Pegg AE, Spratt TE. Differences in the rate of repair of O6-alkylguanines in different sequence contexts by O6-alkylguanine-DNA alkyltransferase. Chem Res Toxicol. 2007;20:1966–1971. doi: 10.1021/tx700271j. [DOI] [PubMed] [Google Scholar]
- 16.Fang Q, Noronha AM, Murphy SP, Wilds CJ, Tubbs JL, Tainer JA, Chowdhury G, Guengerich FP, Pegg AE. Repair of O6-G-alkyl-O6-G interstrand cross-links by human O6-alkylguanine-DNA alkyltransferase. Biochemistry. 2008;47:10892–10903. doi: 10.1021/bi8008664. [DOI] [PMC free article] [PubMed] [Google Scholar]
- 17.Pegg AE, Dolan ME, Moschel RC. Structure, function and inhibition of O6-alkylguanine-DNA alkyltransferase. Prog Nucl Acid Res and Mol Biol. 1995;51:167–223. doi: 10.1016/s0079-6603(08)60879-x. [DOI] [PubMed] [Google Scholar]
- 18.Melikishvili M, Rasimas JJ, Pegg AE, Fried MG. Interactions of human O6-alkylguanine-DNA alkyltransferase (AGT) with short double-stranded DNAs. Biochemistry. 2008;47:13754–13763. doi: 10.1021/bi801666c. [DOI] [PMC free article] [PubMed] [Google Scholar]
- 19.Fried MG, Kanugula S, Bromberg JL, Pegg AE. DNA Binding Mechanisms of O6-Alkylguanine-DNA Alkyltransferase: Stoichiometry and Effects of DNA Base Composition and Secondary Structures on Complex Stability. Biochemistry. 1996;35:15295–15301. doi: 10.1021/bi960971k. [DOI] [PubMed] [Google Scholar]
- 20.Rasimas JJ, Pegg AE, Fried MG. DNA-binding mechanism of O6-alkylguanine-DNA alkyltransferase. Effects of protein and DNA alkylation on complex stability. J Biol Chem. 2003;278:7973–7980. doi: 10.1074/jbc.M211854200. [DOI] [PubMed] [Google Scholar]
- 21.Srivenugopal KS, Yuan XH, Friedman HS, Ali-Osman F. Ubiquitination-dependent proteolysis of O6-methylguanine-DNA alkyltransferase in humanand murine tumor cells following inactivation with O6-benzylguanine or 1,3 bis(2-chloroethyl)-1-nitrosourea. Biochemistry. 1996;35:1328–1334. doi: 10.1021/bi9518205. [DOI] [PubMed] [Google Scholar]
- 22.Xu-Welliver M, Pegg AE. Degradation of the alkylated form of the DNA repair protein, O6-alkylguanine-DNA alkyltransferase. Carcinogenesis. 2002;23:823–830. doi: 10.1093/carcin/23.5.823. [DOI] [PubMed] [Google Scholar]
- 23.Liem LK, Wong CW, Lim A, Li BFL. Factors influencing the repair of the mutagenic lesion O6-methylguanine in DNA by human O6-methylguanine-DNA methyltransferase. J Mol Biol. 1993;231:950–959. doi: 10.1006/jmbi.1993.1344. [DOI] [PubMed] [Google Scholar]
- 24.Bender K, Federwisch M, Loggen U, Nehls P, Rajewsky MF. Binding and repair of O6-ethylguanine in double-stranded oligodeoxynucleotides by recombinant human O6-alkylguanine-DNA alkyltransferase do not exhibit significant dependence on sequence context. Nucl Acids Res. 1996;24:2087–2094. doi: 10.1093/nar/24.11.2087. [DOI] [PMC free article] [PubMed] [Google Scholar]
- 25.Luu KX, Kanugula S, Pegg AE, Pauly GT, Moschel RC. Repair of oligodeoxyribonucleotides by O6-alkylguanine-DNA alkyltransferase. Biochemistry. 2002;41:8689–8697. doi: 10.1021/bi025857i. [DOI] [PubMed] [Google Scholar]
- 26.Rasimas JJ, Kar SR, Pegg AE, Fried MG. Interactions Of Human O6-Alkylguanine-DNA Alkyltransferase (AGT) With Short Single-Stranded DNAs. J Biol Chem. 2007;282:3357–3366. doi: 10.1074/jbc.M608876200. [DOI] [PMC free article] [PubMed] [Google Scholar]
- 27.Chan CL, Wu Z, Ciardelli T, Eastman A, Bresnick E. Kinetic and DNA-binding properties of recombinant human O6-methylguanine-DNA methyltransferase. Arch Biochem Biophys. 1993;300:193–200. doi: 10.1006/abbi.1993.1027. [DOI] [PubMed] [Google Scholar]
- 28.Federwisch M, Hassiepen U, Bender K, Rajewsky MF, Wollmer A. Recombinant human O6-alkylguanine-DNA alkyltransferase induces conformational change in bound DNA. FEBS Lett. 1997;407:333–336. doi: 10.1016/s0014-5793(97)00370-0. [DOI] [PubMed] [Google Scholar]
- 29.Record MT, Anderson CF, Mossing M, Roe J-H. Ions as regulators of protein-nucleic acid interactions in vitro and in vivo. Adv Biophys. 1985;20:109–135. doi: 10.1016/0065-227x(85)90033-4. [DOI] [PubMed] [Google Scholar]
- 30.Record MT, Jr, Lohman TM, deHaseth PL. Ion Effects on Ligand-Nucleic Acid Interactions. J Mol Biol. 1976;107:145–158. doi: 10.1016/s0022-2836(76)80023-x. [DOI] [PubMed] [Google Scholar]
- 31.Davies GE, Stark GR. Use of Dimethyl Suberimidate, a Cross-Linking Reagent, in Studying the Subunit Structure of Oligomeric Proteins. Proc Nat Acad Sci USA. 1970;66:651–656. doi: 10.1073/pnas.66.3.651. [DOI] [PMC free article] [PubMed] [Google Scholar]
- 32.Wood CL, O’Dorisio MS. Covalent cross-linking of vasoactive intestinal polypeptide to its receptors on intact human lymphoblasts. J Biol Chem. 1985;260:1243–1247. [PubMed] [Google Scholar]
- 33.Fancy DA, Kodadek T. Chemistry for the analysis of protein-protein interactions: Rapid and efficient cross-linking triggered by long wavelength light. Proc Natl Acad Sci USA. 1999;96:6020–6024. doi: 10.1073/pnas.96.11.6020. [DOI] [PMC free article] [PubMed] [Google Scholar]
- 34.Tsodikov OV, Holbrook JA, Shkel IA, Record MT., Jr Analytic binding isotherms describing competitive interactions of a protein ligand with specific and nonspecific sites on the same DNA oligomer. Biophys J. 2001;81:1960–1969. doi: 10.1016/S0006-3495(01)75847-X. [DOI] [PMC free article] [PubMed] [Google Scholar]
- 35.Record MT, Anderson CF, Lohman TM. Thermodynamic analysis of ion effects on the binding and conformational equilibria of proteins and nucleic acids: the roles of ion association or release, screening, and ion effects on water activity. Q Rev Biophys. 1978;11:103–178. doi: 10.1017/s003358350000202x. [DOI] [PubMed] [Google Scholar]
- 36.Ha J-H, Capp MW, Hohenwalter MD, Baskerville M, Record MT., Jr Thermodynamic Stoichiometries of Participation of Water, Cations and Anions in Specific and Non-specific Binding of lac Repressor to DNA. J Mol Biol. 1992;228:252–264. doi: 10.1016/0022-2836(92)90504-d. [DOI] [PubMed] [Google Scholar]
- 37.Fried MG, Crothers DM. Equilibria and Kinetics of Lac Repressor-Operator Interactions by Polyacrylamide Gel Electrophoresis. Nucl Acids Res. 1981;9:6505–6525. doi: 10.1093/nar/9.23.6505. [DOI] [PMC free article] [PubMed] [Google Scholar]
- 38.Zeman SM, Crothers DM. Simultaneous measurement of binding constants and unwinding angles by gel electrophoresis. Methods Enzymol. 2001;340:51–68. doi: 10.1016/s0076-6879(01)40417-4. [DOI] [PubMed] [Google Scholar]
- 39.McGhee J, von Hippel PH. Theoretical aspects of DNA-protein interactions: co-operative and non-co-operative binding of large ligands to a one-dimensional homogeneous lattice. J Mol Biol. 1974;86:469–489. doi: 10.1016/0022-2836(74)90031-x. [DOI] [PubMed] [Google Scholar]
- 40.Lohman TM, Ferrari ME. Escherichia coli single-stranded DNA-binding protein: multiple DNA-binding modes and cooperativities. Annual Review of Biochemistry. 1994;63:527–570. doi: 10.1146/annurev.bi.63.070194.002523. [DOI] [PubMed] [Google Scholar]
- 41.Wold MS. Replication protein A: a heterotrimeric, single-stranded DNA-binding protein required for eukaryotic DNA metabolism. Annu Rev Biochem. 1997;66:61–92. doi: 10.1146/annurev.biochem.66.1.61. [DOI] [PubMed] [Google Scholar]
- 42.Luscombe NM, Austin SE, Berman HM, Thornton JM. An overview of the structures of protein-DNA complexes. Genome Biol. 2000;1:1–37. doi: 10.1186/gb-2000-1-1-reviews001. [DOI] [PMC free article] [PubMed] [Google Scholar]
- 43.Pingoud A, Fuxreiter M, Pingoud V, Wende W. Type II restriction endonucleases: structure and mechanism. Cell Mol Life Sci. 2005;62:685–707. doi: 10.1007/s00018-004-4513-1. [DOI] [PMC free article] [PubMed] [Google Scholar]
- 44.Benos PV, Lapedes AS, Stormo GD. Is there a code for protein-DNA recognition? Probab(ilistical)ly. BioEssays. 2002;24:466–475. doi: 10.1002/bies.10073. [DOI] [PubMed] [Google Scholar]
- 45.Jaryaram B, Jain T. The role of water in protein-DNA recognition. Annu Rev Biophys Biomol Struct. 2004;33:343–361. doi: 10.1146/annurev.biophys.33.110502.140414. [DOI] [PubMed] [Google Scholar]
- 46.Ahmad S, Gromiha MM, Sara iA. Analysis and prediction of DNA-binding proteins and their binding residues based on composition, sequence and structural information. Bioinformatics. 2004;20:477–486. doi: 10.1093/bioinformatics/btg432. [DOI] [PubMed] [Google Scholar]
- 47.Boeger H, Bushnell DA, Davis R, Griesenbeck J, Lorch Y, Strattan JS, Westover KD, Kornberg RD. Structural basis of eukaryotic gene transcription. FEBS Lett. 2005;579:899–903. doi: 10.1016/j.febslet.2004.11.027. [DOI] [PubMed] [Google Scholar]
- 48.Tabancay AP, Jr, Forsburg SL. Eukaryotic DNA replication in a chromatin context. Curr Top Dev Biol. 2006;76:129–184. doi: 10.1016/S0070-2153(06)76005-7. [DOI] [PubMed] [Google Scholar]
- 49.Laemmli UK. Cleavage of structural proteins during the assembly of the head of bacteriophage T4. Nature. 1970;227:680–685. doi: 10.1038/227680a0. [DOI] [PubMed] [Google Scholar]
- 50.Nesterenko MV, Tilley M, Upton SJ. A simple modification of Blum’s silver stain method allows for 30 minute detection of proteins in polyacrylamide gels. J Biochem Biophys Methods. 1994;28:239–242. doi: 10.1016/0165-022x(94)90020-5. [DOI] [PubMed] [Google Scholar]
- 51.Kanugula S, Goodtzova K, Edara S, Pegg AE. Alteration of arginine-128 to alanine abolishes the ability of human O6-alkylguanine-DNA alkyltransferase to repair methylated DNA but has no effect on its reaction with O6-benzylguanine. Biochemistry. 1995;34:7113–7119. doi: 10.1021/bi00021a024. [DOI] [PubMed] [Google Scholar]
- 52.Rasimas JJ, Kanugula S, Dalessio PM, Ropson IJ, Fried MG, Pegg AE. Effects of zinc occupancy on human O6-alkylguanine-DNA alkyltransferase. Biochemistry. 2003;42:980–990. doi: 10.1021/bi026970b. [DOI] [PubMed] [Google Scholar]
- 53.Roy R, Shiota S, Kennel SJ, Raha R, von Wronski M, Brent TP, Mitra S. A comparative study of the biochemical properties of human and mouse recombinant O6-methylguanine-DNA methyltransferases. Carcinogenesis. 1995;16:405–411. doi: 10.1093/carcin/16.2.405. [DOI] [PubMed] [Google Scholar]
- 54.Maxam A, Gilbert WS. A new method for sequencing DNA. Proc Natl Acad Sci U S A. 1977;74:560–565. doi: 10.1073/pnas.74.2.560. [DOI] [PMC free article] [PubMed] [Google Scholar]
- 55.Cantor CR, Tinoco I., Jr Absorption and optical rotatory dispersion of seven trinucleoside diphosphates. J Mol Biol. 1965;13:65–77. doi: 10.1016/s0022-2836(65)80080-8. [DOI] [PubMed] [Google Scholar]
- 56.Cavaluzzi MJ, Borer PN. Revised UV extinction coefficients for nucleoside-5’-monophosphates and unpaired DNA and RNA. Nucleic Acids Res. 2004;32:e13. doi: 10.1093/nar/gnh015. [DOI] [PMC free article] [PubMed] [Google Scholar]
- 57.Liu-Johnson HN, Gartenberg MR, Crothers DM. The DNA binding domain and bending angle of the E. coli CAP protein. Cell. 1986;47:995–1005. doi: 10.1016/0092-8674(86)90814-7. [DOI] [PubMed] [Google Scholar]
- 58.Peters K, Richards FM. Chemical Crosslinking: Reagents and Problems in Studies of Membrane Structure. Ann Rev Biochem. 1977;46:523–551. doi: 10.1146/annurev.bi.46.070177.002515. [DOI] [PubMed] [Google Scholar]
- 59.Cohn EJ, Edsall JT. Proteins, Amino Acids and Peptides as Ions and Dipolar Ions. In: Cohn EJ, Edsall JT, editors. Proteins, Amino Acids and Peptides as Ions and Dipolar Ions. Reinhold; New York: 1943. pp. 370–381.pp. 428–431. [Google Scholar]
- 60.Laue TM, Shah BD, Ridgeway TM, Pelletier SL. Computer-Aided Interpretation of Analytical Sedimentation Data For Proteins. In: Harding SE, Rowe AJ, Harding JC, editors. Analytical Ultracentrifugation in Biochemistry and Polymer Science. The Royal Society of Chemistry; Cambridge, England: 1992. pp. 90–125. [Google Scholar]
- 61.Cohen G, Eisenberg H. Deoxyribonucleate solutions: sedimentation in a density gradient, partial specific volumes, density and refractive density increments and preferential interactions. Biopolymers. 1968;6:1077–1100. doi: 10.1002/bip.1968.360060805. [DOI] [PubMed] [Google Scholar]
- 62.Jones TA, Zou JY, Cowan SW, Kjeldgaard M. Improved methods for building protein models in electron density maps and the location of errors in these models. Acta Crystallographica A. 1991;47:110–119. doi: 10.1107/s0108767390010224. [DOI] [PubMed] [Google Scholar]
- 63.Sayle RA, Milner-White EJ. RASMOL: Biomolecular Graphics for All. Trends Biochem Sci. 1995;20:374. doi: 10.1016/s0968-0004(00)89080-5. [DOI] [PubMed] [Google Scholar]
- 64.Connolly ML. Solvent-accessible surfaces of proteins and nucleic acids. Science. 1983:709–713. doi: 10.1126/science.6879170. [DOI] [PubMed] [Google Scholar]
- 65.Nicholls A, Sharp KA, Honig B. Protein folding and association: insights from the interfacial and thermodynamic properties of hydrocarbons. Proteins. 1991;11:281–296. doi: 10.1002/prot.340110407. [DOI] [PubMed] [Google Scholar]
- 66.Lima CD, Wang JC, Mondragon A. Three-dimensional structure of the 67K N-terminal fragment of E coli topoisomerase I. Nature. 1994;367:138–146. doi: 10.1038/367138a0. [DOI] [PubMed] [Google Scholar]
- 67.Fernandez-Beros M-E, Tse-Dinh Y-C. Vaccinia virus DNA topoisomerase I preferentially removes positive supercoils from DNA. FEBS Letters. 1996;384:265–268. doi: 10.1016/0014-5793(96)00317-1. [DOI] [PubMed] [Google Scholar]
- 68.Stivers JT, Harris TK, Mildvan AS. Vaccinia DNA topoisomerase I: Evidence supporting a free rotation mechanism for DNA supercoil relaxation. Biochemistry. 1997;36:5212–5222. doi: 10.1021/bi962880t. [DOI] [PubMed] [Google Scholar]
Associated Data
This section collects any data citations, data availability statements, or supplementary materials included in this article.