Abstract
Multiphoton microscopy has been added to the array of imaging techniques at the endstation for the Microbeam II cell irradiator at Columbia University’s Radiological Research Accelerator Facility (RARAF). This three-dimensional (3D), laser-scanning microscope functions through multiphoton excitation, providing an enhanced imaging routine during radiation experiments with tissuelike samples, such as small living animals and organisms. Studies at RARAF focus on radiation effects; hence, this multiphoton microscope was designed to observe postirradiation cellular dynamics. This multiphoton microscope was custom designed into an existing Nikon Eclipse E600-FN research fluorescence microscope on the irradiation platform. Design details and biology applications using this enhanced 3D-imaging technique at RARAF are reviewed.
INTRODUCTION
Multiphoton excitation can occur within a high photon density, where, through energy superposition, a combination of photons can act like one to induce an electronic transition in a sample. In the instance of two photon excitation, two photons that are spatially and temporally coincident can act as one photon with twice the energy (half the wavelength) to excite a fluorescent molecule to emit fluorescent signal which has a quadratic dependence on the incident light intensity.1 First theorized by Göppert-Mayer,2 multiphoton excitation is now achievable using focused photon densities from modern, high-powered, pulsed lasers. A multiphoton microscope is a laser-based, three-dimensional (3D), minimally damaging imaging tool with optical-sectioning capabilities. When compared to conventional confocal microscopy, multiphoton microscopy allows for greater penetration depth with reduced phototoxicity and photobleaching in the sample.1
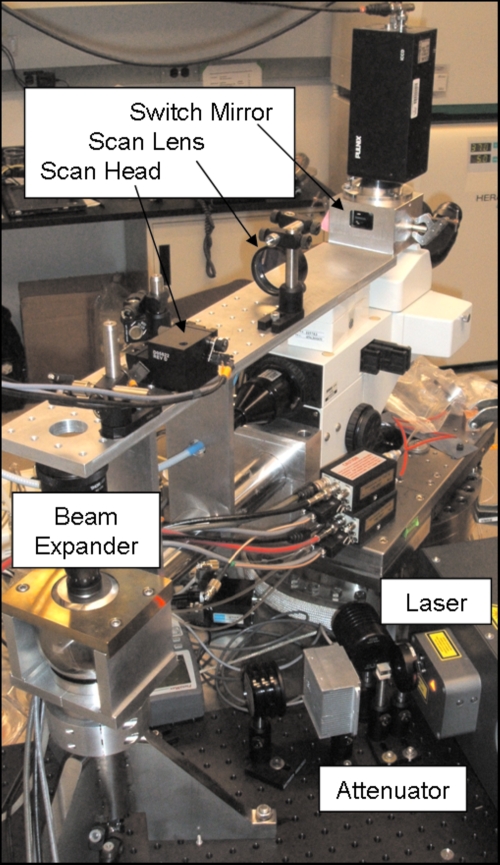
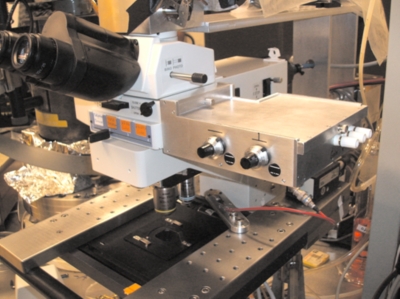
At the Radiological Research Accelerator Facility (RARAF),3 Columbia University, our facility users who study the ionizing radiation effects on mammalian cells are increasingly utilizing tissue samples and small organisms.4 To image their 3D samples, our users requested the multiphoton microscope that we developed and which is now fully integrated into the Microbeam II endstation5 at RARAF, see Fig. 1. A custom design for the multiphoton microscope was necessary, given the geometrical constraints of the pre-existing microscope fitted at the terminus of the vertical ion beamline. Intended for detecting and observing short-term molecular kinetics of radiation response in living tissue and in cell-culture samples, the multiphoton microscope at RARAF is the first of its kind to be assembled and implemented onto a microbeam cell-irradiation platform.
Figure 1.
Multiphoton microscope at RARAF for observing responses in cell cultures and in tissues after particle irradiation.
INSTRUMENTATION
The multiphoton microscope at RARAF was custom designed around a Nikon Eclipse E600-FN research fluorescence microscope equipped with a high-precision stage at the microbeam cell-imaging platform. This Nikon microscope was previously modified to function over a vertical ion beam by removing the base and mounting the top of the microscope to the end of a pivot arm, allowing the microscope to be placed either in an on-line position over the vertical ion beam or in an off-line position.
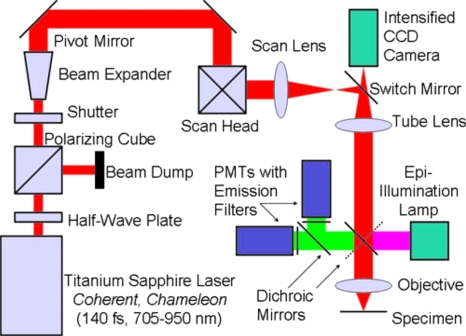
Along the incident laser beam path depicted in Fig. 2, a half-wave plate and polarized beam splitter act as an attenuator and are placed in the beam path to control the laser beam power. After passing a fast laser shutter, mirrors direct the laser beam up through the microscope pivot shaft, allowing the multiphoton microscope to operate in either on-line or off-line modes. Along the pivot-shaft axis, a Galilean beam expander increases the beam to a size that will fill the back aperture of the objective lens. The expanded beam is directed through a scan head and a scan lens, which are fixed to a platform above the microscope mount. The scan lens focuses the scanned laser beam to a conjugate image plane [a charge-coupled device (CCD) camera is placed at a corresponding image plane for use with standard fluorescent microscopy]. The incident light path continues through the side of a custom-built trinocular tube where the position of a retractable mirror selects between fluorescence and multiphoton microscopy uses. This mirror guides the laser vertically down through both the microscope tube lens and an objective lens to a focal point within a specimen, where multiphoton absorption preferentially occurs. The scanned laser’s focal plane establishes an optical section within the specimen. Returning along the collection pathway, light emitted from the specimen is selectively deflected by a series of dichroic mirrors to an array of photomultiplier tubes (PMTs). Images are constructed through correlating PMT signals with the scan head position. The optics path was designed to optimize laser delivery to the sample. The optical parameters are discussed below and were specified through optical considerations from the laser output to the throughput of the microscope objective.
Figure 2.
Diagram of the multiphoton microscope and optics path. See the text for more details.
Laser
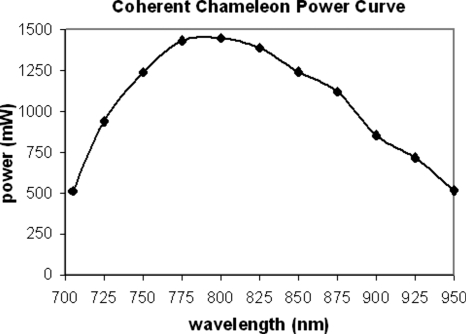
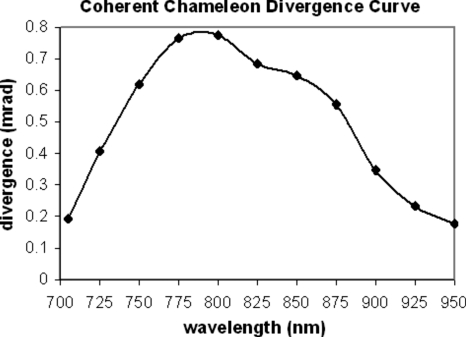
The excitation light source for the multiphoton microscope at RARAF is a Chameleon (Coherent Inc., Santa Clara, CA) tunable titanium:sapphire laser that provides 140 fs pulses at a 90 MHz repetition rate with a wavelength tuning range of 705–950 nm. Specifications for this laser mention the 1∕e2 beam diameter (1.2±0.2 mm) at the exit port and at the peak of the tuning curve but omit mentioning the beam divergence, an important quantity for designing an optics system. In order to have a better grasp of the laser’s divergence, beam spot size measurements were made at about 25 nm increments of wavelength along the 705–950 nm tuning curve. These measurements were made by measuring the 1∕e2 beam diameter at 12.5 cm from the laser and at 3 m from the laser. In both cases the 1∕e2 beam diameter was measured using a power meter and an adjustable iris. The power-tuning curve (Fig. 3) looks similar to the divergence curve (Fig. 4), suggesting that the divergence variation is related to laser power.
Figure 3.
Power measurements for the Chameleon (Coherent, Inc.) Ti:sapphire laser.
Figure 4.
Divergence measurements for the Chameleon (Coherent, Inc.) Ti:sapphire laser. The divergence measurements were made by comparing 1∕e2 beam diameters at 12.5 cm and at 3 m from the laser exit window. At 12.5 cm from the exit port, 1∕e2 beam diameters measured from 1.1 to 1.4 mm and increased linearly as a function of wavelength. At 3 m from the exit port, the 1∕e2 beam diameter was as large as 5.6 mm at the peak of the power-tuning curve.
Attenuator
Since the Chameleon Ti:sapphire laser operates exclusively at full power, an external attenuator was installed to regulate the laser power. The attenuator section, consisting of an achromatic half-wave plate (Thor Laboratories, Newton, NJ) with a broadband polarizing beamsplitter cube and a beam dump (CVI Laser, Albuquerque, NM), is located immediately after the laser exit window. The half-wave plate is mounted in a rotating holder, so the laser power is adjusted by rotating the half-wave plate. Downstream from the attenuator, an automated fast laser shutter (nmLaser, San Jose, CA) blanks the beam between image acquisitions. Since the optics table has a solid top, an added half-inch thick, 24×12 in.2 bench plate (Edmund Industrial Optics, Barrington, NJ) provides attachment holes for the attenuator optics and primary broadband Ti:sapphire laser turning mirrors. The microscope pivot-post is also mounted on top of this bench plate, with bolts passing through holes in the plate to anchor the microscope pivot-post to the optics top.
Beam expander
The geometry of the infinity optics in the microscope provides guidance to establishing the diameter of the incident laser beam and its scanning angle range, which will be addressed later in Sec. 2D. Following the specifications for a particular objective (Nikon CFI LU Epi Plan Fluor 50×, 0.80 NA, 1.0 mm WD ESD), the diameter of the back aperture of the lens is found to be 6.4 mm. Additionally, a diffraction-limited spot is achievable for a microscope objective that has its back aperture filled with a planar wave; with Gaussian beams, to approximate this condition, it is common that the 1∕e2 beam diameter overfills the back aperture by a factor of 2.6 With this scenario, the 1∕e2 laser beam diameter at the objective back aperture should be 12.8 mm.
Considering the variation in initial laser beam spot size and divergence, there is a corresponding distribution in the laser beam spot size at the objective back aperture. Optics transport calculations show that the minimum beam spot size at the objective back aperture is at a wavelength of 705 nm, and the expansion requirement for that 1∕e2 beam diameter is from 1.5 to 12.8 mm, or 8.4×. Exceeding the plane wave approximation mentioned above, a commercial 10× Galilean beam expander (Thor Laboratories, Newton, NJ) is used in conjunction with an adjustable iris to enlarge the beam to overfill the objective back aperture. A beam expander designed for the smallest beam spot size will function for the rest of the laser output spectrum. Wavelengths with greater divergence (see Fig. 4) are truncated, making the divergence distribution in the continuing beam more uniform.
Scanning head
The scanning head design for this multiphoton microscope incorporates two scanning mirrors and a scan lens, whose focal length (200 mm) matches the focal length of the microscope tube lens and establishes a one-to-one optical relationship. These components provide an array of laser focal points at a point along the optics path that is conjugate with the position of the CCD chip used for standard fluorescent microscopy. To optimize laser scanning, the scan lens is positioned with one focal point coinciding with the image plane of the microscope and the other focal point (or conjugate telecentric plane) matching the geometric midpoint between the scan mirror surfaces.6
With the goal of generating images that are similar in size as the CCD chip, the scanning angles can be found by taking the trigonometric relationships between the CCD chip dimensions to the focal length of the scan lens. The CCD dimensions can be found from the CCD specification 756×581 pixels. With a 40× objective lens and a microscope graticule, images were experimentally determined to view an area of 332.6×255.64 μm2 with the ratio of 0.44 pixels∕μm. Accounting for the 40× objective, the CCD dimensions are 13.3×10.23 mm2. From this it is found that the X-scanning angle=±arctan(13.33∕2∕200)=±1.9°, and the Y-scanning angle=±arctan(10.23∕2∕200)=±1.5°.
Scanning mirrors were selected based on the back aperture diameter of the objective lens (6.4 mm) and the desired scan rate’s fast trace (∼500 Hz). Galvanometer speed limits correlate with the mirror paddle size, and for the desired scan rate, industry specifications indicated that the mirror aperture be less than 8 mm in order to operate smoothly without overheating. A model 6215H series galvanometer scanner (Cambridge Technology, Inc., Cambridge, MA) with 6 mm mirror aperture, a step down from the 8 mm mirror aperture, was chosen as an ideal compromise between size and speed requirements. Even though the 6 mm mirror aperture size specification is less than the 6.4 mm diameter requirement, mechanical drawings for this mirror set allow for a maximum 7.0 mm aperture over the above-mentioned scanning angles. This model is rated for speeds at 1000 Hz over ±2°, with the understanding that occasional clearing moves should be incorporated to run the galvanometers through their range of motion to maintain proper lubrication. This choice of scan lens and the associated one-to-one optical relationship with the tube lens has an effect, in that, to maintain a diffraction-limited laser focal spot, the objective back aperture should not exceed the scanning mirror aperture.
Image acquisition
Image acquisition in laser-scanning microscopy relies on correlating the laser scan position with the photon yield from the sample. Scan positions translate to pixel position and detected light converts to pixel brightness. Light emitted from the specimen enters the microscope objective vertically and gets reflected laterally by a dichroic element mounted in an especially designed filter cube. This deflected signal then enters a custom-built, light-tight PMT housing shown in Fig. 5, where an additional dichroic mirror assigns signal toward one of the two H5783 PMTs, each followed by a C7319 preamplifier unit (Hamamatsu, Japan). An emission filter placed before each PMT designates the wavelength range of detected signal. For samples with multiple fluorophores, color images can be produced using appropriate dichroic mirrors and emission filters. Two potentiometers mounted to the side of the PMT housing provide independent signal gain control. With these two simultaneous imaging channels, experiments using Förster resonance energy transfer (FRET) to monitor postcell-irradiation dynamics are possible. FRET optics sets are on hand for the following transitions: BFP>GFP, CFP>YFP, and Alexa 488>Alexa 594.
Figure 5.
Light-tight attachment for fluorescent-signal detection using a dichroic mirror and PMTs.
ScanImage, a multiphoton microscope control software package developed by Karel Svoboda’s group at Cold Spring Harbor,7 is installed on the RARAF multiphoton microscope. This software automates the correlation between the laser scan position and the signal at the PMT to produce the images. Written in MATLAB®, ScanImage communicates with the multiphoton microscope hardware via an NI-6110 multifunction DAQ device (National Instruments, Austin, TX). This interface supplies the scanning-voltage waveforms and receives signal pulses from the PMT∕preamplifier units. ScanImage has an array of imaging modes, including averaging, looping, and acquiring z-stacks for 3D imaging. At RARAF, an LP-200 piezoactuated nanopositioner (Mad City Laboratories Inc., Madison, WI) works in conjunction with ScanImage to move vertically during z-stack image acquisition. After acquisition, images are typically postprocessed to add false coloring and to compile movies. Time-lapse movies can document dynamic change and movies of a z-sequence offer the observer a unique, informative excursion through a sample volume.
Point spread function
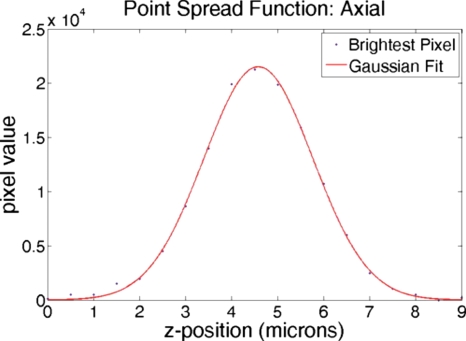
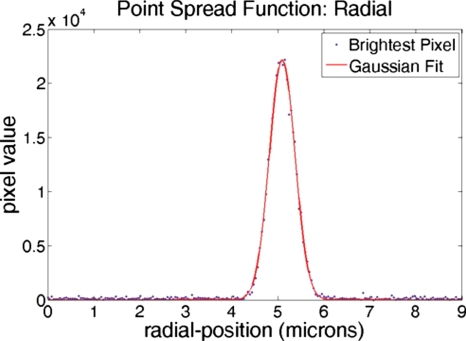
The point spread function (PSF) for a multiphoton microscope defines the volume of multiphoton excitation. This volume is an ellipsoid that represents the resolution of the microscope. The PSF can be measured by imaging a subresolution, pointlike fluorescent object.8 For measuring the PSF in our system, z-stacks were taken of individual 0.2 μm diameter blue fluorescent microspheres (B200, Microgenics Corporation) using a Nikon 60X NA1 water-dipping objective. Considering the maximum of the fluorescent microsphere absorption curve (∼388 nm), the incident wavelength required for two-photon excitation is double that value, or 780 nm. Axial and radial PSF data were obtained by extracting maximal pixel values and fitting them to the Gaussian: , where Ioz is the peak fluorescence intensity, zo is the centroid, σz is the intensity distribution width, and C is the background. The associated Gaussian fits are shown in Figs. 67. For these PSF measurements, the full widths at half maximum for the axial and radial Gaussian fits are 2.8 and 0.65 μm, respectively.
Figure 6.
Axial and PSF measurements. Gaussian fits to brightest pixel values from z-stack images of a 0.2 μm blue fluorescent bead taken using a 60× NA1 water-dipping objective.
Figure 7.
Radial PSF measurements. Gaussian fits to brightest pixel values from z-stack images of a 0.2 μm blue fluorescent bead taken using a 60× NA1 water-dipping objective.
APPLICATIONS
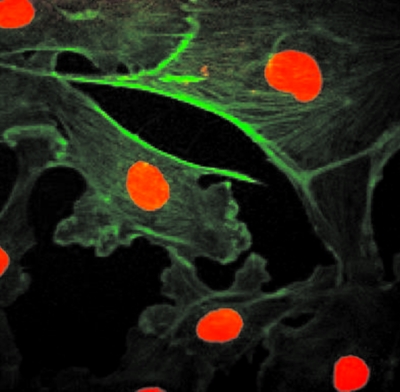
The image of bovine pulmonary artery endothelial cells in Fig. 8 is an example of a color image produced by wavelength-specific detection with the RARAF multiphoton microscope. The cells in this image were stained with BODIPY FL phallacidin to label the filamentous actin and were counterstained with DAPI to label the nuclei (shown in red). The objective lens used for imaging these cells was a Nikon CFI LU Epi Plan Fluor 50× objective, with 0.80 numerical aperture and 1.0 mm working distance. To develop this image, 20–30 single frames were acquired per color at a rate of 2 s∕frame. A routine written in MATLAB® subsequently summed and combined the images into a matrix for color display.
Figure 8.
Multiphoton microscope image of bovine pulmonary artery endothelial cells. Cell nuclei diameter ∼10 μm.
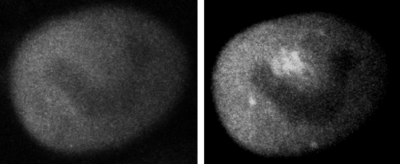
To validate our multiphoton microscope design integrated into our microbeam endstation, a microbeam irradiation experiment with a multiphoton observation was required. To meet this goal, the microbeam endstation was used to examine particle-induced single strand breaks in DNA within single cells. Aroumougame Asaithamby from David Chen’s group (University of Texas Southwestern, Dallas, TX) used Human HT1080 fibrosarcoma cells that had been transfected with a GFP-tagged XRCC1 DNA single-strand break repair protein. Figure 9 shows multiphoton images of one cell (a) before irradiation and (b) 4 min after exposure to 400 3Me V alpha particles at a predetermined position within a cell nucleus. 4 min after irradiation, the region of enhanced GFP signal corresponds to the XRCC1 focus and the irradiation position. In this example, ion-beam targeting was deliberate to avoid areas deficient in GFP (likely nucleoli). This clear response demonstrates that the multiphoton microscope was successful at recording high-resolution, time-lapse images of particle-induced focus formation within a single cell in real time. As an additional capability, projections of 3D z-stacks can quantify focus track volume to correlate with the amount of radiation (number of particles) delivered to the cell nucleus.
Figure 9.
Multiphoton microscopy images of an HT1080 cell nucleus with GFP-tagged XRCC1: (left) prior to irradiation and (right) 4 min after microbeam exposure of 400 3 MeV alpha particles.
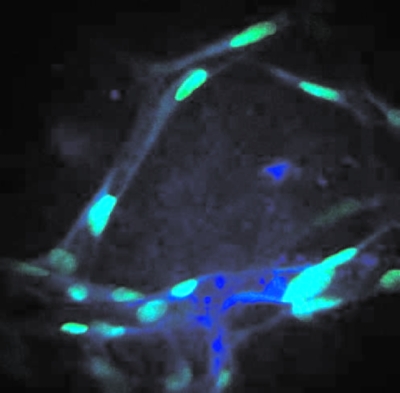
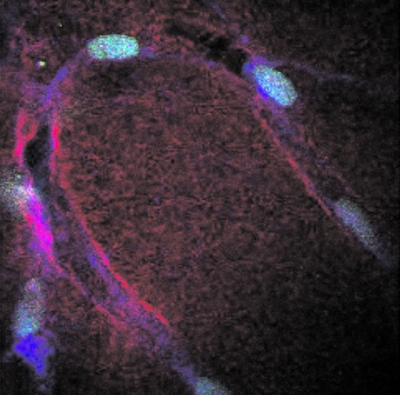
As radiation experiments move more toward tissue samples and small organisms, the ability to image optical sections within a 3D object was a driving factor in developing a multiphoton microscope into the endstation of the RARAF microbeam. Our user, Peter Grabham, brought human umbilical vein endothelial cells (HUVECs) to RARAF for optical sectioning. Derived from walls of the umbilical vein, HUVEC cells were seeded onto a collagen matrix, a disk approximately 200 μm thick by 4 mm in diameter. While these cells “tunneled” through the matrix, forming a 3D structure similar to the capillaries of the blood circulatory system, collagen was displaced by cell growth and was degraded by cell enzyme action. Series of optical sections through these tissue samples (z-stacks) were compiled as movies to effectively transport the observer through the tissue slices. Figures 1011 show views from these z-stack movies. In addition to using the nuclear stain YOYO-1, autofluorescence (AF) and second harmonic generation (SHG) are two nonstain imaging modes that were used to capture the cytoplasm and the collagen matrix. These two nonstain imaging modes require less sample preparation and allow structural imaging in 3D. With the capacity for optical sectioning, the multiphoton microscope at RARAF offers a mode for observing radiation-induced effects, such as foci formation, within tissue.
Figure 10.
Multiphoton microscopy images of HUVEC tissue samples. The cell nuclei are stained with YOYO-1. Cell nuclei imaged by YOYO-1 (green) and cell cytoplasm imaged with AF (blue).
Figure 11.
Multiphoton microscopy images of HUVEC tissue samples. The cell nuclei, are stained with YOYO-1. Cell nuclei imaged by YOYO-1 (green), cell cytoplasm imaged with AF (blue), and collagen imaged by SHG (red).
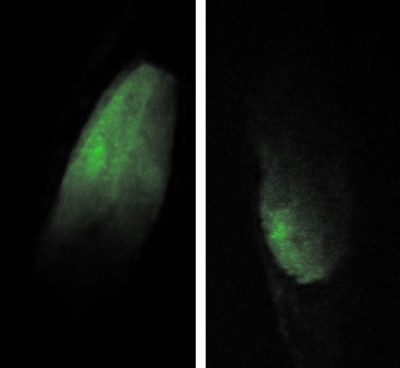
Researchers at RARAF are now irradiating small, living organisms, such as the C.elegans nematode. With its genome fully characterized in the literature, this model organism offers an ideal model for particle-irradiation effects. The worms undergo anesthesia prior to microbeam irradiation. Immobilization of the worms is important for multiphoton microscopy, where image exposure can range from 0.5 to 2 s. Figure 12 shows the cross-sectional multiphoton images of GFP expression in live C.elegans under anesthesia. Following the anesthesia period and the multiphoton imaging process, the C. elegans specimen regained normal motion and health. This is a testament to the nondamaging quality of multiphoton microscopy. By successfully imaging optical sections within a live, small organism, the microbeam-integrated multiphoton imaging system at RARAF offers users an array of imaging modes for 3D samples.
Figure 12.
Multiphoton microscope images of GFP expression in C. elegans: (left) pharynx and (right) tail.
RARAF facility users often apply red fluorescent protein (RFP) to their biological samples for imaging purposes. However, the original Ti:sapphire laser system on the multiphoton microscope cannot produce wavelengths needed for RFP excitation. Following up on user requests, RARAF recently purchased a laser upgrade, a Chameleon Ultra II (Coherent, Inc., Santa Clara, CA), which covers a wavelength range of 680–1080 nm. At the focal point of this new laser beam, the two photon process effectively provides (340–540 nm), which enables RFP excitation.
SUMMARY
Because our multiphoton microbeam is the first of its kind to be located on the endstation of a microbeam cell irradiator, RARAF is unique with its capacity to offer high-resolution, 3D imaging of bulk samples for radiobiological studies. Our multiphoton microscope is fully functional and has been successfully used for a variety of experiments, including those by our outside users.
ACKNOWLEDGMENTS
This work has been sponsored by NASA Grant No. NNJ05HI37G and a P41 grant supported by the National Institute of Biomedical Imaging and Bioengineering: NIBIB 5 P41 EB002033-13. We thank Aroumougame Asaithamby from David Chen’s group, University of Texas Southwestern, Dallas, TX, for providing HT1080 cells with GFP-tagged XRCC1.
References
- Denk W., Strickler J. H., and Webb W. W., Science 10.1126/science.2321027 248, 73 (1990). [DOI] [PubMed] [Google Scholar]
- Göppert-Mayer M., Ann. Phys. (Leipzig) 401, 273 (1931). [Google Scholar]
- Bigelow A. W., Brenner D. J., Garty G., and Randers-Pehrson G., IEEE Trans. Plasma Sci. 36, 1424 (2008). [Google Scholar]
- Belyakov O. V., Mitchell S. A., Parikh D., Randers-Pehrson G., Marino S. A., Amundson S. A., Geard C. R., and Brenner D. J., Proc. Natl. Acad. Sci. U.S.A. 102, 14203 (2005). [DOI] [PMC free article] [PubMed] [Google Scholar]
- Bigelow A. W., Ross G. J., Randers-Pehrson G., and Brenner D. J., Nucl. Instrum. Methods Phys. Res. B 231, 202 (2005). [Google Scholar]
- Stelzer E. K., in Handbook of Biological Confocal Microscopy, edited by Pawley J. B. (Plenum, New York, 1995), pp. 141–147. [Google Scholar]
- Pologruto T. A., Sabatini B. L., and Svoboda K., Biomed. Eng. Online 2, 13 (2003). [DOI] [PMC free article] [PubMed] [Google Scholar]
- Dong C. Y., Koenig K., and So P., J. Biomed. Opt. 10.1117/1.1578644 8, 450 (2003). [DOI] [PubMed] [Google Scholar]


