Abstract
Background and objectives: A bicarbonate dialysate acidified with citrate (CD) has been reported to have local anticoagulant effect. This study examines the effect of CD on dialysis efficiency, measured as eKt/Vurea, and predialysis concentrations of BUN, creatinine, phosphate, and β-2 microglobulin in chronic dialysis units.
Design, settings, participants, & measurements: Three outpatient chronic hemodialysis units with 142 patients were switched to CD for 6 mo. Using each patient's prior 6 mo on regular bicarbonate dialysate acidified by acetate (AD) as control, eKt/Vurea was compared with that of CD. Follow-up data for 7 mo after the study were collected from about one-half of the participants remaining on CD and the others returned to AD.
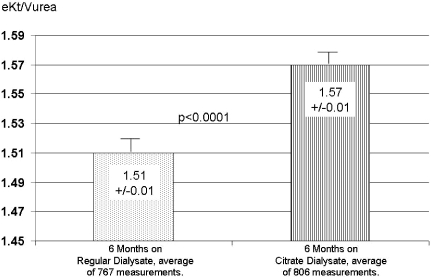
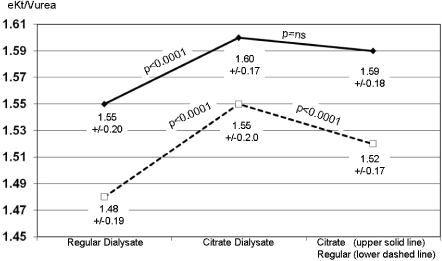
Results: eKt/Vurea, increased (P < 0.0001) from pre-CD value of 1.51 ± 0.01 to 1.57 ± 0.01 with CD. During CD use β-2 microglobulin levels declined (P = 0.0001) from 28.1 ± 10.0 to 25.9 ± 10.0. Similarly, the concentrations of BUN, creatinine, and phosphate also decreased on CD (P < 0.008). In the poststudy period, eKt/Vurea for the patients staying on CD remained unchanged at 1.60 ± 0.17 versus 1.59 ± 0.18 (P = NS), whereas in those returning to AD the eKt/Vurea decreased from 1.55 ± 0.20 to 1.52 ± 0.17 (P < 0.0001).
Conclusions: Data suggest that CD use is associated with increased solute removal.
Prevention of clotting is necessary for successful hemodialysis, and heparin is commonly used for this purpose. Even with the use of heparin, clotting of dialyzer fibers and membrane pores often occurs but generally goes unnoticed (1). This subtle clotting does not interfere with the completion of the treatment but reduces the efficiency of dialytic solute movements, thus lowering the efficiency of the treatment. Moreover, the stimulation of the clotting cascade also stimulates inflammatory proteins and may be partly responsible for dialysis-induced inflammatory response (2). Thus, reducing coagulation during dialysis is important to improve efficiency of dialysis and reduce the other negative consequences of clotting. Recent concerns about heparin purity, the possible shortage of heparin, and, more importantly, adverse events related to heparin (3) put a further emphasis on the importance of effective and safe anticoagulation for hemodialysis.
Citrate bicarbonate dialysate (CD)—dialysate acidified with citric rather than acetic acid (Citratsate, Advanced Renal Technologies, Bellevue, WA)—has been in use, principally in acute dialysis, for over 7 yr. In a previous study involving 105 patients dialyzing with reprocessed dialyzers, greater reuses and improvement in the dose of dialysis with CD was reported (1,4). However, this study involved reprocessed dialyzers and the duration of the study was relatively short. The practice of dialyzer reuse is declining, and the effect of CD with the new generation of single-use chronic dialysis dialyzers has not been previously reported. This study represents data from 6-mo use of CD with nonreuse high-flux dialyzers in a prospective controlled study in outpatient community-based dialysis units, and the results are presented here.
Materials and Methods
The study was approved by an institutional review board and was conducted in accordance with good clinical practice guidelines and ethical principles of the Helsinki Declaration. After obtaining informed consents, three New Mexico dialysis units (Espanola, Las Vegas, and Santa Fe) operated by Fresenius Medical Care switched all patients to CD (Citrasate).
Before the switch to CD, all of the clinics used regular bicarbonate dialysate acidified with acetic acid (Naturalyte or Granuflo, Fresenius Medical Care, Waltham, MA). Table 1 shows the compositions of the dialysates used. All patient treatments used Fresenius K machines (Fresenius Medical Care, Waltham, MA) and the CD, with 2.4 mEq citrate, was used by selecting the 4.0-mEq acetate (Naturalyte) setting on the machine.
Table 1.
Composition of dialysates
| Chemical | Naturalyte | Granuflo | Citrasate |
|---|---|---|---|
| Sodium | 137 | 137 | 137 |
| Calcium | 2.5 | 2.0 | 2.0 or 2.5 |
| Potassium | 1.0 or 3.0 | 2.0 | 1.0, 2.0 or 3.0 |
| Magnesium | 0.75 | 0.75 | 1.0 |
| Chloride | 104.25 or 106.25 | 104.75 | 104.0 to 106.5 |
| Acetate | 4.0 | 8.0 | 0.3 |
| Citrate | 0 | 0 | 2.4 |
| Dextrose | 200 | 200 | 200 |
| Bicarbonate | 37 | 37 | 37 |
All amounts shown are in mEq/L except dextrose, which is in g/L.
The study period consisted of 6 mo of regular bicarbonate dialysate use from April 2005 until October 2005, and then in October patients were switched to CD. This switch was scheduled to occur from October 2005 until April 2006; however, usage of CD actually was extended through May 2006, at the clinic's request, to synchronize with regularly scheduled quarterly blood testing. During the 12 mo of the study, routine medical and clinical practices remained unchanged. The heparin dose was not increased during the study period. Routine dialysis clinical decisions such as changing dialyzer type and blood or dialysate flow rates continued to be made using usual patient/treatment criteria. As a result of normal patient turnover, a study participation cutoff was established whereby each patient had to have at least 3 mo of treatments with regular bicarbonate dialysate and 3 mo with CD to be included in the final analysis.
A total of 166 patients consented to take part in the study; however, 14 patients did not have the requisite 3 mo of regular bicarbonate dialysate usage to be included, 4 patients died, 3 patients were transplanted, 2 patients switched to PD, and 1 patient transferred out of the clinic. Data were analyzed from 142 patients who completed the study. Patient profiles and dialysis treatment details for the study group are shown in Table 2.
Table 2.
Patient data and treatment variables for all patients
| Gender | Male 82, female 60 |
| Average age | 63 ± 14 yr |
| Vintage on dialysis at October 1, 2005 | 35 ± 28 months |
| Dialyzer type—all are “Optiflux” and number of participants(n) for each type | NR-160 (n = 46), NR-180 (n = 88),and NR-200 (n = 8) |
| Blood flow | 357 ± 35 ml/min |
| Dialysate flow | 588 ± 40 ml/min |
| Treatment duration | 4.0 ± 0.4 h |
All blood tests were routinely processed by Spectra Labs, Rockleigh, NJ. Predialysis samples for albumin, alkaline phosphatase, bicarbonate, calcium, chloride, phosphorous, potassium, creatinine, BUN, (pre- and postdialysis), aspartate aminotransferase/glutamate oxaloacetate transaminase, reticulocyte count, iron binding capacity, iron, sodium, glucose, magnesium, and total protein were routinely measured monthly; Serum aluminum, cholesterol, and triglycerides were measured quarterly; and C-reactive protein and β-2 microglobulin were measured at the start (October 2005) and end (May 2006) of CD use. Predialysis October values were at the end of the regular bicarbonate dialysate use, thus constituting baseline values for the study.
The dose of dialysis was measured by eKt/Vurea, which was calculated by using method described by Gotch and Keen (5). It should be noted that all blood for standard monthly laboratory tests was drawn consistently on a mid-week treatment following a standard protocol before initiation of dialysis. Accordingly, all predialysis blood values from October 2005 represent regular bicarbonate dialysate values because CD use did not start until after the blood was drawn. However, the eKt/Vurea measurement for October 2005 is a CD value because the postdialysis BUN was drawn after the first run with CD, thus representing the effect of CD. Postdialysis blood was drawn from the arterial line after clamping the arterial and venous needle lines with the blood pump stopped to ensure that only nonrecirculated blood was sampled.
During the 6-mo period using regular bicarbonate dialysate, the average eKt/Vurea for the entire patient group was 1.51 with a SD of ±0.20. The patients who had an average eKt/Vurea during this period of 1.31 or less (1 SD below mean) were labeled as “low achieved dose” (n = 19) and were suspected to have subtle clotting in the dialyzer. Data from this low achieved dose subgroup were analyzed separately in addition to being included with the whole group. Table 3 shows the patient profiles and treatment details for this low achieved dose subgroup.
Table 3.
Patient data and treatment variables for low achieved dose subgroup
| Gender | Male 18 and female 1 |
| Age | 54.5 ± 12.4 yr |
| Vintage on dialysis at October 1, 2005 | 25 ± 36 mo |
| Dialyzer type—all are “Optiflux” and number of participants (n) for each type | NR-160 (n = 2), NR-180, (n = 13) and NR-200 (n = 4) |
| Blood flow | 372.6 ± 27.2 ml/min |
| Dialysate flow | 597.4 ± 24.9 ml/min |
| Treatment duration | 4.1 ± 0.4 h |
Because the study used only historical control, we also collected eKt/Vurea data during the 7 mo after the study when two clinics (n = 73 patients) were switched back to regular bicarbonate dialysate from CD and one clinic continued their CD use.
Data are shown as mean ± SD unless SEM is indicated, and data comparisons were done using two-tailed t test.
Results
The switch from regular bicarbonate dialysate to CD was uneventful and made without any adjustments or modification to the machines. No dialysate-related problems occurred throughout the study period. Predictably, in following 142 patients over a period of 21 mo (including the 7 mo of follow-up), a few variations in dialysis treatment occurred. Specifically, upon compilation, a total of 49 participants had treatment changes that could have independently affected the dose of dialysis: 18 participants had dialyzer changes during the study, 25 participants had a significant blood flow increase during the CD period, and 6 participants had a significant dialysate flow increase during the CD period. We analyzed the eKt/Vurea data with and without these patients and the results are shown in Table 5.
Table 5.
eKt/V in whole group, those with changes in dialysis treatment, and those in whom dialysis treatment remained unchanged
| Group | Pre-CD | CD | P Value |
|---|---|---|---|
| Whole group (n = 142) | 1.51 ± 0.20 | 1.57 ± 0.19 | <0.0001 |
| Changea (n = 49) | 1.45 ± 0.22 | 1.54 ± 0.20 | <0.0001 |
| Nonchange (n = 93) | 1.55 ± 0.18 | 1.59 ± 0.18 | <0.0001 |
Changes include dialyzers (18), Qb increases (25), and Qd increases (6).
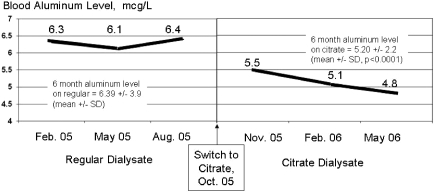
The overall eKt/Vurea measurements for each phase of the study are shown in Figure 1. The average predialysis BUN, creatinine, and phosphate values all declined significantly from the baseline values observed during the regular bicarbonate dialysate use, as shown in Table 4. Table 4 also presents the predialysis blood bicarbonate and aluminum levels. Bicarbonate concentration declined significantly during the CD period to the low end of the normal range, whereas serum aluminum, as seen in Figure 2, not only declined significantly on an average basis, it also continued to trend downward with continued CD use.
Figure 1.
The dose of dialysis measured as eKt/Vurea (6 mo average values, n = 142).
Table 4.
Predialysis concentrations
| Variablesa | Regular Bicarbonate Dialysate | CD | P Value |
|---|---|---|---|
| Entire participant population (n = 142)a | |||
| BUN | 48.4 ± 14.4 | 46.5 ± 14.8 | 0.007 |
| creatinine | 7.1 ± 2.1 | 6.8 ± 2.1 | 0.004 |
| phosphate | 5.6 ± 1.7 | 5.4 ± 1.6 | 0.006 |
| bicarbonate | 24.6 ± 3.4 | 22.9 ± 2.9 | <0.001 |
| aluminum | 6.39 ± 3.9 | 5.20 ± 2.2 | <0.001 |
| Participants with treatment changes in dialyzers (18), Qb increases (25), and Qd increases (6) (n = 49)b | |||
| BUN | 47.7 ± 13.7 | 45.4 ± 15.4 | 0.047 |
| creatinine | 7.2 ± 2.3 | 6.9 ± 2.2 | 0.091 |
| phosphate | 5.4 ± 1.6 | 5.2 ± 1.6 | 0.066 |
| bicarbonate | 24.0 ± 3.4 | 22.5 ± 3.2 | <0.001 |
| aluminum | 5.60 ± 2.00 | 4.90 ± 1.53 | 0.001 |
| Participants without treatment changes (n = 93) | |||
| BUN | 48.7 ± 14.8 | 47.2 ± 14.5 | 0.061 |
| creatinine | 7.1 ± 2.5 | 6.8 ± 2.0 | 0.020 |
| phosphate | 5.7 ± 1.7 | 5.5 ± 1.6 | 0.047 |
| bicarbonate | 24.9 ± 3.4 | 23.0 ± 2.7 | <0.001 |
| aluminum | 6.78 ± 4.50 | 5.36 ± 2.43 | <0.001 |
All values are mg/dl except aluminum, which is in μg/L.
Qb, blood flow rate; Qd, dialysis fluid flow rate.
Figure 2.
Mean predialysis blood aluminum levels with regular dialysate and CD (n = 142).
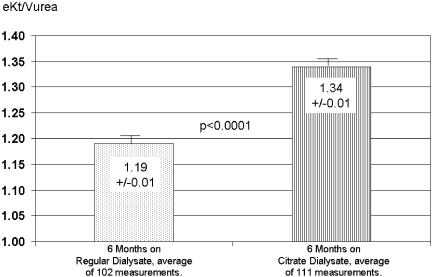
The predialysis β-2 microglobulin was measured at the end of regular bicarbonate dialysate use (October 2005) and end of CD use (May 2006) and showed a significant (P < 0.0001) decrease from 28.1 ± 10.0 to 25.9 ± 10.0 mg/L. The participants identified as the low achieved dose group also had a significant increase in eKt/Vurea from the regular bicarbonate dialysate period to the CD usage period (Figure 3).
Figure 3.
The dose of dialysis as eKt/Vurea in low achieved dose patients at baseline (regular dialysate use). Values are during regular dialysate and CD uses and are averages ± SEM (n = 19).
Poststudy follow-up eKt/Vurea data showed (Figure 4) that the group remaining on CD (n = 69) had no change in average eKt/V (1.60 ± 0.17 versus 1.59 ± 0.18, P = NS), whereas the group (n = 73) switching back from CD to regular bicarbonate dialysate had a significant (P < 0.0001) decrease from 1.55 ± 0.20 to 1.52 ± 0.17.
Figure 4.
Dialysis dose as eKt/Vurea in two groups of patients: those continuing on CD (solid line) for additional 7 mo (n = 69) and those switched back to regular dialysate (dashed line, n = 73). Values are mean ± SD.
Separate eKt/Vurea data for the group (n = 49) that had one or more treatment changes (dialyzer type, blood, or dialysate flow) are presented in Table 5. The total group, treatment change group, and the nonchange group all had a significant increase in eKt/Vurea when switched to CD.
Discussion
The results of this prospective study suggest that CD was associated with a significant increase in the delivered dose of dialysis as measured by equilibrated eKt/Vurea. It is interesting that even at baseline, when patients were on regular acetic acid acidified dialysate, the average eKt/Vurea of 1.51 was quite good; however, when the patients were switched to CD there was a further significant increase in the delivered dose of dialysis.
Because treatment changes did occur with 49 participants during the study period, it was necessary to evaluate the results separately in groups with and without these changes to evaluate the effect of these changes during the CD use. It was notable that the increase in eKt/Vurea in this subgroup (+0.09) was more than twice that of the group without any changes in the dialysis treatments (+0.04) (Table 5). This perhaps reflects the combined effect of treatment changes and CD. However, the group without any changes in dialytic variables still had a significant increase in eKt/Vurea, thus strongly suggesting that CD improved dialysis efficiency.
The significant decline in predialysis BUN, associated with an increase in eKt/Vurea, further supports our proposal that CD was associated with increased removal of urea and other solutes. The decline in predialysis concentrations of creatinine, phosphate, and β-2 microglobulin during the 6 mo of CD also supports this possibility. There are two possibilities for the observed decline in blood β-2 microglobulin level. First, it is possible that the presence of citrate prevents the clogging of the larger pores of the dialyzer membrane, leading to improved removal of β-2 microglobulin. Also, the complement and blood cell activation leading to increased cell turnover during dialysis is well known, and free calcium is needed for the complement activation. Thus, a second possibility is that by chelating the free calcium from the blood, the citrate prevents the blood cell activation, thereby reducing the β-2 microglobulin generation. More studies are needed to further clarify the possible mechanism.
The significant and continuing decline in serum aluminum during CD was an intriguing result. Aluminum has great affinity for citrate, forming a soluble complex; it is possible that this property makes aluminum more dialyzable, thus resulting in increased removal. More studies will need to be done to fully understand the relationship between CD and decreases in serum aluminum.
A local anticoagulation effect of citrate is one possible explanation for the observed results. During a dialysis treatment, despite the use of heparin, the dialyzer pores and fibers may become gradually blocked by clots and proteins, thus reducing the effective surface area of the dialyzer. Local delivery of citrate from the dialysate across the pores of the membrane may inhibit the clotting by locally chelating the ionized calcium while having a negligible effect on systemic ionized and total calcium. Thus, the maintenance of effective surface area throughout dialysis may likely be responsible for the observed results in the study presented here. It is interesting to note that in these studies, the subgroup with lower eKt/Vurea (at least 1 SD below the group mean) had the most benefit from the CD in terms of the delivered dialysis dose. Although the use of CD with its reported local anticoagulant properties increased the dose of dialysis for all patients, it was even more effective within this subgroup, suggesting that their poorer eKt/Vurea on regular bicarbonate dialysate may have been related to clotting.
Similarly, in a previous study (1), patients with lower numbers of reuses also had lower Kt/Vurea results compared with those with higher numbers of reuses. The use of CD in the former group was associated with an increase in number of reuses and also an increase in the delivered dose of dialysis. The authors proposed that this group was clotting dialyzers, thus explaining limited reuse and lower dose of dialysis.
Heparin has been known to activate platelets and white blood cells, whereas citrate does not (6). Furthermore, acetate in concentrations present in regular bicarbonate dialysate is also reported to be proinflammatory, increasing cellular activation (7). It is possible that the reduced clotting with CD may be the result of the significantly lower concentration of acetate in CD compared with regular bicarbonate dialysate (0.3 mEq versus 4.0 to 8.0 mEq), thus promoting less clotting stimulation. Similarly, a lower inflammatory response associated with CD may be partly responsible for the drop in predialysis β-2 microglobulin and phosphate levels. This study was not designed to address these issues, and future research should be directed to these important questions.
Heparin is associated with a range of adverse effects (3), with the most obvious being the increased risk of bleeding. Another common yet clinically less serious example is persistent postdialysis bleeding after needle removal from arteriovenous access. It is typically managed by reduction and manipulation of heparin administration during dialysis, and for some patients an optimal balance between anticoagulation sufficient for dialysis without excessive bleeding after needle removal is difficult to achieve despite best efforts. More serious bleeding complications can result in emergency room visits or hospitalization (e.g., persistent epistaxis or gastrointestinal bleeding). Heparin can also be associated with thrombosis, thrombocytopenia, and heparin-induced thrombocytopenia. Furthermore, heparin can be associated with hyperkalemia, fever, urticaria, and other hypersensitivity reactions. Hypoadrenalism and osteoporosis (with long-term use) can also be caused by heparin. These are an important set of considerations for nephrologists and hemodialysis patients.
CD is currently utilized almost exclusively in acute dialysis where the benefits of CD outweigh its higher cost (8). In chronic dialysis, its current use is largely limited to patients with special circumstances, including those with heparin-induced thrombocytopenia and those who, without CD, clot the dialysis circuit and have difficulty receiving adequate dialysis. The ability to complete dialysis in these patients with the use of CD further indirectly supports that CD has local anticoagulant effects. This study suggests that CD does provide multiple measurable benefits for the general chronic dialysis population and, if its cost could be decreased through mass production, would be a welcome and helpful alternative to regular acetic acid dialysate.
An inherent weakness of this study was the lack of a concurrent control group. Using historical control has the inherent weakness of any temporal changes that may occur during the study period that are independent of intervention. However we attempted to address this weakness issue by analyzing the data in those who continued on citrate and comparing their results with those who were switched back to regular dialysate, thus having a simultaneous control group. Future study design should include a randomized control design.
CD was safely used in a chronic dialysis setting with nonreuse dialyzers, and the data suggest that its use was associated with significant increase in eKt/Vurea. The significant decline is predialysis concentrations of urea, creatinine, phosphorous, and β-2 microglobulin concentrations further suggest that with the CD there is increased solute removal with dialysis. The very significant increase in eKt/Vurea with CD in the group of patients with the lowest eKt/V urea on regular dialysate suggests that CD may reduce clotting of dialyzer pores and fibers, thus improving its efficiency.
Disclosures
R.J.K., R.C., and S.A. have equity interests in Advanced Renal Technologies.
Acknowledgments
We are grateful to Fresenius Medical Care North America for their support of the study. Parts of the results were presented as an abstract at the 39th Annual Meeting of the American Society of Nephrology, 2006.
Footnotes
Published online ahead of print. Publication date available at www.cjasn.org.
See related editorial, “Dialysate … Ho-Hum!” on pages 1403–1404.
References
- 1.Ahmad S, Callan R, Cole JJ, Blagg CR: Increased dialyzer reuse with citrate bicarbonate dialysate. Hemodial Int 9: 264–267, 2005 [DOI] [PubMed] [Google Scholar]
- 2.Pawlak K, Naumnik B, Brzosko S, Pawlak D, Mysilieiec M: Oxidative stress—A link between endothelial injury, coagulation activation, and atherosclerosis in haemodialysis patients. Am J Nephrol 24: 154–161, 2004 [DOI] [PubMed] [Google Scholar]
- 3.Ahmad S: Anticoagulation. In: Manual of Clinical Dialysis, 2nd ed., edited by Ahmad S.New York, Springer, 2009: 29–36 [Google Scholar]
- 4.Ahmad S, Callan R, Cole JJ, Blagg CR: Dialysate made from dry chemicals using citric acid increases dialysis dose. Am J Kidney Dis 35: 493–499, 2000 [DOI] [PubMed] [Google Scholar]
- 5.Gotch FA, Keen M: Kinetic modeling in hemodialysis. In: Clinical Dialysis, 4th ed., edited by Nissenson AR, Fine RA.New York, McGraw Hill, 2005: 153–203 [Google Scholar]
- 6.Gritters M, Grooteman MP, Schoorl M, Schoorl M, Bartels P, Scheffer PG, Teerlink T, Schalkwijk CG, Spreeuwenberg M, Nube MJ: Citrate anticoagulation abolishes degranulation of polymorphonuclear cells and platelets and reduces oxidative stress during haemodialysis. Nephrol Dial Transplant 21: 153–159, 2006 [DOI] [PubMed] [Google Scholar]
- 7.Todeschini M, Macconi D, Fernandez NG, Ghilardi M, Anabaya A, Binda E, Morigi M, Cattaneo D, Perticucci E, Remuzzi G, Noris M: Effect of acetate-free biofiltration and bicarbonate hemodialysis on neutrophil activation, Am J Kidney Dis 40: 783–793, 2002 [DOI] [PubMed] [Google Scholar]
- 8.Tu A, Ahmad S: Heparin-free hemodialysis with citrate-containing dialysate in intensive care patients. Dial Transplant 29: 620–626, 2000 [Google Scholar]


