Abstract
Complex radiation therapy techniques require dosimetric verification of treatment planning and delivery. The authors investigated a liquid scintillator (LS) system for application for real-time high-energy photon beam dosimetry. The system was comprised of a transparent acrylic tank filled with liquid scintillating material, an opaque outer tank, and a CCD camera. A series of images was acquired when the tank with liquid scintillator was irradiated with a 6 MV photon beam, and the light data measured with the CCD camera were filtered to correct for scattering of the optical light inside the liquid scintillator. Depth-dose and lateral profiles as well as two-dimensional (2D) dose distributions were found to agree with results from the treatment planning system. Further, the corrected light output was found to be linear with dose, dose rate independent, and is robust for single or multiple acquisitions. The short time needed for image acquisition and processing could make this system ideal for fast verification of the beam characteristics of the treatment machine. This new detector system shows a potential usefulness of the LS for 2D QA.
Keywords: liquid scintillator, CCD camera, dosimetry, photon beams
INTRODUCTION
Modern radiation therapy such as intensity-modulated radiation therapy (IMRT) using a linear accelerator requires dosimetric verification of the treatment plan and treatment delivery. Different detector systems have been employed for patient-specific quality assurance (QA). The most commonly used method is based on radiographic film dosimetry,1 where the film is placed inside a phantom to obtain a two-dimensional (2D) dose distribution. A similar technique employs Gafchromic® films.2 Its low effective atomic number provides a better energy dependence compared to radiographic films; however, this also leads to a reduced sensitivity to radiation and thus to a smaller digitalization range. Precise measurements are more time consuming and the uniformity of the film is lower than radiographic films.3 Another high-resolution dosimeter is based on polymer gel4 and uses either an optical or MRI scanner for the readout. However, this method can be time consuming and the dosimetric properties of the gel are yet to be established. Thus, it may not be efficient for clinical routine QA.
Other possible approaches are based on the use of scintillating materials; Boon et al.5 used a 2D scintillation screen located distally behind a slab of water equivalent material and measured the relative amount of light detected by the CCD camera. Petric et al.6 used a similar experimental setup and applied a deconvolution of the 2D light signal to obtain a 2D dose distribution. However both detector designs are limited to a single 2D imaging plane perpendicular to the direction of the beam and thus no depth dose distribution can be directly measured. Recently, Frelin et al.7 presented a new 2D scintillation dosimeter for IMRT QA, which consisted of a plastic scintillating sheet placed inside a transparent polystyrene phantom, and investigated methods to correct for Čerenkov radiation. Kirov et al.8 investigated the use of liquid scintillators for brachytherapy applications and, therefore, studied the dosimetric properties of different scintillating solutions with the aim of developing water equivalent dosimeter media at the lower energies that are suitable for use with the most commonly used radioactive sources. This idea was further developed and applied successfully to a small 3D dosimetry system, which was optimized for brachytherapy application to eye plaques.9 The authors concluded that this method would require further investigations for larger liquid scintillator (LS) volumes.
We present a new method of measuring dose in therapeutic high-energy photon beams using a much larger LS detector system. Our detector system differs from a two-dimensional plastic scintillation layer in the way the signal is generated: In our system we have collected data from signals generated in a 3D volume instead of a 2D plane. We have studied this system as a QA tool for fast, accurate, and high-resolution dosimetry. The aim of this preliminary study was to show that LS have the potential of providing real-time dosimetric information in 2D with the eventual goal of measuring dose in a 3D volume.
MATERIALS AND METHODS
Detector system
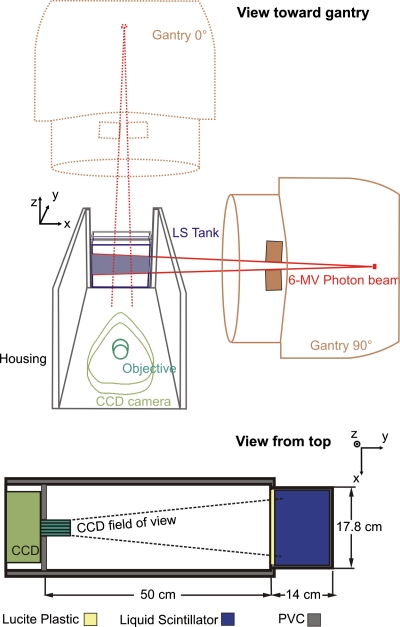
The detector system consisted of a light shielded, LS-filled acrylic tank (outer dimensions: 17.8×14.0×12.7 cm3; 3 mm wall thickness), a camera objective and a high sensitivity electron-multiplying CCD camera (Luca EM, Andor Technology, South Windsor, CT) and is shown in Fig. 1. A housing box, made of dark PVC, enclosed all components and insulated the inner compartment from ambient light. A regular 25 mm camera objective (JML Optical Industries, Inc., Rochester, NY) with adjustable focal length and variable aperture (F number=0.95–22) was mounted onto the camera’s front to focus the acquired image to the CCD chip. The chip had a resolution of 658×496 pixels and a color depth of 14 bits, thus providing 16 383 grayscale levels and allowing for a large dynamic range for image processing. The distance between the tip of the camera objective and the center of the tank was 55 cm, which resulted in a pixel size of 0.22 mm or a field of view (FOV) of 14.8×11.2 cm2, which was slightly smaller than the size of the tank. The setup of our detector system differs from a conventional portal imaging system in that a lateral beam view can be acquired and thus percent depth doses (PDDs) as well as lateral dose distributions can be measured at the same time. To avoid any systematic deviations, a background image was taken before each series of measurements and subtracted from the acquired images. Finally, the images were filtered using a median filter with a size of 7×7 pixels to eliminate radiation induced artifacts, which arise from scatter radiation and leakage of the treatment head that interact with the CCD chip of the camera.
Figure 1.
Sketch of the measurement setup and coordinate system. The gantry rotation angle here is 90° (the dotted lines depict a gantry angle of 0°). The acquired 2D image is a projection along the y direction of the light emitted from the scintillator (see text for exact dimensions).
The commercially available LS material, BC-531 (Saint-Gobain, Newbury, OH), was used in this system. To determine the dosimetric characteristics of this LS material, a CT scan was performed and the CT number was obtained. The measured CT number was then converted into a density value using our institutional calibration table. This transformation resulted in a density of 0.86 g∕cm3, which would be used for calculations by the treatment planning system. Since this value is very close to the physical density given by the manufacturer of 0.87 g∕cm3, no conversion or density over-rides were necessary after the LS phantom scanned, and thus the obtained CT could be used immediately without applying any corrections.
The detector system was irradiated with 6 MV photons from a Varian Clinac 21EX (Palo Alto, CA) linear accelerator under standard conditions, i.e., SSD=100 cm, and gantry angles of 0° and 90°. Images were acquired for different field sizes, dose rates, and camera light enhancement modes. The measured light signals were compared to the dose profiles of the treatment machine provided by the commissioned treatment planning system (PINNACLE, Version 8.1w, Philips Medical Systems, Fitchburg, WI).
Image processing and dose reconstruction
The goal of image processing is to remove background noise and to convert the acquired light signal to dose. One basic assumption is that the dose is proportional to the scintillation light, and this is verified below. Under ionizing radiation, the LS isotropically emits visible blue light with a peak wavelength of 425 nm. Despite the low optical attenuation of the LS (which is equal to 3.5 m−1 and corresponds to a 2% light absorption over a 7 cm path length of the LS), the emitted light may scatter within the liquid and can be reflected at the walls of the acrylic tank. Furthermore, Čerenkov radiation10 is produced by high energy delta rays during MV photon beam irradiation. Both processes produce additional background, leading to a blurring of the dose distribution. Thus, the measured light signal from the CCD camera may not be directly proportional to the absorbed dose. The image forming process can be expressed as a convolution of the original image o with a blurring function h resulting in the measured image p,
| (1) |
To reconstruct the original 2D dose distribution with a size of M×N from the measured light image, a deconvolution algorithm was applied. In this work a Wiener filter algorithm was used, which is given in the frequency domain by the expression
| (2) |
An inverse Fourier transform was applied to O(u,v) to obtain o(i,j). The term contained inside the brackets in Eq. 2 is commonly referred to as the least square error filter.11 The filter depends on the image degrading function H(u,v) and a specific constant K. The degrading function or image disturbance function h must be known or approximated. We assumed a linear combination of a 2D Lorentzian function l and a 2D Gaussian function g using a constant weighting factor c,
| (3) |
with
| (4) |
and
| (5) |
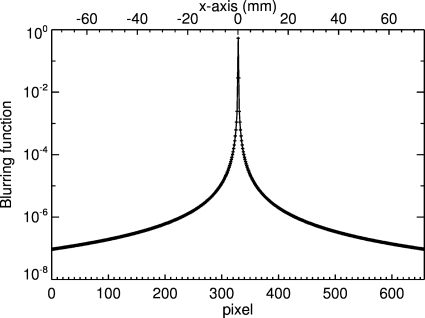
where i and j represent the pixel indices. This type of function was used in a previous LS study for a different configuration.9 Figure 2 shows the blurring function using the following constant parameters: c=5.5, σ=0.4, and γ=0.35. The parameters were first manually optimized to match the data from the treatment planning system with the measured deconvolved light signal for a 5×2 cm2 field. We then verified the choice of these parameters for this field using an iterative algorithm. For this, we defined a cost function
| (6) |
where d(i,j) is the dose from the treatment planning system. We systematically explored the phase space of these three parameters around the initial values and found that f was stable. These parameters are specific for this detector system and were used for deconvolution of all measured light images. Note that the disturbance function in Fig. 2 is given in position space and must be transformed into frequency space for use in Eq. 2.
Figure 2.
One-dimensional plot of the blurring function h(i,N∕2) along the x axis.
Experiments
Dose linearity
An ideal detector system should respond linearly to the absorbed dose deposited within the detector. In order to verify this for our dosimetry system, we measured the light signal of the LS produced by a 6 MV photon beam. To keep the background noise constant, we used a constant acquisition time of 25 s, a dose rate of 600 MU∕min, and a field size of 4×4 cm2.
For data evaluation we placed a region of interest (ROI) at the area containing maximum signal within the 2D CCD image and calculated the mean value of these pixels. In this experiment, a ROI size of 10(x)×5(y) pixels was chosen because less variation in pixel value was expected along the x direction (abscissa) than in the y direction (ordinate of the 2D CCD image), with a steeper dose gradient.
Interruptions during delivery of multiple segments or fields
This test was performed to evaluate whether discontinuous irradiation, i.e., the photon beam being stopped for a few seconds during image acquisition, affects the measured CCD camera signal. Such beam interruptions occur in IMRT treatment with step-and-shoot techniques. If this detector is to be used for patient-specific QA, one would wish to keep acquiring data until the entire field is delivered for each beam angle. Alternatively, one might want to measure the dose deposition over an entire treatment, allowing for interruptions while changing the gantry angles and field sizes. In this experiment, the scintillator was irradiated to a total dose of 1 Gy and the CCD camera acquisition time was set to a constant value of 25 s. We stopped the beam up to three times and compared the average light signal for different ROI positions representing the maximum light signal at 1.8 cm, and 5.4 and 9.7 cm depths within the LS.
Dose rate dependence
The dose rate dependence was tested using a long enough acquisition time of 17 s to deliver a constant dose of 25 cGy for dose rates ranging from 100 to 600 MU∕min. This relatively small dose was chosen to keep the acquisition time comparable to other measurements. The field size was 5×5 cm2.
Lateral profile dependence on the field size
As mentioned earlier, the CCD camera measures a projection of the emitted light; therefore, changing the field size in the x and y directions results in different acquired images. In order to validate the lateral profiles, two series of measurements were performed in which the field size was varied both parallel and perpendicular to the field of view of the CCD camera. In the first measurement series, we varied the field size in the x direction and kept the field size for the y direction constant at 2 cm. In the second measurement series, the x direction was set to 2 cm and the field size in the y direction was varied. The aperture of the objective lens for this set of measurements was set at F=8 to allow more light to reach the CCD chip because of the rather low dose of 25 cGy used in this experiment. The dose rate was 400 MU∕min and the acquisition time was 5 s. A set of profiles was then compared to the profiles obtained from the treatment planning system.
Percent depth dose analysis
Analysis of the PDD is a very reliable way to validate the performance of the detector system because the dose deposition falls off in an exponential slope after the dose maximum. The gantry was rotated to 90°, and thus the beam entered through the lateral wall of the acrylic tank, which provided a 3.6 cm longer measurement area along the beam axis compared to a 0° beam for our fixed CCD camera setup. The field size was set to 5×5 cm2 and 28 MUs were delivered. Furthermore, since the size of the imaging area was smaller than the size of the LS tank, the camera was shifted laterally by a few centimeters to image the build-up part of the PDD curve.
Verification of the dose distribution of a four-field-box plan
In order to validate the delivery of a dose distribution for multiple beam angles, one simple four-field-box type treatment plan was created and delivered. The LS tank was first simulated with a CT scanner (GE Lightspeed, GE Healthcare Technologies, Waukesha, WI), and then the data were transferred to the treatment planning system. For this experiment, the LS detector was irradiated from four cardinal beam angles (0°, 90°, 180°, and 270°). The field size was 5×5 cm2. The beams were equally weighed at the isocenter, resulting in a delivery of 28 MUs for the AP∕PA beams and 25 MUs for the lateral beams for a total dose of 90 cGy. During irradiation, each field was separately imaged. Analogous to Sec. 2C5, we applied the adapted light background subtraction correction to each of the four images. The final light signal distribution was the sum of these four images and was compared to the dose distribution obtained from the treatment planning system.
RESULTS
Light dose response
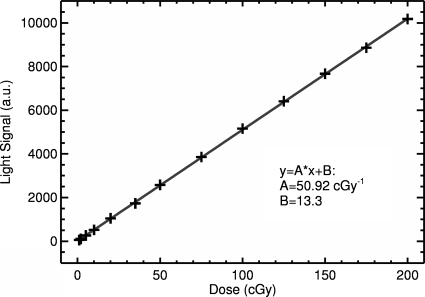
Figure 3 shows the mean pixel value for the maximum dose within the 2D image as a function of delivered dose. Linear regression analysis showed a strong linear relationship between increasing dose and the measured light signal, with a slope of 50.9 cGy−1. The slope of the curve depends on many factors, e.g., lens aperture size (in this experiment set to F=16), distance from the CCD camera to the LS tank, and the CCD camera acquisition parameters including acquisition time and electron multiplication factor. Thus, the final detector system would need to be calibrated according to the particular settings if it is to be used as an absolute dosimeter.
Figure 3.
Measured light-dose response (symbols). The solid line depicts a linear curve fit with a correlation coefficient of R=0.999 95.
Irradiation interruptions
Table 1 shows the results for the light signal output as a function of the number of beam interruptions. We found that the number of beam interruptions did not affect the measured light signal, nor was there a clear trend between the number of interruptions and the observed signal. The relative standard deviation was less than 0.5% in the maximum dose region and less than 1% in the distal fall-off region (about 74% of the maximum dose).
Table 1.
Light signal at different depths within the LS depending on the number of interruptions.
| No. of interruptions | CCD signal (a.u.) | ||
|---|---|---|---|
| ROI at 1.8 cm | ROI at 5.4 cm | ROI at 9.7 cm | |
| 0 | 5085 | 4555 | 3735 |
| 1 | 5130 | 4559 | 3787 |
| 2 | 5099 | 4508 | 3816 |
| 3 | 5124 | 4542 | 3749 |
| Mean | 5109 | 4541 | 3771 |
| Relative standard deviation (%) | 0.4 | 0.5 | 1.0 |
Dose rate dependence
The dose rate dependence is shown in Table 2. For dose rates ranging from 100 to 600 MU∕min, the variation in light signal output was less than 0.3%, and there was no trend with increasing dose rate. The rather small variation is mainly due to fluctuations in the actual dose delivered by the accelerator.
Table 2.
Light signal dose rate independence for a fixed dose of 25 cGy.
| Dose rate (MU∕min) | CCD signal (a.u.) |
|---|---|
| 100 | 6843 |
| 200 | 6835 |
| 300 | 6806 |
| 400 | 6842 |
| 500 | 6863 |
| 600 | 6820 |
| Average | 6835 |
| Standard deviation | 20 |
Lateral profile dependence on the field size
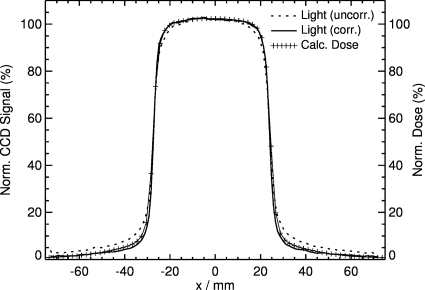
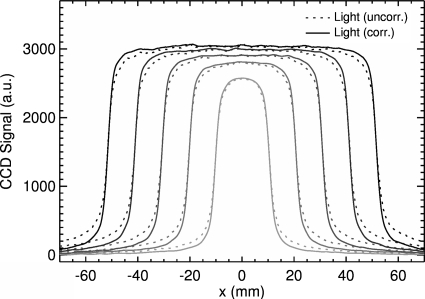
The light output for a 5×2 cm2 field is shown in Fig. 4. Comparison between the uncorrected and corrected signals to the dose distribution obtained from the treatment planning system shows that the shape and the field width of the uncorrected signal are, in general, in good agreement with the dose profile except at the shoulder and tail. Correction of the light signal using the Wiener filter improves agreement, resulting in a maximum deviation of less than 1%. Profiles for various field sizes in the x dimension (in-plane direction) are shown in Fig. 5. Comparison between the uncorrected and corrected light signals shows the same trend, in which the height of the shoulder increases and the gradient of the tail decreases for all field sizes. There is an expected increase in the maximum signal output with increasing field size due to increased output of the treatment machine with increasing field size. The integral of each profile is also linear with the irradiated area. The profiles are very symmetric with respect to the central axis; the measured width is also proportional to the set field size of the linear accelerator.
Figure 4.
Comparison between uncorrected and corrected light signals and dose profiles obtained from the treatment planning system for a 5×2 cm2 field.
Figure 5.
Lateral profiles for different field sizes (2×2, 4×2, 6×2, 8×2, and 10×2 cm2) in the x direction, measured at the depth of maximum dose and averaged over 5 pixels in the y direction.
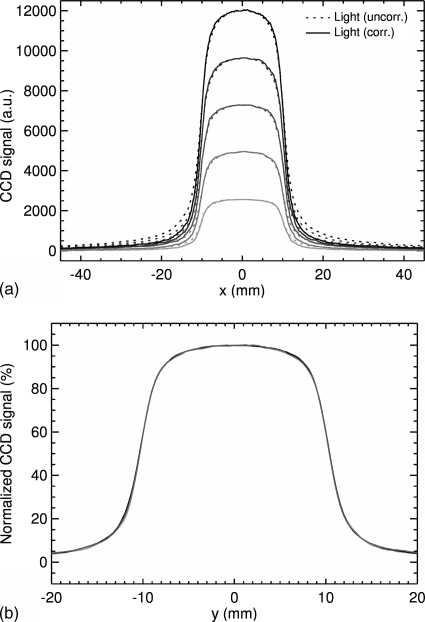
Increasing the field size in the y (cross-plane) direction results in profiles whose maxima increase linearly with the field size [Fig. 6a]. This expected result is due to the increasing irradiated area. Therefore increasing the irradiated volume of the LS will result in an increased light production in the LS. The tails in the dose fall-off region also increase with increasing field size in the y direction. However, as seen in Fig. 6b, normalization of the light signal with respect to the maximum of the profile results in a fairly constant output over a wide range of field sizes.
Figure 6.
Lateral profiles along the x direction: (a) dependence of the light signal on the size of the field along the y (cross-plane) direction for field sizes (2×2, 2×4, 2×6, 2×8, and 2×10 cm2). (b) Normalized output for 2×2, 2×6, and 2×10 cm.
Percent depth dose analysis
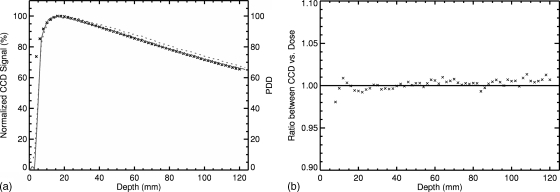
Results for the percent depth dose are shown in Fig. 7. The uncorrected light signal shows an overestimation in the delivered dose with increasing depth. Correction of the light signal using the Wiener filter, however, leads to a PDD that is in agreement with results from the treatment planning system. Minor deviation in the build-up region occurs due to tank∕LS interface issues. First, the acrylic tank has a 3 mm wall thickness, and no light is produced in this region. Second, because no light is produced in the tank wall, it does not spread isotropically into the LS, which is an assumption used in the blurring function, h(i,j). This leads to a steeper gradient in the light signal compared to the dose.
Figure 7.
PDD inside the LS material for a 5×5 cm2 field. The uncorrected measured light signal is shown as the dotted curve, while the solid line represents the corrected measured light signal by the CCD camera. The dose distribution obtained from the treatment planning system is plotted as cross hatches. Left: PDD from 0 to 120 mm. Right: Ratio between CCD signal and calculated dose.
Verification of the dose distribution of a four-field-box plan
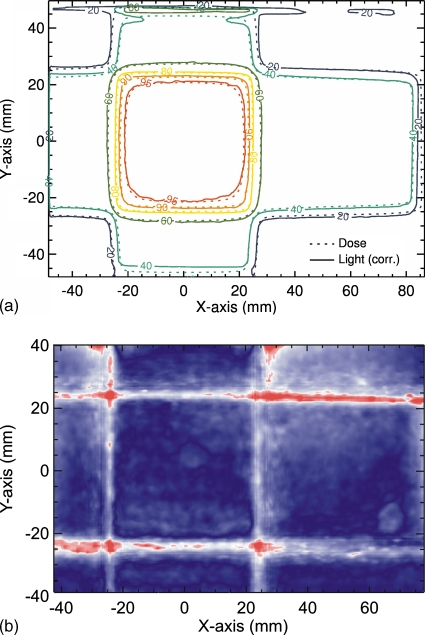
Comparison of the summation of the four corrected light fields with the dose distribution calculated with the treatment planning system shows excellent agreement throughout both the high and low dose regions [Fig. 8a]. A gamma index (3%, 3 mm) was calculated and an agreement for 96% was found for pixels within the central part of the 2D distributions [see Fig. 8b]. The exception occurs at the top surface of the LS, which has an interface with air. This is due to the total internal reflection, which is caused by scattered light that intersects the LS∕air boundary surface by angles larger than the critical angle for this interface. The good agreement shows again that measurement of the composite dose distribution from multiple field irradiations is possible, as was demonstrated above. This example also demonstrates the utility of the LS system as a quality assurance device.
Figure 8.
Comparison of corrected light signal to calculated 2D dose distribution of a four-field-box irradiation (top). 2D gamma index for these two distributions using a 3%∕3 mm criteria is shown at the bottom.
DISCUSSION
The results of this preliminary study showed that the light emitted by a LS under high-energy photon beam irradiation can be filtered to produce 2D dose distributions, in agreement with those produced by a treatment planning system. The light signal produced by the LS was slightly distorted by isotropic light scattering within the liquid as well as refraction and reflection at the tank interface. The response of the detector system was also found to be dose rate independent.
One of the advantages of this system is that the LS material is nearly water equivalent. The mass energy absorption coefficients and the mass attenuation coefficients of the LS are within 2% of that of water for energies between 0.15 and 6 MeV. Kirov et al.8 developed much better LS solutions that are more water equivalent in the megavoltage radiotherapy range than BC-531 or other commercially available LS solutions. For instance, some of their novel LS solutions have densities close to 0.95 g∕cm3, which also make them ideal candidates for use as both detecting and phantom materials. Unlike most other detector systems (e.g., ionization chambers or film), the LS itself is used as both the detector and phantom materials, avoiding perturbation by the detector.
In IMRT, the most commonly used photon beam energy is a 6 MV. We have therefore used this beam energy to validate our LSD system. However, other beam energies can be used, e.g., 60Co or 18 MV photons. The latter will produce more Čerenkov radiation, which consequently needs to be accounted for.
Although our main focus in developing the LS detector system was for future application to patient-specific QA, one could easily imagine application to dose measurement during beam commissioning or annual QA checks. The number of MUs required to obtain a single image with the LS system is few, and further, lateral profiles and PDDs can be obtained simultaneously. Thus, acquisition of beam data could be performed in a fraction of the time it takes when a single ionization chamber is used. Further, the high-resolution image is comparable to that obtained with a α-Si flat panel detector.
One precondition for reliable QA measurements is the reproducibility of the background images provided by the CCD camera. For this system, we found a 0.4% variability for acquisition times of 25 s, which demonstrates the stability of the background and thus also of the acquired image during irradiation. However, with longer acquisition times (around 10 s), some single pixels (about 1000 of 326 000) showed a “salt noise” pattern,11 which was visible in both the background image and the images acquired during irradiation. The intensity of this noise increased with increasing acquisition time, but this noise was removed by applying the median filter, so is the radiation noise. Other image distortions arise from stray radiation from the treatment head and photon interactions within the LS that strike the CCD chip. The probability of such interactions increases with the number of delivered MUs. However, shorter acquisition times are ideal for IMRT QA, which limits the amount of noise. For prolonged irradiations, one may choose to acquire multiple images and apply an adaptive median filter12 that removes this noise, while conserving the high spatial resolution of the LS detector. Nevertheless, corrections for this source or type of noise are possible.
The CCD camera is also equipped with an internal electron magnification algorithm that allows amplification of the light signal at the cost of a slightly higher noise. This is particularly useful for very low dose irradiations, where very little light is produced. However, because the CCD chip is already quite sensitive, this feature was not utilized in the present study. In low light conditions, the camera objective aperture could also be increased, which would result in a higher CCD signal but with degradation of the depth of field. If photons are created outside the depth of field, then they will add an additional blurring of the image. To avoid this, all measurements were performed with a rather high F number (F=8). Using an optical geometry formula, one can show that for a pixel size of 10 μm, a numerical aperture of 8, a focal length of f=25 mm, and an object distance of 55 cm, the depth of field is equal to 7.5 cm. This is a reasonable value considering our phantom size, as well as the size of the irradiated fields. The depth of field can be easily expanded by increasing the distance to the object, and this is planned in a new phantom design. The new design will also have a FOV of about 20×20 cm2, which is larger than the one used in this work. In addition, light refracted at the LS∕wall and the LS∕air interface also adds blurring to the image. In this preliminary work we do not correct for this effect. A possible solution could be a collimator grid9 or a special lens system.
The background due to Čerenkov radiation was not explicitly accounted for in the present study. The amount of Čerenkov light depends on the photon energy as well as the index of refraction of the irradiated media. Because the propagation of light due to Čerenkov radiation is forward peaked, the initial direction of the particle is important. In addition, Kirov et al.9 showed that when the detector is placed at 90° with respect to the photon beam, which is the case in our setup, the contribution from Čerenkov light is expected to be only a few percent. Further evaluation of the specific scintillation solution will allow for an accurate correction of the Čerenkov effect.
Finally, one current limitation of the system is that it can only acquire images in two dimensions, and there is no information as to the distance between the light source and the camera. This may be solved by adding a second CCD camera with an orthogonal view whose image acquisition is simultaneously triggered with the first camera. By combining the image data, one can extract the information on the real-time position of the dose deposition if the MLC segment has only one open area (i.e., the field is contiguous). This is particularly true in proton pencil-beam scanning where the proton beam is swept over the irradiation area and its position can be easily detected.
CONCLUSIONS
We have used a CCD camera to acquire two-dimensional images of a LS for high-energy photon beam dosimetry. Application of a series of filters to correct for various blurring effects leads to images in agreement with percentage depth dose curves, lateral profiles, and four-field dose distributions. The LS system has several important characteristics, including near water equivalence, dose rate independence, linearity with dose, and robustness for single or multiple acquisitions. Use of this system for dosimetry quality assurance checks could greatly save time over both film and scanning ionization chamber measurements.
ACKNOWLEDGMENT
This work was partly supported by the National Cancer Institute (NCI) (Grant No. 1R01CA120198-01A2).
References
- Low D. A., “Quality assurance of intensity-modulated radiotherapy,” Semin. Radiat. Oncol. 12, 219–228 (2002). [DOI] [PubMed] [Google Scholar]
- Dempsey J. F., Low D. A., Mutic S., Markman J., Kirov A. S., Nussbaum G. H., and Williamson J. F., “Validation of a precision radiochromic film dosimetry system for quantitative two-dimensional imaging of acute exposure dose distributions,” Med. Phys. 10.1118/1.1290488 27, 2462–2475 (2000). [DOI] [PubMed] [Google Scholar]
- Niroomand-Rad A., Blackwell C. R., Coursey B. M., Gall K. P., Galvin J. M., McLaughlin W. L., Meigooni A. S., Nath R., Rodgers J. E., and Soares C. G., “Radiochromic film dosimetry: Recommendations of AAPM Radiation Therapy Committee Task Group 55,” Med. Phys. 10.1118/1.598407 25, 2093–2115 (1998). [DOI] [PubMed] [Google Scholar]
- Oldham M., Siewerdsen J. H., Shetty A., and Jaffray D. A., “High resolution gel-dosimetry by optical-CT and MR scanning,” Med. Phys. 10.1118/1.1380430 28, 1436–1445 (2001). [DOI] [PubMed] [Google Scholar]
- Boon S. N., van Luijk P., Schippers J. M., Meertens H., Denis J. M., Vynckier S., Medin J., and Grusell E., “Fast 2D phantom dosimetry for scanning proton beams,” Med. Phys. 10.1118/1.598221 25, 464–475 (1998). [DOI] [PubMed] [Google Scholar]
- Petric M. P., Robar J. L., and Clark B. G., “Development and characterization of a tissue equivalent plastic scintillator based dosimetry system,” Med. Phys. 10.1118/1.2140118 33, 96–105 (2006). [DOI] [PubMed] [Google Scholar]
- Frelin A. M., Fontbonne J. M., Ban G., Colin J., Labalme M., Batalla A., Vela A., Boher P., Braud M., and Leroux T., “The DosiMap, a new 2D scintillating dosimeter for IMRT quality assurance: Characterization of two Čerenkov discrimination methods,” Med. Phys. 10.1118/1.2897966 35, 1651–1662 (2008). [DOI] [PubMed] [Google Scholar]
- Kirov A. S., Shrinivas S., Hurlbut C., Dempsey J. F., Binns W. R., and Poblete J. L., “New water equivalent liquid scintillation solutions for 3D dosimetry,” Med. Phys. 10.1118/1.598993 27, 1156–1164 (2000). [DOI] [PubMed] [Google Scholar]
- Kirov A. S., Piao J. Z., Mathur N. K., Miller T. R., Devic S., Trichter S., Zaider M., Soares C. G., and LoSasso T., “The three-dimensional scintillation dosimetry method: Test for a 106Ru eye plaque applicator,” Phys. Med. Biol. 10.1088/0031-9155/50/13/007 50, 3063–3081 (2005). [DOI] [PubMed] [Google Scholar]
- Kirov A. S., Piao Z., Devic S., Shrinivas S., Beddar A. S., Binns W. R., Kinsella T. J., and Sibata C. H., “An estimate of the perturbing effect of Cerenkov radiation to the signal from a liquid scintillator volume irradiated by a megavoltage photon beam,” Proceedings of the 22nd Annual International Conference of the IEEE Engineering in Medicine and Biology Society, 2000. (unpublished), Vol. 4, pp. 3148–3151.
- Gonzalez R. C. and Woods R. E., Digital Image Processing, 2nd ed. (Prentice-Hall, Englewood Cliffs, 2002). [Google Scholar]
- Archambault L., Briere T. M., and Beddar A. S., “Transient noise characterization and filtration in CCD cameras exposed to stray radiation from a medical linear accelerator,” Med. Phys. 10.1118/1.2975147 35, 4342–4351 (2008). [DOI] [PMC free article] [PubMed] [Google Scholar]


