Abstract
The goal of this study was to implement and validate a noninvasive, quantitative ultrasonic technique for accurate and reproducible measurement of normal-tissue toxicity in radiation therapy. The authors adapted an existing ultrasonic tissue characterization (UTC) technique that used a calibrated 1D spectrum based on region-of-interest analysis. They modified the calibration procedure by using a reference phantom instead of a planar reflector. This UTC method utilized ultrasonic radio-frequency echo signals to generate spectral parameters related to the physical properties (e.g., size, shape, and relative acoustic impedance) of tissue microstructures. Three spectral parameters were investigated for quantification of normal-tissue injury: Spectral slope, intercept, and midband fit. They conducted a tissue-mimicking phantom study to verify the reproducibility of UTC measurements and initiated a clinical study of radiation-induced breast-tissue toxicity. Spectral parameter values from measurements on two phantoms were reproducible within 1% of each other. Eleven postradiation breast-cancer patients were studied and significant differences between the irradiated and untreated (contralateral) breasts were observed for spectral intercept (p=0.003) and midband fit (p<0.001) but not for slope (p=0.14). In comparison to the untreated breast, the average difference in the spectral intercept was 2.99±0.75 dB and the average difference in the midband fit was 3.99±0.65 dB. The preliminary clinical study demonstrated the feasibility of using the quantitative ultrasonic method to evaluate normal-tissue toxicity in radiation therapy.
Keywords: radiation toxicity, normal-tissue injury, ultrasound tissue characterization, breast cancer, midband fit
INTRODUCTION
Radiation therapy, either alone or in combination with other modalities, is a powerful tool in cancer treatment. An estimated half of all newly diagnosed cancer patients receive radiotherapy for tumor control.1 In an attempt to cure the cancer, radiation doses frequently reach a level that causes injury to the surrounding normal tissues. Normal-tissue toxicity negatively impacts patients’ quality of life. To date, physicians routinely record radiation toxicity using a scoring system designed by the Radiation Therapy Oncology Group (RTOG) (Ref. 2) or the European Organization for Research and Treatment of Cancer (EORTC).3, 4 These scoring systems use numerical grades that range from no reaction (grade 0) to severe reaction (grade 4). Although simple and quantitative, these systems lack objective diagnostic measures. A pressing need exists for better and reliable quantification of normal-tissue effects in radiation therapy.
One technique that shows promise in addressing this clinical need is ultrasonic imaging. Ultrasound is safe, real time, and cost effective compared to other clinical imaging modalities, such as MRI and PET∕CT. A limited number of studies have been carried out to investigate radiation-induced skin changes with ultrasound.5 Huang et al. used a high frequency (15 MHz) ultrasound to measure attenuation and integrated backscatter of irradiated skin of the neck.6 Warsawski et al. measured early- and late-skin reactions in breast-cancer radiation therapy using 20 MHz ultrasonic imaging.7 A difference in thickness and texture of the dermis was found between the irradiated and nonirradiated breast skin. Researchers from Hong Kong Polytechnic University and Chinese University of Hong Kong studied skin and subcutaneous fibrosis, a common late effect of radiotherapy, on head-and-neck cancer patients.4, 8, 9, 10, 11
We previously presented a technique to measure skin injury in breast-cancer radiation therapy.12 We used a 6 MHz ultrasound system that is widely available in the clinical setting. Two metrics were calculated from the ultrasonic radio-frequency (RF) signals to quantify the severity of skin injury: Skin thickness and Pearson correlation coefficient of the hypodermal layer. The Pearson correlation coefficient calculates the variation in intensity between adjacent scan lines and evaluates the integrity of the hypodermis. A comparison of the treated and untreated breasts revealed significant changes in skin thickness and Pearson correlation coefficient of the hypodermis.
In this study, we investigated a quantitative ultrasound technique to measure radiation injury in the subcutaneous tissue. Our ultrasonic method combined 1D spectrum analysis developed by Lizzi and co-workers13, 14, 15, 16, 17 with a reference phantom calibration method developed by Yao et al.18 In 1D spectrum analysis, the backscattered ultrasonic RF signals were digitized and Fourier transformed to the frequency domain, and the frequency dependence of the backscattered signals was analyzed. The 1D spectral parameter values were related to the size, shape, concentration, and relative acoustic impedance of the tissue scatterers. We hypothesized that our calibrated 1D spectrum analysis could quantify the physiological response of normal tissue to ionization radiation. In the past 20 years, ultrasound tissue characterization (UTC) using 1D spectrum analysis has achieved success in cancer detection of the eye,15 prostate,19, 20, 21 liver,22, 23 and breast.24, 25 We expected that our technique would facilitate identification of radiation toxicities, such as fat necrosis and fibrosis, which are harder to evaluate in standard clinical examination. We conducted a phantom study, followed by a preliminary clinical study to test this hypothesis. In the following sections, we describe the ultrasound method consisting of RF data acquisition, data analysis, and UTC calibration. The results of 40 measurements obtained from two tissue-mimicking phantoms, over a 3 month period, demonstrate the reproducibility of our ultrasound system. Eleven postradiotherapy breast-cancer patients were enrolled to study radiation-associated normal-tissue injury. Our initial application in breast-cancer patients demonstrates its clinical feasibility.
While the focus of this article is on normal-tissue injury in breast-cancer radiation therapy, much of the technique can be applied to other treatment sites as well. Similar types of radiation injury are seen in the breast, prostate, and head-and-neck. The concepts and procedures described in this report can be modified for other clinical applications of measuring normal-tissue toxicity in radiation therapy.
MATERIALS AND METHODS
Ultrasound data acquisition
We implemented the UTC technique in a conventional ultrasound scanner, Sonix RP (Ultrasonix Medical Corporation, BC, Canada), with a linear-array transducer (model L14-5∕38). The ultrasound probe was employed at 6 MHz. In our study, real-time B-mode images and RF echo-signal data were acquired simultaneously. Ultrasound B-mode images provided visualization of the anatomical structure, while off-line spectrum analysis based on RF data provided quantitative measures. All data acquisition, for phantoms and patients, was performed at room temperature using the same settings on the ultrasound scanner: Maximum time gain control (TGC), 72% power, and single focus zone at 1 cm depth. A radiologist determined these settings based on clinical experience in breast ultrasound imaging. All RF data were sampled with 16 bit resolution at a frequency of 20 MHz, the highest sampling rate currently available on the Sonix RP system. Each frame of the RF data consisted of 256 lines (3.8 cm in width) with 1024 data samples (3.97 cm in depth) per line.
UTC data analysis
For data analysis, we developed a MATLAB® routine. Our program calculated the ultrasonic spectrum based on region-of-interest (ROI) analysis and computed three ultrasonic spectral parameters to quantify radiation-induced subcutaneous tissue changes. The detailed data analysis method underlying this spectrum technique has been previously reported.13, 14, 15 Briefly, the ultrasound data analysis involved the following five steps.
-
(a)
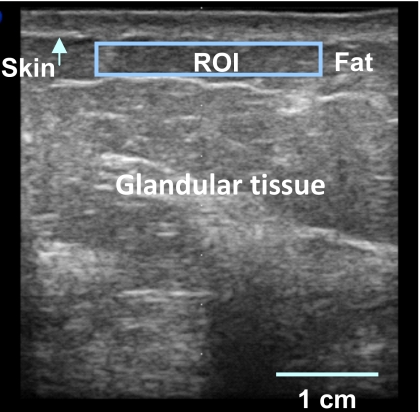
Step 1. Ultrasound B-mode image display. The conventional B-mode image, which showed anatomical structure, was displayed. Figure 1 shows a typical B-mode image of a breast where the skin, fat, and glandular tissue can be identified. This B-mode image was 38 mm (width)×40 mm (depth).
-
(b)
Step 2. ROI delineation. In this paper, all ROIs were predetermined for the phantom and clinical studies. The ROI for the phantom study had dimensions of 3.0 cm (in the cross-range direction)×0.5 cm (in the range direction) and its center was located 0.8 cm below the phantom surface. The ROI for the patient study was 3.0 cm (width)×0.5 cm (height) and its center was located 0.6 cm below the skin surface. RF echo signals inside the ROI were gated by a single Hamming window of the same length as the ROI height.
-
(c)Step 3. Spectrum computation. To analyze the RF data within the ROI, each line of the RF data within the ROI was Fourier transformed and the power spectrum Sn(f) was computed,
(1)
where vn(t) is the RF data for line n (n from 1 to N, where N is the total number of lines in the ROI) and * represents the complex-conjugate operation. The resultant spectrum of different N lines was averaged to obtain an ensemble power spectrum S(f) of the ROI and was then converted to logarithmic scale:(2) (3) -
(d)
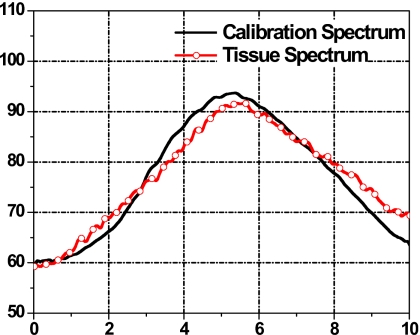
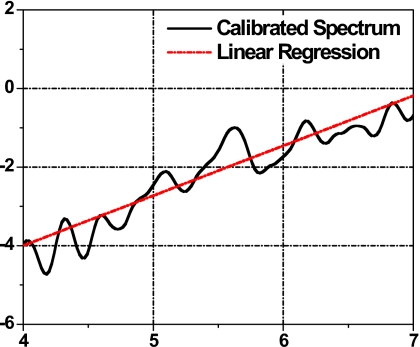
Step 4. Spectrum calibration. The averaged 1D power spectrum of the tissue segment was further calibrated to correct for system and beam-diffraction properties such as the system transfer function. A reference phantom calibration method was used and is described in the following section. Figure 2 shows a 1D spectrum of the tissue ROI (curve with open circle) and a power spectrum of a reference phantom (solid line). The calibrated tissue spectrum (in dB) was generated by subtracting the reference phantom spectrum (in dB), shown in Fig. 3.
-
(e)
Step 5. Spectral parameter generation. To obtain quantitative measures of tissue microstructure, UTC spectral parameter values were computed for each ROI analyzed. Within the usable bandwidth, the calibrated spectrum (in dB) was analyzed using a linear regression S(f)=β⋅f+I, where f is the frequency (MHz), β is the spectral slope (dB∕MHz), and I is the spectral intercept (dB). For each ROI, three spectral parameters were extracted: The slope β, the intercept I, and the midband fit M of the spectral linear regression. The midband fit is the value of the linear fit at fc, the center of the frequency bandwidth employed, M=S(fc)=β⋅fc+I.
Figure 1.
A typical ultrasound B-mode image of the breast with the skin surface (arrow) and the ROI in the subcutaneous tissue demarcated.
Figure 2.
Tissue power spectrum (curve with open circle) and calibration power spectrum (solid line).
Figure 3.
Calibrated tissue spectrum (solid curve) with linear regression (dotted line).
1D power-spectrum calibration
To more accurately quantify tissue characteristics, 1D power spectra of biological tissues were calibrated to account for extraneous system and diffraction factors. Two calibration techniques are commonly employed: One uses planar reflectors,13 while the other uses reference phantoms.18, 26 In this study, we adapted the reference phantom method, which has two major advantages over the planar reflector method. First, a planar target such as a glass plate is a strong reflector, but soft tissues are weak scatterers. The glass plate reflection can easily saturate the receiver amplifier on a clinical ultrasound scanner that is optimized to scan soft tissues. Second, the reference phantom with a distribution of 3D scatterers is often needed to compensate for diffraction effects when we analyze soft tissues at various depths, particularly outside the focal regions.
The calibration process required that the settings on the ultrasound scanner for the phantom scan matched the settings used during patient scan, e.g., transducer frequency, gain setting, focal distance, and the TGC. The reference phantom we utilized is a standard quality-assurance phantom in the clinic: CIRS model 055 (Computerized Imaging Reference Systems, Inc., Norfolk, Virginia). The CIRS phantom is manufactured from a water-based polymer and housed in a rugged ABS container. The background material has two populations of scatterers, 1 μm nonspherical particles and 64–74 μm diameter spheres. At room temperature of 22 °C, the speed of sound in the phantom is 1540±6 m∕s and the attenuation coefficient is 0.50±0.05 dB∕(MHz⋅cm).
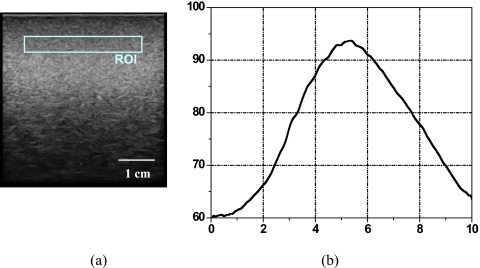
Figure 4a is a B-mode image of the calibration phantom where the ROI is demarcated. Figure 4b shows the calibration spectrum of the ROI. The center frequency was 5.5 MHz with a −12 dB usable bandwidth from 4 to 7 MHz. In this study, we chose a −12 dB bandwidth to ensure adequate signal-to-noise ratio of the breast-tissue signals. The same ROI was used for the tissue analysis in the following clinical study.
Figure 4.
(a) B-mode image of the reference phantom with ROI of 3.0 cm (width)×0.5 cm (height) centered at 0.8 cm below the phantom surface, and (b) calibration spectrum.
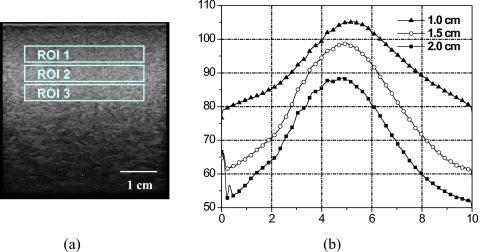
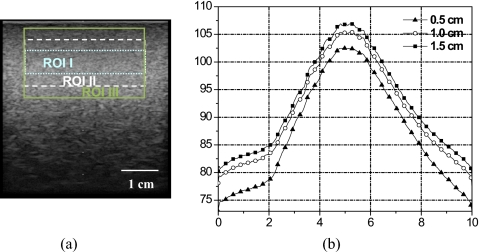
Figure 5 shows an uncalibrated phantom spectrum with fixed ROI size (3.0×0.5 cm2) centered at various depths below the phantom surface: 1.0 cm (ROI 1), 1.5 cm (ROI 2), and 2.0 cm (ROI 3). Spectrum amplitude and peak frequency decrease with depth due to attenuation. Narrowing of the spectrum occurred at the high frequency edge of the spectrum, hence giving the appearance of frequency shift. Oelze and O’Brien proposed a frequency-dependent attenuation-compensation method to account for attenuation.27 Figure 6 shows the calibration phantom spectrum for various ROI sizes centered at the same 1.0 cm depth: 3.0×0.5 cm2 (ROI I), 3.0×1.0 cm2 (ROI II), and 3.0×1.5 cm2 (ROI III). Phantom spectral amplitude increased with ROI size due to the increase in the number of scatterers inside the ROI. However, the overall spectral shape did not change. The relationship between window size and spectral parameters is described by Lizzi et al.16
Figure 5.
Calibration spectra at various ROI depths. (a) B-mode image of the calibration phantom showing ROIs centered at depths of 1 cm (ROI 1), 1.5 cm (ROI 2), and 2 cm (ROI 3). (b) 1D power spectra for ROIs shown in (a).
Figure 6.
Calibration spectra for various ROI sizes. (a) B-mode image of the calibration phantom with ROIs centered at 1 cm depth: ROI I (3.0×0.5 cm2) dotted lines, ROI II (3.0×1 cm2) dashed lines, and ROI III (3.0×1.5 cm2) solid lines. (b) 1D power spectra for ROIs shown in (a).
Phantom study
We conducted a series of measurements on tissue-mimicking phantoms to investigate the reproducibility of our ultrasound method. Two identical ATS phantoms (ATS Laboratories, Bridgeport, CT) that mimic tissue acoustic properties were used. At room temperature, the sound speed of the ATS phantoms was 1452 m∕s and the attenuation coefficient was 0.5 dB∕(cm MHz). The tissue-mimicking materials were composed of 50 μm glass beads randomly deposited within a rubber-based background material. The glass beads served as isotropic scatterers. Aquasonic® ultrasound gel was used to couple the ultrasound probe and the phantom surface. Each ATS phantom was scanned four times on ten separate days (a total of 40 scans) over a period of 3 months. Testing periods spanned several hours ensuring that the four measurements were acquired throughout the day.
Clinical study
We initiated a clinical study, approved by Columbia University Medical Center Institutional Review Board (IRB), to measure radiation-induced tissue toxicity in breast-cancer radiation therapy. In this preliminary study, 11 postradiation breast-cancer patients were scanned with ultrasound at their follow-up examinations. All patients received a primary dose of either 50.0 or 50.4 Gy applied to the entire breast, followed by a boost dose ranging from 10.0 to 16.0 Gy at the lumpectomy site. The follow-up time between radiation-treatment completion and our ultrasound study ranged from 6 to 43 months, with a median of 23 months.
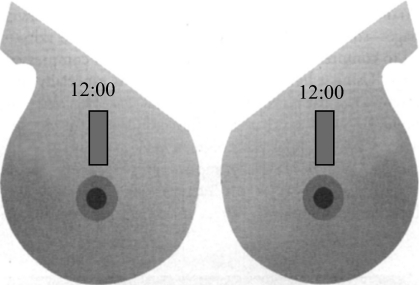
Patients were imaged in a supine position. A thin layer (1–2 mm) of ultrasound gel was applied to the skin surface to ensure good acoustic coupling. The ultrasound probe was adjusted such that the scan plane was perpendicular to the breast surface. Data were acquired using a radial scan plane with respect to the nipple and without compression. Independent of tumor bed location, scans at the 12 o’clock position (shown in Fig. 7) on the treated breast were compared to those of the untreated (contralateral) breast, which served as a baseline or control. For data analyses, the identical ROI (shown in Fig. 4a) was used and three spectral parameter values were computed for treated and untreated breasts. A paired t-test was conducted to evaluate the performance of the spectral parameters in differentiating the treated versus the untreated breast.
Figure 7.
Mirror images of right and left breasts indicate where the location and orientation of the ultrasound scans.
RESULTS
Phantom study
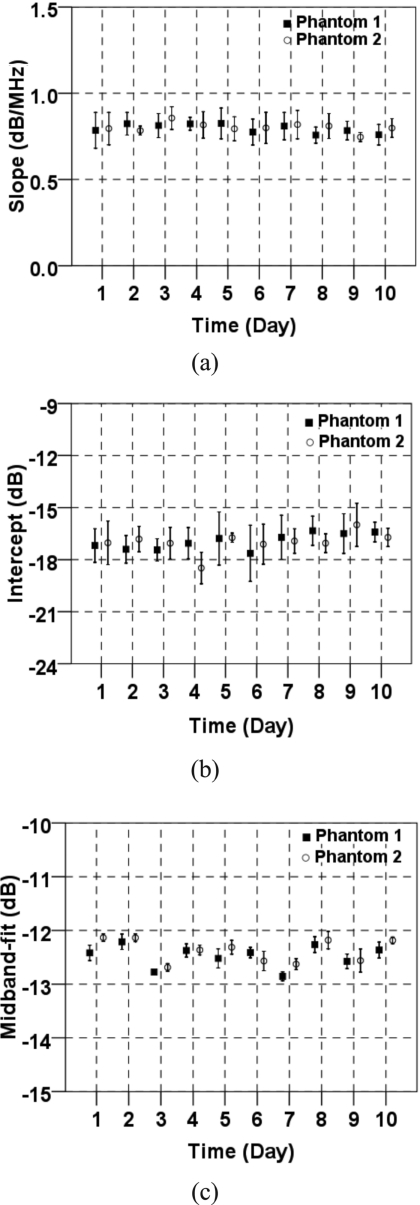
Spectral parameter values were generated from measurements on two identical ATS phantoms. Figures 8a, 8b, 8c show the averaged spectral slope, intercept, and midband fit of the signals in the ROI on each day. The error bars represent 1 standard deviation. Although some variability of spectral parameter values was observed, a comparison of these values revealed a close correlation between phantom 1 and phantom 2. The variability from one day to the next can be largely attributed to fluctuations in room temperature over the 3 month testing period. The acoustic properties of ATS phantoms were very sensitive to the temperature, which could vary up to 8 °C from day to day in our laboratory.
Figure 8.
Average spectral parameter measurements vs time: (a) Slope, (b) spectral intercept, and (c) midband fit. The error bars indicate ±1 standard deviation.
The multiple measurements on two tissue-mimicking phantoms demonstrated the reproducibility of our ultrasound system (Table 1). The differences in values (for the mean values) for all the spectral parameters between the two phantoms were within 1%, which indicated the precision of the system. The coefficients of variation (defined as the ratio of the standard deviation to the mean) for the spectral slope, intercept, and midband fit for both phantoms were 12.5%, 5.9%, and 1.6%, respectively. The midband fit was the most stable of the three parameters.
Table 1.
Averaged spectral parameters for the two ATS phantoms.
| Test phantom No. 1 | Test phantom No. 2 | |
|---|---|---|
| Slope (dB∕MHz) | 0.8±0.1 | 0.8±0.1 |
| Intercept (dB) | −16.9±1.0 | −17.0±1.0 |
| Midband fit (dB) | −12.5±0.2 | −12.4±0.2 |
Clinical study
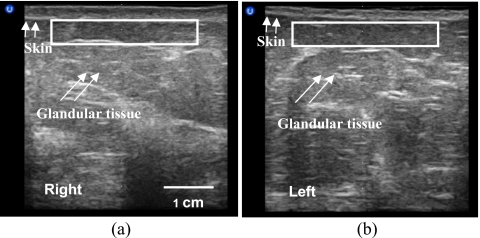
Eleven breast-cancer patients were studied after radiation treatment. Figure 9 shows the ultrasound images of a 55-yr old breast-cancer patient who underwent conservation surgery and radiation treatment for stage I invasive ductal carcinoma in the left breast. She received a standard course of radiation treatment: 50.0 Gy dose to the whole breast, followed by a boost of 16.0 Gy to the tumor bed. Ultrasound B-mode images and RF data were acquired 1 yr postradiation. Using the bilateral breast ultrasound images from the 12 o’clock location (Fig. 7), we observed alterations in the treated (right) breast tissue by comparing its scanned image to that of the untreated (left) breast. The treated breast was more echoic in the glandular tissue. The skin thickness of the normal left breast was 1.8 mm and the skin thickness of the treated breast was 3.0 mm. Through palpation, the radiation oncologist found moderate hardening (grade 2) of the treated breast, which indicated development of radiation-induced fibrosis.
Figure 9.
Ultrasound B-mode images of the irradiated breast (a) and normal breast (b).
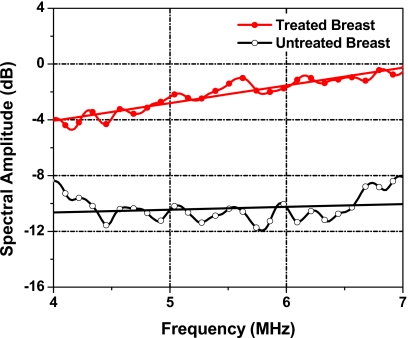
To quantify radiation-induced subcutaneous-tissue changes, we analyzed the RF data from the glandular tissue for the treated breast and the untreated breast. The power spectrum of each breast is shown in Fig. 10. Overall, the amplitude of the spectrum was greater in the treated breast relative to the untreated breast. The spectral slope, the intercept, and the midband fit for the treated breast were 1.27 dB∕MHz, −9.15 dB, and −2.16 dB, respectively. The corresponding spectral parameter values for the untreated breast tissue were 0.20 dB∕MHz, −11.47 dB, and −10.34dB, respectively. Compared to corresponding parameter values of the untreated tissue, spectral slope of the treated tissue was greater by 1.07 dB∕MHz, the spectral intercept was greater by 2.32 dB, and the midband fit was greater by 8.18 dB.
Figure 10.
1D power spectra of the subcutaneous tissues of the treated breast (solid circle curve) and the untreated breast (open circle curve). The straight lines are the linear regressions. The center of the ROI is 0.8 cm beneath the skin surface.
Table 2 shows the spectral estimates of treated and untreated breast tissues for 11 patients. Large variations among patients were observed in all parameter values of the treated and untreated breasts. For the untreated breast, the spectral slope, the intercept, and the midband fit value ranges were −0.26 to 1.41 dB∕MHz, −13.07 to 0.28 dB, and −10.34 to 2.12dB, respectively. For the treated breast, the corresponding ranges were −0.42 to 1.90 dB∕MHz, −12.32 to 0.91 dB, and −2.90 to 4.69 dB, respectively. The spectral parameter value difference was calculated for each patient using the normal-tissue measurement as baseline. The spectral slope, intercept, and midband fit were greater in the treated breast than those in the untreated breast by 0.19 dB∕MHz, 2.94 dB, and 3.99 dB, respectively. Table 3 lists the results of further statistical analysis on the spectral parameter value differences that confirmed significant change between treated and untreated breasts for the intercept (p=0.003) and midband fit (p<0.001) values but not for the slope (p=0.14) values. Based on this study of 11 patients, the spectral intercept and midband fit appeared to be the most reliable parameters for measuring radiation effect.
Table 2.
UTC spectral estimates for the 11 patients.
| Patient No. | Slope (dB∕MHz) | Intercept (dB) | Midband fit (dB) | ||||||
|---|---|---|---|---|---|---|---|---|---|
| Normal tissue | Irradiated tissue | Difference | Normal tissue | Irradiated tissue | Difference | Normal tissue | Irradiated tissue | Difference | |
| 1 | 1.14 | 1.16 | 0.02 | −8.08 | −2.38 | 5.70 | −1.82 | 4.03 | 5.85 |
| 2 | −0.19 | 0.42 | 0.61 | 0.22 | 0.91 | 0.69 | −0.85 | 3.24 | 4.09 |
| 3 | 0.20 | 1.27 | 1.07 | −11.47 | −9.15 | 2.32 | −10.34 | −2.16 | 8.18 |
| 4 | 0.17 | 0.70 | 0.53 | −8.60 | −5.21 | 3.39 | −7.65 | −1.37 | 6.28 |
| 5 | 0.81 | 0.62 | −0.19 | −11.27 | −5.80 | 5.47 | −6.83 | −2.36 | 4.47 |
| 6 | 1.41 | 1.90 | 0.49 | −13.07 | −12.32 | 0.75 | −5.33 | −1.84 | 3.49 |
| 7 | 0.51 | −0.42 | −0.93 | −8.24 | −0.61 | 7.63 | −5.42 | −2.90 | 2.52 |
| 8 | 0.75 | 0.91 | 0.16 | −2.03 | −0.32 | 1.71 | 2.12 | 4.69 | 2.57 |
| 9 | −0.26 | 0.39 | 0.65 | 0.28 | 0.16 | −0.12 | −1.16 | 2.31 | 3.47 |
| 10 | 1.10 | 1.01 | −0.09 | −4.99 | −4.13 | 0.86 | 1.06 | 1.46 | 0.40 |
| 11 | 1.34 | 1.08 | −0.26 | −8.18 | −4.23 | 3.95 | −0.78 | 1.73 | 2.51 |
Table 3.
Mean and standard error of spectral parameter differences between the irradiated and untreated breasts.
| Mean | Standard error | p-value | |
|---|---|---|---|
| Slope (dB∕MHz) | 0.19 | 0.17 | 0.142 |
| Intercept (dB) | 2.94 | 0.75 | 0.003 |
| Midband fit (dB) | 3.99 | 0.65 | <0.001 |
DISCUSSION
We investigated a quantitative ultrasonic technique to measure radiation-induced normal-tissue toxicity. This technique combined a 1D spectrum analysis with a reference phantom calibration that accounted for the properties of the ultrasound system. The calibrated spectral parameters provided quantitative measures of the physical properties, such as size and shape of the tissue microstructures (scatterers). Overall, our ultrasonic system and method were found to be reproducible. We initiated a pilot clinical study to test our technique’s clinical utilities in breast-cancer radiation therapy.
This clinical application on a breast-tissue model demonstrated the feasibility of the technique for quantitatively assessing radiation-induced normal-tissue toxicity. In postradiation subcutaneous breast tissue, we observed a trend toward greater spectral intercept and midband fit with respect to that of the untreated breast tissue. The theoretical model developed by Lizzi et al. suggested that an increase in the size, concentration, or relative acoustic impedance of the scattering elements would result in an increase in midband-fit value, most likely with a concomitant increase in intercept value, depending on the degree of change in the slope value.14 The midband fit is closely related to the integrated backscatter.28 The increase in the integrated backscatter could be attributed to the increase in collagen content as proposed by O’Donnell et al.28 An unchanging spectral slope suggested that scatterer size did not change as a result of treatment, and therefore, the observed increases in midband-fit and intercept values indicated an increase in scatterer concentration or acoustic impedance.
In many ways, treated tissue responds to radiation damage in a manner similar to that of normal wound healing.29 In histological terms, late radiation damage is often characterized by a loss of parenchymal cells and overproduction of collagen.30 Two out of the three parameters from the RF measurements appeared to correlate with radiation injury to the breast. These spectral parameters track overall levels of radiation injury while maintaining operator independence.31, 32
Breast tissue varied greatly from patient to patient as indicated by the spectral parameter values of the untreated breast (Table 2). To account for these variations, we used the untreated breast as a baseline to evaluate radiation-associated breast-tissue toxicity. In prospective studies, both breasts could be scanned prior to radiation and used as baselines. One limitation of the study is that our ultrasound technique was based on RF data analysis methods that are not readily available in most clinical setups. Nevertheless, RF data can be extracted from most clinical scanners through customized circuit and software interfaces.
Early and late normal-tissue toxicity is a major factor that affects the quality of life for patients receiving radiotherapy. In vivo monitoring of normal-tissue injury is important in the management of radiation treatment. Noninvasive UTC spectral analysis has demonstrated the possibility of monitoring radiation-associated normal-tissue toxicity; however, optimal ultrasound parameters must be identified and further tested. In addition, spectral parameters should be compared to clinical endpoints, such as RTOG toxicity scores, patient self-breast-assessment and patient quality-of-life evaluation. Radiation toxicities are becoming an increasing concern in breast-cancer management as treatment becomes more effective and the number of long-term cancer survivors increases.
CONCLUSIONS
We developed a quantitative assessment of radiation-associated normal-tissue toxicity using ultrasonic imaging in combination with UTC spectral analysis. Ultrasonic imaging displays B-mode images of the treated breast tissue, while UTC spectral parameters provide quantitative measurements of tissue characteristics. This ultrasound technique may lead to greater knowledge on normal-tissue responses to radiation therapy.
ACKNOWLEDGMENTS
This research was supported in part by the National Cancer Institute under Grant No. CA114313, Columbia University Women at Risk, Sindab pilot award, and Varian Medical Systems.
References
- Bentzen S. M., “Preventing or reducing late side effects of radiation therapy: Radiobiology meets molecular pathology,” Nat. Rev. Cancer 10.1038/nrc1950 6, 702–713 (2006). [DOI] [PubMed] [Google Scholar]
- “RTOG acute radiation morbidity scoring criteria” (http://www.rtog.org/members/toxicity/acute.html).
- Bentzen S. M., Dörr W., Anscher M. S., Denham J. W., Hauer-Jensen M., Marks L. B., and Williams J., “Normal tissue effects: Reporting and analysis,” Semin. Radiat. Oncol. 13, 189–202 (2003). 10.1016/S1053-4296(03)00036-5 [DOI] [PubMed] [Google Scholar]
- Davis A. M., Dische S., Gerber L., Saunders M., Leung S. F., and O’Sullivan B., “Measuring postirradiation subcutaneous soft-tissue fibrosis: State-of-the-art and future directions,” Semin. Radiat. Oncol. 13, 203–213 (2003). 10.1016/S1053-4296(03)00022-5 [DOI] [PubMed] [Google Scholar]
- Davis A. M., Gerrand C., Griffin A., O’Sullivan B., Hill R. P., Wunder J. S., Abudu A., and Bell R. S., “Evaluation of clinical utility of BTC-2000 for measuring soft tissue fibrosis,” Int. J. Radiat. Oncol., Biol., Phys. 60, 286–294 (2004). [DOI] [PubMed] [Google Scholar]
- Huang Y. P., Zheng Y. P., Leung S. F., and Mak A. F., “Reliability of measurement of skin ultrasonic properties in vivo: A potential technique for assessing irradiated skin,” Skin Res. Technol. 13, 55–61 (2007). 10.1111/j.1600-0846.2006.00191.x [DOI] [PubMed] [Google Scholar]
- Warszawski A., Rottinger E. M., Vogel R., and Warszawski N., “20 MHz ultrasonic imaging for quantitative assessment and documentation of early and late postradiation skin reactions in breast cancer patients,” Radiother. Oncol. 47, 241–247 (1998). 10.1016/S0167-8140(97)00201-6 [DOI] [PubMed] [Google Scholar]
- Huang Y. P., Zheng Y. P., Leung S. F., and Choi A. P., “High frequency ultrasound assessment of skin fibrosis: Clinical results,” Ultrasound Med. Biol. 33, 1191–1198 (2007). 10.1016/j.ultrasmedbio.2007.02.009 [DOI] [PubMed] [Google Scholar]
- Leung S. F., Zheng Y. P., Choi C. Y., Mak S. S., Chiu S. K., Zee B., and Mak A. F., “Quantitative measurement of post-irradiation neck fibrosis based on the young modulus: Description of a new method and clinical results,” Cancer 95, 656–662 (2002). 10.1002/cncr.10700 [DOI] [PubMed] [Google Scholar]
- Huang Y. P., Zheng Y. P., and Leung S. F., “Quasi-linear viscoelastic properties of fibrotic neck tissues obtained from ultrasound indentation tests in vivo,” Clin. Biomech. 20, 145–154 (2005). 10.1016/j.clinbiomech.2004.09.012 [DOI] [PubMed] [Google Scholar]
- Zheng Y. P., Leung S. F., and Mak A., “Assessment of neck tissue fibrosis using an ultrasound palpation system: A feasibility study,” Med. Biol. Eng. Comput. 38, 497–502 (2000). 10.1007/BF02345743 [DOI] [PubMed] [Google Scholar]
- Liu T., Zhou J., Osterman K. S., Zhang P., Woodhouse S. A., Schiff P. B., and Kutcher G. J., “Measurements of radiation-induced skin changes in breast cancer radiation therapy using ultrasonic imaging,” IEEE International Conference on Biomedical Engineering and Informatics (IEEE, Sanya, China, 2008), Vol. 2, pp. 718–722. [DOI] [PMC free article] [PubMed]
- Lizzi F. L., Greenebaum M., Feleppa E. J., Elbaum M., and Coleman D. J., “Theoretical framework for spectrum analysis in ultrasonic tissue characterization,” J. Acoust. Soc. Am. 10.1121/1.389241 73, 1366–1373 (1983). [DOI] [PubMed] [Google Scholar]
- Lizzi F. L., Ostromogilsky M., Feleppa E. J., Rorke M. C., and Yaremko M. M., “Relationship of ultrasonic spectral parameters to features of tissue microstructure,” IEEE Trans. Ultrason. Ferroelectr. Freq. Control 10.1109/T-UFFC.1987.26950 34, 319–329 (1987). [DOI] [PubMed] [Google Scholar]
- Feleppa E. J., Lizzi F. L., Coleman D. J., and Yaremko M. M., “Diagnostic spectrum analysis in ophthalmology: A physical perspective,” Ultrasound Med. Biol. 10.1016/0301-5629(86)90183-3 12, 623–631 (1986). [DOI] [PubMed] [Google Scholar]
- Lizzi F. L., Alam S. K., Mikaelian S., Lee P., and Feleppa E. J., “On the statistics of ultrasonic spectral parameters,” Ultrasound Med. Biol. 32, 1671–1685 (2006). 10.1016/j.ultrasmedbio.2006.09.002 [DOI] [PubMed] [Google Scholar]
- Lizzi F. L., Astor M., Feleppa E. J., Shao M., and Kalisz A., “Statistical framework for ultrasonic spectral parameter imaging,” Ultrasound Med. Biol. 10.1016/S0301-5629(97)00200-7 23, 1371–1382 (1997). [DOI] [PubMed] [Google Scholar]
- Yao L. X., Zagzebski J. A., and Madsen E. L., “Backscatter coefficient measurements using a reference phantom to extract depth-dependent instrumentation factors,” Ultrason. Imaging 10.1016/0161-7346(90)90221-I 12, 58–70 (1990). [DOI] [PubMed] [Google Scholar]
- Feleppa E. J., Ennis R. D., Schiff P. B., Wuu C. S., Kalisz A., Ketterling J., Urban S., Liu T., Fair W. R., Porter C. R., and Gillespie J. R., “Ultrasonic spectrum-analysis and neural-network classification as a basis for ultrasonic imaging to target brachytherapy of prostate cancer,” Brachytherapy 1, 48–53 (2002). 10.1016/S1538-4721(02)00002-8 [DOI] [PubMed] [Google Scholar]
- Feleppa E. J., Liu T., Kalisz A., Shao M. C., Fleshner N., Reuter V., and Fair W. R., “Ultrasonic spectral-parameter imaging of the prostate,” Int. J. Imaging Syst. Technol. 8, 11–25 (1997). [DOI] [Google Scholar]
- Lizzi F. L., Feleppa E. J., Alam S. K., and Deng C. X., “Ultrasonic spectrum analysis for tissue evaluation,” Pattern Recogn. Lett. 24, 637–658 (2003). 10.1016/S0167-8655(02)00172-1 [DOI] [Google Scholar]
- Zagzebski J. A., Lu Z. F., and Yao L. X., “Quantitative ultrasound imaging: In vivo results in normal liver,” Ultrason. Imaging 10.1006/uimg.1993.1021 15, 335–351 (1993). [DOI] [PubMed] [Google Scholar]
- Lu Z. F., Zagzebski J. A., and Lee F. T., “Ultrasound backscatter and attenuation in human liver with diffuse disease,” Ultrasound Med. Biol. 10.1016/S0301-5629(99)00055-1 25, 1047–1054 (1999). [DOI] [PubMed] [Google Scholar]
- Alam S. K., Lizzi F. L., Feleppa E. J., Liu T., and Kalisz A., “Computer-aided diagnosis of breast lesions using a multifeature analysis procedure,” Medical Imaging 2002: Ultrasonic Imaging and Signal Processing (SPIE, San Diego, 2002), Vol. 4687, pp. 296–303.
- Gefen S., Tretiak O. J., Piccoli C. W., Donohue K. D., Petropulu A. P., Shankar P. M., Dumane V. A., Huang L., Kutay M. A., Genis V., Forsberg F., Reid J. M., and Goldberg B. B., “ROC analysis of ultrasound tissue characterization classifiers for breast cancer diagnosis,” IEEE Trans. Med. Imaging 10.1109/TMI.2002.80836122, 170–177 (2003). [DOI] [PubMed] [Google Scholar]
- Cloostermans M. J. and Thijssen J. M., “A beam corrected estimation of the frequency dependent attenuation of biological tissues from backscattered ultrasound,” Ultrason. Imaging 10.1016/0161-7346(83)90015-9 5, 136–147 (1983). [DOI] [PubMed] [Google Scholar]
- Oelze M. L. and O’Brien J. W. D., “Frequency-dependent attenuation-compensation functions for ultrasonic signals backscattered from random media,” J. Acoust. Soc. Am. 10.1121/1.1452743 111, 2308–2319 (2002). [DOI] [PubMed] [Google Scholar]
- O’Donnell M., Mimbs J. W., and Miller J. G., “Relationship between collagen and ultrasonic backscatter in myocardial tissue,” J. Acoust. Soc. Am. 10.1121/1.385433 69, 580–588 (1981). [DOI] [PubMed] [Google Scholar]
- Anscher M. S., Chen L., Rabbani Z., Kang S., Larrier N., Huang H., Samulski T. V., Dewhirst M. W., Brizel D. M., Folz R. J., and Vujaskovic Z., “Recent progress in defining mechanisms and potential targets for prevention of normal tissue injury after radiation therapy,” Int. J. Radiat. Oncol., Biol., Phys. 62, 255–259 (2005). 10.1016/j.ijrobp.2005.01.040 [DOI] [PubMed] [Google Scholar]
- Fajardo L. F., Kwan H. H., Kowalski J., Prionas S. D., and Allison A. C., “Dual role of tumor necrosis factor-alpha in angiogenesis,” Am. J. Pathol. 140, 539–544 (1992). [PMC free article] [PubMed] [Google Scholar]
- Zhou J., Zhang P., Woodhouse S., Schiff P., Ballas L., Kutcher G., and Liu T., “Reliability study of ultrasound tissue characterization in quantitative measurement of radiation-induced breast tissue toxicity,” Med. Phys. 35, 2986–2987 (2008). 10.1118/1.2962914 [DOI] [Google Scholar]
- Zhou J., Kutcher G. J., Woodhouse S. A., Schiff P. B., Ballas L., Vance W., Zhang P., Lu Z., Pile-Spellman E., and Liu T., “Automated and objective assessments of radiation-induced fibrosis using advanced ultrasound imaging in breast cancer radiation therapy,” Int. J. Radiat. Oncol., Biol., Phys. 72, S191–S192 (2008). [Google Scholar]


