Abstract
The noise power properties of a cone-beam computed tomography (CT) system dedicated for breast cancer detection were investigated. Uniform polyethylene cylinders of various diameters were scanned under different system acquisition conditions. Noise power spectra were calculated from difference data generated by subtraction between two identical scans. Multidimensional noise power spectra (NPS) were used as the metric to evaluate the noise properties of the breast CT (bCT) under different system acquisition and reconstruction conditions. A comprehensive investigation of the noise properties was performed in regard to system acquisition parameters including kVp, mA, number of cone-beam projection images used, cone angle, and object size. The influence on reconstruction parameters including interpolation method, reconstruction filter, field of view, matrix size, and slice thickness were also studied. Under certain conditions, the zero-dimensional NPS (image variance) was used as a quantitative index to compare the influence from different scan parameters, especially the radiation dose. If the total scan dose is changed by linearly changing the total number of projection images while the dose per frame is kept constant, the noise power has a linear relationship with the reciprocal of the total dose. If the total scan dose is changed by linearly changing the dose per frame while the total number of projection images is kept constant, the noise power has a quadratic relationship with the reciprocal of the total dose. With the same amount of total dose, using fewer projection images results in lower image noise power in the CT image. Quantitative results from this noise power analysis provide guidance for the bCT system operation, optimization, and data reconstruction.
Keywords: image quality, cone-beam, computed tomography (CT), noise power spectrum (NPS), breast cancer
INTRODUCTION
Computed tomography (CT) systems with cone-beam acquisition geometries have been actively studied during the past decade. This research activity has led to numerous applications,1, 2, 3, 4, 5, 6 including dedicated breast CT (bCT) for breast cancer detection.7, 8, 9, 10, 11, 12, 13, 14, 15, 16 Prototype bCT scanners have been developed in our laboratory and are currently being evaluated in phase II clinical trials.10 While the clinical efficacy of bCT awaits observer-performance evaluation from large scale clinical databases, the prototype scanner provides a unique research platform to explore the key issues directly related to image quality of cone-beam CT systems.17, 18
The modulation transfer function (MTF) and noise power spectrum (NPS) have been established as the principal metrics which quantitatively evaluate the image quality performance of imaging systems,19, 20, 21, 22, 23, 24, 25, 26, 27 by characterizing the spatial resolution and noise power properties, respectively. Previous reports have described the spatial resolution properties of the bCT system by physical measurement17 and computer simulation18 of the MTF.
Theoretical21, 22, 24, 28, 29 and experimental24, 30 studies related to CT noise properties have been published since 1970s. Chesler et al. derived a general expression of the CT noise due to photon counting statistics and found that the variance is inversely proportional to the cube of the resolution distance.28 Riederer et al. showed that the two-dimensional noise power spectrum of CT is proportional to ∣G(k)∣2∕k, where k is the radial spatial frequency and G(k) is the kernel used for filtered backprojection.29 Hanson used signal detection theory to investigate the large-area, low-contrast detection capabilities and its relationship with the low-frequency content of the noise power spectral density.21 Kijewski and Judy derived the CT NPS from a discrete filtered backprojection algorithm and studied the effects from sampling within the projection, rotation angle, and reconstructed two-dimensional images.22 Siewerdsen et al. presented a methodological framework for experimental analysis of the NPS for multidimensional images with cone-beam CT as a three-dimensional (3D) case.24 Boedecker et al. measured NPS and noise equivalent quanta on multislice diagnostic CT scanners.30 With a focus on the experimental evaluation, the purpose of this study was to describe the quantum noise power properties of a cone-beam CT system and elucidate the dependencies of cone-beam CT noise power on various system acquisition and reconstruction parameters.
METHODS AND MATERIALS
Experimental setup
The experiments were conducted on the first prototype bCT scanner built in our laboratory, code-name as “Albion.” This system uses an x-ray tube (Comet, Flamatt, Switzerland) with a nominal 0.4-mm focal spot and a CsI based flat panel detector system (PaxScan 4030CB, Varian Medical Systems, Palo Alto, CA) with an effective coverage area of 30 cm×40 cm and generates maximal 2048×1536 pixels per frame. The detector operates at a 2×2 pixel binning mode (388 μm×388 μm pixel size) with 1024×768 pixels per frame at 30 frames per second. A routine scan takes about 17 s to acquire 530 frames using a complete (⩾360°) rotation of the CT gantry. The x-ray focal spot is located 459 mm from the isocenter and 878 mm from the detector plane, corresponding to a magnification factor of 1.91.
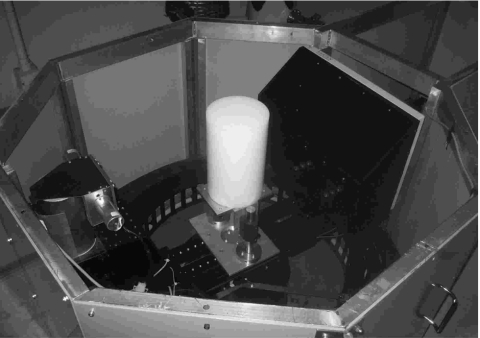
To measure the noise properties on the bCT under a similar scan environment for breast imaging, polyethylene cylinders with various diameters (104, 131, 156, and 184 mm) were used as the surrogate material for breast adipose tissue. Each cylinder was placed at the isocenter of the scanner and scanned using a number of different acquisition parameters, including tube voltage (60, 80, and 100 kVp), and number of CT projection images (500 and 1000). Different dose levels were also used by adjusting the tube current (mA) throughout the range limited by both the tube power and detector saturation point. The dose level for each scan was measured as the air kerma (mGy) at the isocenter with no object present. Under each scan setting, the same phantom was scanned twice to generate two identical reconstructed CT volume data sets for the purpose of image subtraction. The NPS calculation was modified to account for this subtraction process, as described in the following section. A picture of the experimental setup is shown in Fig. 1.
Figure 1.
BCT noise measurement setup. A 156 mm diameter polyethylene cylinder was placed at the isocenter of the bCT scanner.
Image reconstruction
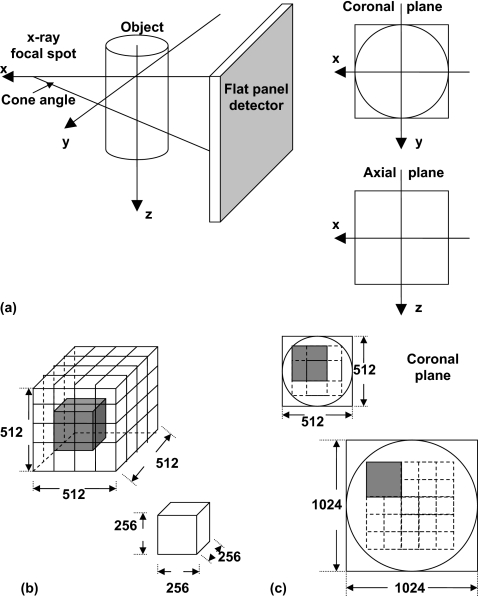
A filtered-backprojection based cone-beam reconstruction algorithm (FDK method)31 was used to reconstruct bCT images. Multiple coronal plane slices (parallel to the system rotation plane) were reconstructed through the length of the polyethylene cylinder. Due to the design of the bCT geometry, the reconstructed coronal slices span an approximate “half cone,” with cone angles ranging from about −1° (posterior) to 14° (anterior). The maximum cone angle coverage without major reconstruction artifact depends on the reconstruction field of view within the coronal plane. Figure 2a illustrates the geometry definition of the bCT data set. Various reconstruction parameters were investigated with respect to their influence on the bCT NPS, including the reconstruction filter (ramp and Shepp–Logan), the size of the field of view (FOV), the reconstruction matrix size (1024×1024 and 512×512), and the coronal slice thickness. The ramp filter was selected because it is the basic building component for all different kernels in FDK reconstruction and the Shepp–Logan filter is the current routine filter used in bCT practice at our institution. In this study, the reconstruction FOV was 103.8×103.8 mm2. Thus the coronal plane bCT image pixel size was 0.1014 mm for a matrix size of 1024×1024 and 0.2028 mm for the 512×512 matrix. The coronal slice thickness varied from 0.2 to 4.0 mm.
Figure 2.
BCT system geometry definition and ROI selection. (a) Cone-beam geometry; (b) 3D NPS synthesis: 27 overlapped VOIs for a 5123 volume; (c) 2D NPS synthesis and ROI selection in coronal plane: Four overlapped ROIs for a 512×512 matrix and 16 ROIs for 1024×1024.
Another important parameter that affects bCT noise properties is the interpolation method used in the cone-beam CT reconstruction. A voxel driven FDK based algorithm was used for the bCT reconstruction.32 Once a targeted voxel is projected onto the detector plane along a specific projection ray, two different interpolation strategies can be used to determine the value to be backprojected onto this voxel, nearest neighbor and bilinear interpolation.33 As stated by Kijewski and Judy22 in their studies of the two-dimensional (2D) parallel beam CT noise power spectrum, these two different interpolation methods generate very different noise power spectra. In this work, the bCT noise power properties were evaluated for both interpolation methods.
To evaluate the influence of the total number of projections on the image noise power, the scan data from a 500-view scan was also reconstructed using various numbers of projections, ranging from 25 to 500 images.
Table 1 lists the acquisition and reconstruction parameters studied in this work.
Table 1.
List of parameters studied.
| Acquisition parameters | |||
|---|---|---|---|
| Object size (mm) | 104, 131, 156, and 184 | ||
| X-ray spectrum (kVp) | 60 | 80 | 100 |
| X-ray tube current (mA) | 0.3–9.0 | 0.4–7.0 | 0.3–4.2 |
| Total number of projections | 500a and 1000 | ||
| Reconstruction parameters | |||
| FOV (mm2) | 103.8×103.8 | ||
| Interpolation method | Nearest neighbor and bilinear | ||
| Coronal plane slice thickness (mm) | 0.2–4.0 | ||
| Cone angle (°) | −0.58–13.57 (29 locations) | ||
| CT image matrix size | 1024×1024 | 512×512 | |
| CT image pixel size (mm2) | 0.10142 | 0.20282 | |
| Reconstruction filter | Ramp | Shepp–Logan | |
| Number of ROIs per slice | 16 | 4 | |
| Number of ROIs per scan | 464 | 116 | |
25–500 projections were used in reconstruction.
Multidimensional NPS computation and normalization
In this study, noise power spectra were calculated for multiple dimensions, including: 3D NPS, 2D NPS, one-dimensional (1D) NPS, and zero-dimensional (0D) NPS (variance). The noise power spectra with different dimensions are closely related and can be used to evaluate the system performance with different purposes under various conditions. All the noise power spectra were calculated from the “difference data” by subtracting the CT data from two identical scans. As shown by previous studies,30 the image subtraction method can eliminate structured noise in the original images. Since only uniform objects were used in this study, the structured noise only refers to the “cupping” artifact caused from photon scattering and beam hardening, and the “streak” artifact caused from imperfect projection weighting in the reconstruction. The noise power of the subtracted image is only different from that of the original image by a factor of 2. This factor was taken into consideration in the following calculation of the NPS.
To calculate the 3D NPS, the difference data were generated from volume data sets reconstructed with a matrix size of 5123. The resulted volume was separated into 27 half-overlapped subvolumes or volumes of interest (VOIs) with a size of 2563, as shown in Fig. 2b.
The NPS for bCT in 3D is defined as24
| (1) |
where N is the total number of VOIs. Nx, Ny and Nz are the number of elements in three dimensions for each VOI, and Δx, Δy, Δz are the corresponding voxel sizes in each direction. DIi(x,y,z) is the VOI indexed with i and the mean value of this VOI is calculated as .
For 2D NPS, the difference data were generated from coronal plane slices. The coronal slice images were reconstructed with the size of field of view and the matrix size selected to adequately avoid noise aliasing in the frequency domain, as discussed in the following section. For the noise images with a matrix size of 512×512, four half-overlapped 256×256 regions of interest (ROIs) were used to determine the NPS. A total of sixteen half-overlapped 256×256 ROIs were used for noise images reconstructed with a matrix size of 1024×1024. Figure 2c illustrates the ROI selection strategy. The 2D NPS for bCT in coronal plane is defined as24
| (2) |
The Fourier transform results were verified by comparing the zero-frequency signal magnitude to the root-mean-square computation of the variance of the ROI in the spatial domain.
To investigate the noise power properties of bCT in the vertical (z) direction, coronal plane NPS results were compared at different slice locations, corresponding to different cone angles.
Due to the rotational symmetry of CT and observations from previous studies,22, 24, 30 the 2D NPS in the coronal plane is radially symmetric. Thus, a 1D NPS curve was determined by radial averaging of the 2D NPS results to reduce the measurement uncertainty and to enable a more straightforward graphic comparison of the NPS results with different acquisition and reconstruction parameters.
When the 1D NPS curves have very similar shapes and the only difference is the magnitude, the 0D NPS or variance of the noise data was determined by integrating the 1D NPS curve. Under these conditions, the variance can be directly used as an index to evaluate the system noise level with different acquisition and reconstruction parameters.
In this study, the majority of the comparisons of the NPS results were performed with 1D NPS and 0D NPS with the above two conditions strictly confirmed.
Noise aliasing
To have a faithful measurement of the noise power properties of a specific CT system, noise aliasing has to be avoided by careful selection of the combination of the reconstruction FOV and image matrix size. Aliasing is a very common phenomenon involved with discrete sampling of a continuous signal. As stated by the Nyquist–Shannon sampling theorem,34 if an inadequate sampling rate is used (i.e., less than twice that of the continuous signal bandwidth), it is possible to have the frequency spectrum of the continuous signal to wrap around the sampling frequency. Thus, the resulting spectrum of the discrete signal after sampling can be distorted.
The Nyquist–Shannon sampling theorem can be applied to bCT image analysis naturally, just as a two-dimensional extension. The aliasing is also two dimensional, as illustrated by Kijewski and Judy.22 The reconstructed CT image array is a group of discrete samples of the continuous signal synthesized from the backprojection of the filtered projection images. The continuous signal is band limited and the bandwidth is determined by the pixel size of the projection image. Here we define the bandwidth as the “projection Nyquist frequency,” fN-P, by
| (3) |
where dpix is the original element size of the detector and Mag is the geometric magnification factor of the bCT system. When the detector is operating in the 2×2 mode with an effective detector element size of 0.388 mm and Mag=1.91, the corresponding “projection Nyquist” frequency is 2.46 mm−1. To sample a continuous signal with a bandwidth of 2.46 mm−1, the minimal sampling frequency to avoid signal aliasing is 4.92 mm−1. Since the reconstructed coronal CT image is two dimensional, this limitation is for all the angular directions in the spatial frequency domain. This defines a circular region with a minimal radius in the two-dimensional frequency domain. As a preliminary step for bCT noise power measurement, noise aliasing was investigated by varying the reconstruction FOV and matrix size.
RESULTS
3D NPS
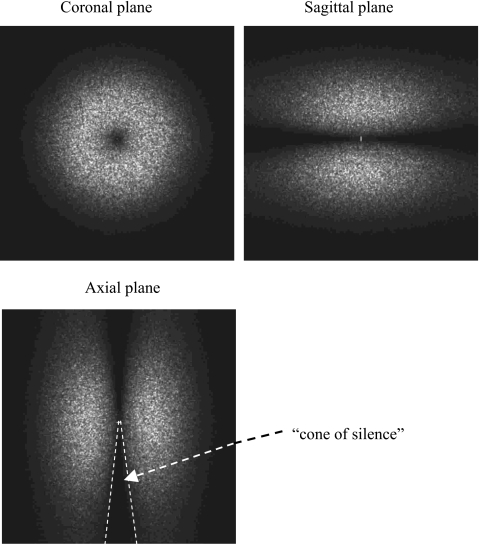
Figure 3 shows three orthogonal views of the 3D NPS from bCT. These data demonstrate the radial symmetry of the NPS in the coronal plane. This observation provides validation for the radial averaging method to convert 2D NPS into the 1D NPS in this study. As a classical demonstration of the noise power (also the signal power) of cone-beam CT system, a 3D missing cone was apparent from the 3D NPS data. The size and shape of this “cone of silence” reflects the insufficient sampling in Fourier space of the cone-beam scan.
Figure 3.
3D NPS result from bCT. The 3D NPS is shown in three orthogonal views.
Even though the 3D NPS is the most intuitive approach to evaluate the noise power properties of the cone-beam CT system, the 2D, 1D, or 0D NPS are more useful to make direct comparisons. In particular, the 2D NPS calculated from coronal CT images has a direct impact on the imaging task since the coronal plane is the native plane reconstructed for the bCT system.
Interpolation methods
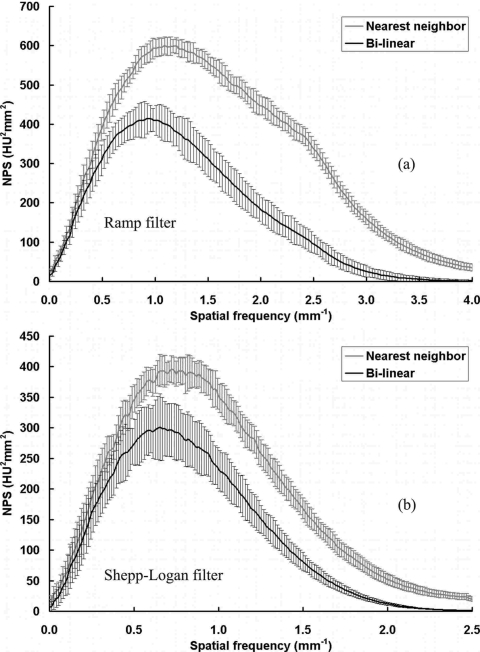
The bCT NPS results were first examined with two different interpolation methods used in the reconstruction. As shown in Fig. 4, nearest neighbor interpolation generates higher noise power in the bCT image, as expected. The results shown in all subsequent figures were reconstructed with the bilinear interpolation since it gives more accurate reconstruction results in practice and is used as the routine reconstruction protocol for bCT in our laboratory.
Figure 4.
NPS results with different interpolation methods. NPS results from a 156 mm phantom scan with 80 kVp, 7 mA (3.40 mGy air kerma), 500 views. (a) Ramp filter; (b) Shepp–Logan filter.
Noise aliasing
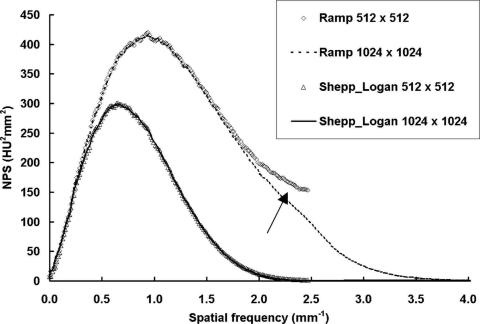
Figure 5 shows NPS results from a single pair of scans, reconstructed with two different filters (ramp and Shepp–Logan) and matrix sizes (1024×1024 and 512×512). As described in Sec. 2B.: The reconstruction FOV was 103.8×103.8 mm2. The corresponding Nyquist frequency for the CT images, fN-CT, was 4.93 and 2.47 mm−1 for the 10242 and 5122 matrices, respectively. As shown in these one-dimensional (radially resampled) NPS results, when the sampling frequency, fN-CT, was less than two times the projection Nyquist, fN-P, the aliased noise is clearly shown in the case of the ramp filter (see arrow). When the Shepp–Logan filter was used for reconstruction, only the projection Nyquist, fN-P, was needed to avoid aliasing due to the apodizing nature of the Shepp–Logan filter. Thus the reconstruction parameters for all the coronal NPS calculation in this study were selected as: FOV: 103.8×103.8 mm2; matrix size: 1024×1024 for ramp filter and 512×512 for Shepp–Logan filter.
Figure 5.
NPS results with different sampling frequencies. NPS results from a 156 mm phantom scan with 80 kVp, 7 mA (3.40 mGy air kerma), 500 views. The reconstruction FOV was 103.8×103.8 mm2. With the ramp filter and a 512×512 matrix, noise aliasing is clearly visible (arrow).
With the above FOV and matrix size selection, the noise power results presented in this work are not significantly affected by aliasing caused from inadequate sampling in the CT image.
Coronal slice thickness
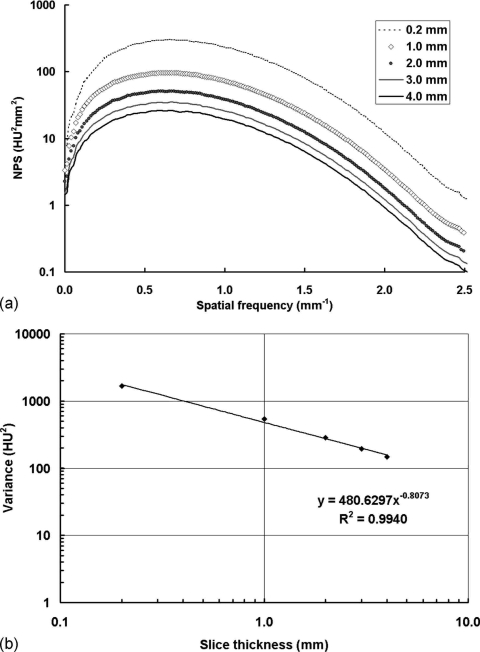
Figure 6 shows the NPS results with different coronal slice thickness. All the NPS curves shown in Fig. 6a have very similar shapes. Thus, the 0D NPS, (i.e., image variance) can be used directly to evaluate the influence of slice thickness on noise power. As shown in Fig. 6b, the image variance is related to the slice thickness by a power function, with a power of −0.8073. Thus, the image variance decreases as the slice thickness increases.
Figure 6.
NPS results with different coronal slice thickness. NPS results with the Shepp–Logan filter from a 156 mm phantom scan with 80 kVp, 7 mA (3.40 mGy air kerma), 500 views. The reconstruction FOV was 103.8×103.8 mm2. (a) The noise power decreases with increasing slice thickness; (b) the image variance decreases with increasing slice thickness.
Coronal plane NPS at different cone angles
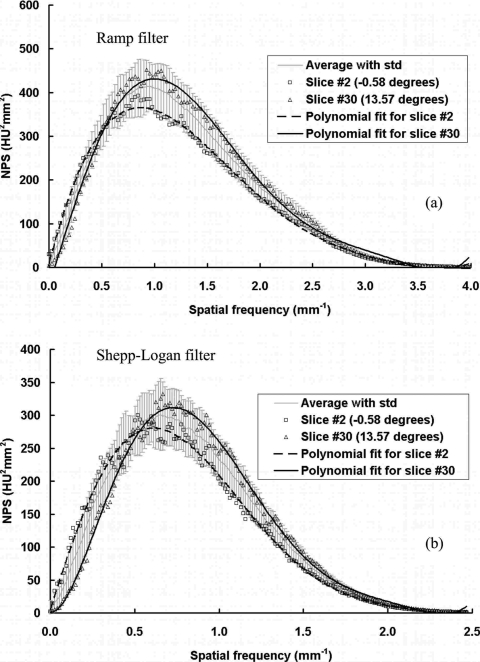
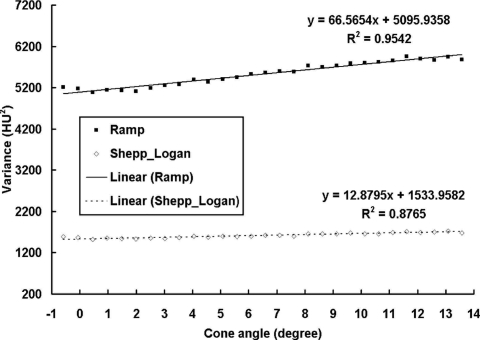
The coronal plane NPS results were evaluated as a function of different cone angle or different slice position for each scan. A total of 29 slices with cone angle ranged from −0.58° to 13.57° were reconstructed. Due to the limited number of ROIs available for each slice (4 for 512×512 images and 16 for 1024×1024 images), the 1D NPS results were noisy even after radial averaging, as shown in Fig. 7. To demonstrate the trend of NPS as a function of cone angle without the effect from measurement noise, a sixth order polynomial curve fitting was also applied to each set of data. The results shown in Fig. 7 demonstrate a slight frequency shift of the NPS with increasing cone angle, for both the ramp and Shepp–Logan filters. The NPS has slightly lower power at low frequencies and higher power at higher frequencies for a cone angle close to 0°, compared to a cone angle of 13.57°. This difference, however, remains a very minor effect on the overall NPS values. Even though the highest peak of the NPS results increases as the cone angle increases, the overall noise power (the total area under the NPS curve) actually increases slightly with the cone angle. Figure 8 shows the overall image variance, as a function of cone angle. As can be seen by the linear fit results, the image variance increases slightly as the cone angle increases.
Figure 7.
NPS results at different cone angles. NPS results are shown at different cone angles: (a) With the ramp filter; (b) with the Shepp–Logan filter. Sixth order polynomial fits were applied to the first and last slice. The results averaged from all the 29 slices with standard deviations are also shown.
Figure 8.
BCT image variance at different cone angles. Image variance results are shown at different cone angles, with the linear fits illustrated as well. The image variance increases very slightly as a function of increasing cone angle.
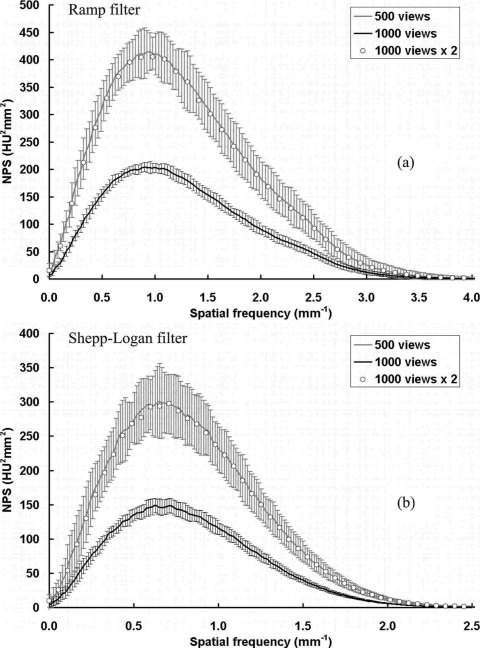
As shown in Fig. 7, the averaged 1D NPS results from 29 slices can be very representative for each scan. With this averaging strategy, the measured noise was reduced due to the increased number of ROIs (116 for 512×512 images and 464 for 1024×1024 images) and the polynomial fitting was not necessary. Thus, the NPS results shown in the previous and following sections were all determined from the average results over 29 slices through all different cone angles and the uncertainties can also be determined by ± one standard deviation of every 29 slices, such as the error bars shown in Figs. 411.
Figure 11.
NPS results with different number of projection views. NPS results are shown with different numbers of projection images per scan: (a) With the ramp filter; (b) with the Shepp–Logan filter. The bCT image noise power is inversely proportional to the total number of projection images used in the reconstruction.
Coronal plane NPS at different dose levels
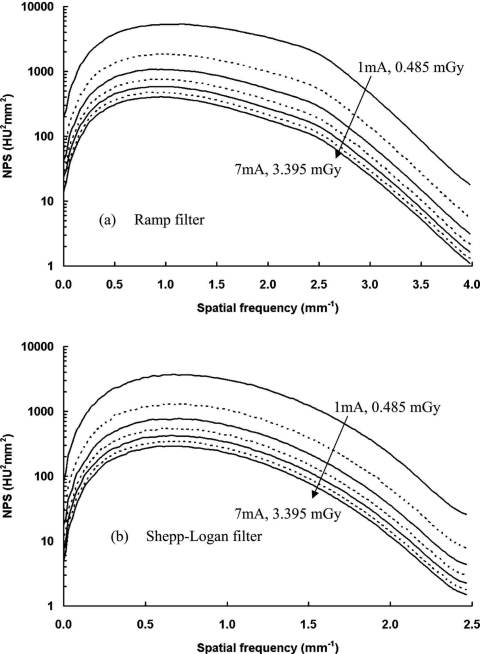
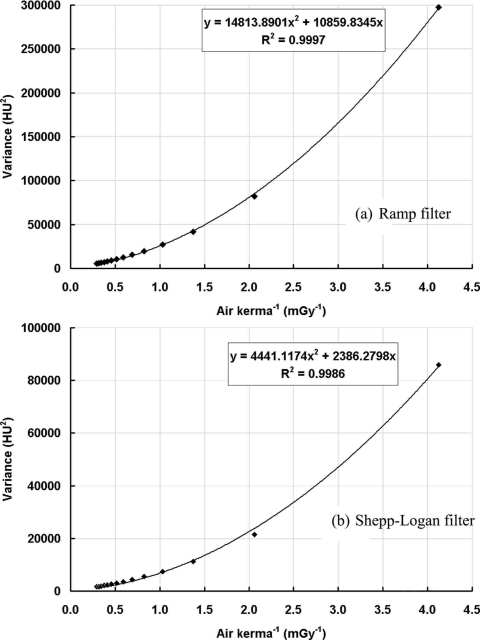
The coronal plane NPS results were computed from scans with a number of different dose levels (air kerma in mGy) which directly determine the amount of x-ray photons passing through the object. As shown in Fig. 9, with the increase of the air kerma, the noise power decreases, while the NPS curves are very similar in shape, determined in part by the reconstruction filter. Figure 10 shows the image variance as a function of the reciprocal of the air kerma. A quadratic function can be fitted for the data points measured at different air kerma levels as: σ2=ax2+bx, where x is the reciprocal of the total dose used, and a and b are two free variables determined from the fitting. The true physical meaning of a and b is beyond the scope of this study and remains as a work in progress for future studies.
Figure 9.
NPS results at different dose levels. NPS results are shown at different dose levels: (a) With the ramp filter; (b) with the Shepp–Logan filter. A logarithm scale was used to display the large range of data. Tube currents were selected from 1 to 7 mA with a 1 mA increment. The corresponding air kerma measured at the isocenter ranged from 0.485 to 3.395 mGy.
Figure 10.
BCT image variance with different dose levels. Image variance is shown as a function of dose level: (a) With the ramp filter; (b) with the Shepp–Logan filter. A quadratic fitting was applied to fit the variance to the reciprocal of the air kerma.
Coronal plane NPS at different number of projection images
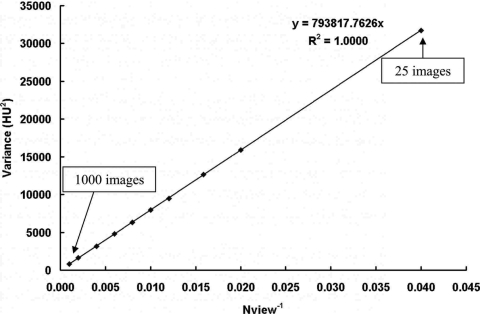
Figure 11 shows the comparison of coronal plane NPS results from bCT scans with 500 and 1000 projection images. All other acquisition and reconstruction parameters were kept identical. As shown in Fig. 11, a 1000-view scan has exactly half of the noise power compared with a 500-view scan. Figure 12 shows the 0D NPS (image variance) as a function of the reciprocal of the total number of images, Nview. A linear function can be fitted onto the data as σ2=kNview−1, which indicates that the bCT image noise power decreases proportionally as the total number of projection images increases. This can be simply explained because by increasing the total number of projection images, the bCT image noise power reduces because more photons are used during the scan. Thus, the bCT image noise power is inversely proportional to the total radiation dose per scan, as expected.
Figure 12.
BCT image variance with different number of projection images. Image variance is shown as a function of the total number of projection images. The image variance has a linear relationship with the reciprocal of the total number of images, Nview ranging from 25 to 1000 images.
Coronal plane NPS for different x-ray spectra
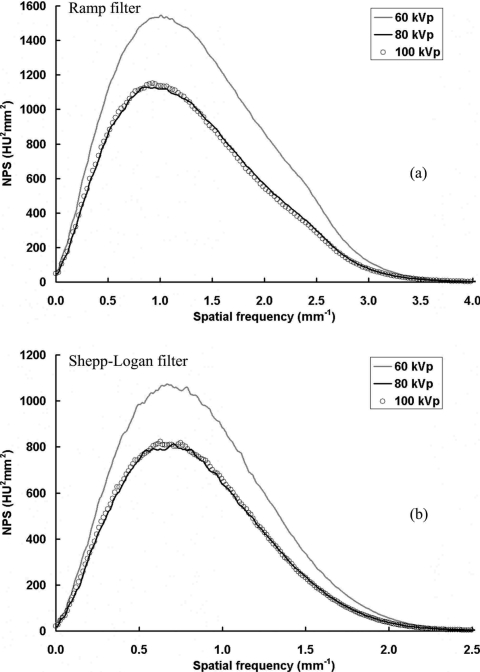
The coronal plane NPS results are compared in Fig. 13, with three different x-ray spectra of 60, 80, and 100 kVp. The radiation dose deposited into the object was kept the same to the extent possible, as determined from previous Monte Carlo simulation results,35 where the mean glandular dose (MGD) to the entire breast was determined to match the MGD from a two-view mammography for the same sized breast. From the results shown in Fig. 13, the noise power with 60 kVp is much higher than that with 80 or 100 kVp. When 60 kVp is used with the “mAs” level to keep the mean glandular dose to the breast the same, fewer photons exit the breast to generate signal in the detector and thus the noise power increases relative to the higher “kVps” evaluated. These values are representative of the 33 ms detector integration time, and different “mAs” levels which produce different NPS.
Figure 13.
NPS results at different x-ray spectrum. NPS results are shown with three different x-ray spectrum: (a) With the ramp filter; (b) with the Shepp–Logan filter. The total dose received by the object was kept the same. The image noise power is much higher for the 60 kVp than at 80 or 100 kVp.
Coronal plane NPS for different object diameters
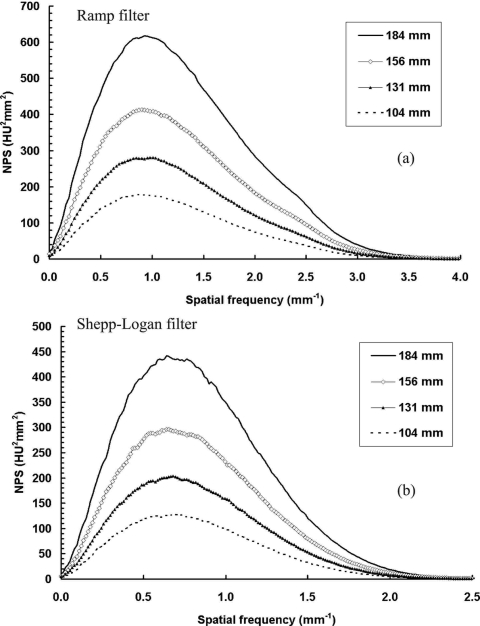
The coronal plane NPS results from scans with four different diameters of polyethylene cylinders are shown in Figs. 1415. For Fig. 14, all the cylinders were scanned with a maximal exposure level (7 mA, 3.40 mGy air kerma for the current bCT system). The bCT noise power increases as the cylinder diameter increases for both reconstruction filters.
Figure 14.
NPS results with different object sizes with constant exposure. NPS results are shown with four different object sizes: (a) With the ramp filter; (b) with the Shepp–Logan filter. The total exposure level was kept the same by setting the tube current at the maximal (7 mA, 3.40 mGy air kerma). The image noise power increases with the increase of the object diameter.
Figure 15.
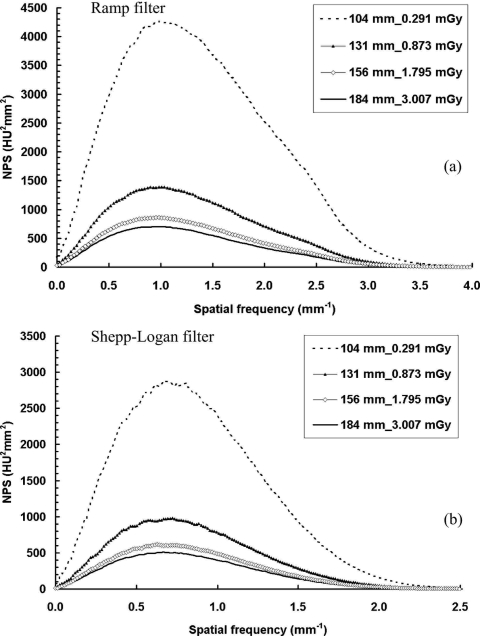
NPS results with different object sizes with constant dose. NPS results are shown with four different object sizes: (a) With the ramp filter; (b) with the Shepp–Logan filter. The total dose level to the object was kept the same as two-view mammography, determined from Monte Carlo simulation. The image noise power increases with decreasing object diameter.
For Fig. 15, all the cylinders were scanned with the corresponding x-ray technique that kept the radiation dose identical to a two-view mammography for the same sized cylinder (or breast).35 It is interesting that the noise power decreases as the cylinder diameter increases even though the radiation dose to the object was very similar. This is related to the results shown in Fig. 10, which show that the noise power does not have a linear relationship with the radiation dose. The abnormally high noise level for two smaller sized cylinders is likely due to the increasingly dominant role of electronic noise generated from the flat panel detector.36
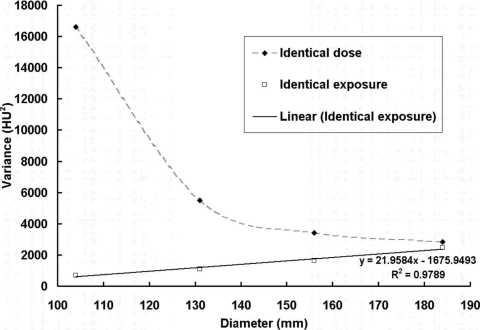
Figure 16 shows the image variance as a function of the diameter of the object for two different scan situations described above. As shown from this figure, when the exposure level (tube current or air kerma used for scan) is kept constant, the image variance has a linear relationship with the object diameter.
Figure 16.
BCT image variance with different object sizes. Image variance is shown as a function of the object diameter under two different scan situations shown in Figs. 1314. A linear fit was applied to the data points with identical exposure. When the exposure level (tube current or air kerma used for scan) is kept constant, the image variance has a linear relationship with object diameter.
SUMMARY AND DISCUSSION
In this work, the noise properties of a cone-beam CT scanner were measured on a dedicated breast CT system using the multidimensional NPS as the metric under a number of system acquisition and reconstruction parameters. The effects on image noise power from different system parameters were investigated.
The cone-beam CT noise power spectrum is rotational symmetric within the coronal plane (the plane parallel to the system rotation plane) and its shape is largely determined by the interpolation method and filter used in the cone-beam reconstruction. For a cone angle range from about 0° to 14°, the shape of the NPS curve changes slightly with different cone angles, while the image variance increases very slightly with the increase of the cone angle. The NPS within the axial plane or the sagittal plane are not rotational symmetric (Fig. 3). The horizontal distribution is determined by the interpolation method and filter used in reconstruction, similar as the coronal plane NPS. The vertical distribution does not depend on the reconstruction filter.
The reconstruction FOV size and image matrix size together determines the coronal plane sampling frequency. Noise aliasing can be avoided if the sampling frequency of CT image is beyond a specific threshold which depends on the shape of the reconstruction filter. The coronal plane noise power is also affected by the slice thickness and decreases with increasing slice thickness.
It is worth noting that in this study only the filtered-backprojection based cone-beam reconstruction algorithm (FDK method)31 was used to reconstruct bCT images. With the development of other reconstruction algorithms, including iterative methods and even exact analytical methods, the resulted CT data may have different noise power properties and such comparisons remain a very interesting topic for future studies. Some iterative reconstruction methods are nonlinear processes and the concept of NPS may not even be applicable.37
The relationship between the NPS and the radiation dose per CT scan is complicated. If the total scan dose is increased by linearly increasing the total number of projection images but not the exposure (i.e., the dose or air kerma per frame is kept constant), the noise power has an inverse linear relationship with the dose level, e.g., the noise power is exactly half when the total number of projection images is doubled.
How will the image noise behave if the total dose is kept constant, while the total number of projections is increased or decreased by a factor of n? For increasing numbers of projection images, the dose per projection will decrease by a factor of n, and vice versa. As derived in the Appendix, with the same total dose, using fewer projection images provides lower image noise power in the CT image. However, using fewer projection images has also been found to reduce image resolution in bCT.17, 18 Using fewer images with FDK reconstruction can also generate artifacts due to inadequate angular sampling. Thus, the optimal number of projection images for bCT reconstruction should be determined considering the trade-off between image resolution and noise power.
When the radiation dose level is kept constant, the image noise also depends on the x-ray spectrum and the object size. For example, with a 60 kVp spectra, the noise level is much higher than with an 80 kVp under the identical dose situation. The image noise with a 184 mm diameter object is much lower than that with a 104 mm diameter object.
NPS in CT exhibit an important property that the NPS decreases as the exposure increases. This is similar to that of systems in which the output depends on the logarithm of the exposure on the detector, such as screen-film systems.38, 39, 40 X-ray imaging systems in which the signal is normalized by the incident exposure also have the same dependence. Some x-ray imaging systems may not have this property, such as digital detectors with linear responses to the incident exposure level. Care should be taken when conducting comparisons of noise properties across different types of imaging systems.
Quantitative results from this noise power analysis, together with the investigation of the resolution properties, provide guidance for the bCT system operation, optimization, and data reconstruction. The intention of this study was to characterize the quantum noise properties of the bCT system using uniform objects, as a first step towards the complete noise property description of bCT, which also includes the evaluation of the breast anatomical noise.
ACKNOWLEDGMENTS
The authors would like to thank the anonymous reviewers and the associated editor for their insightful comments and constructive suggestions to improve the quality of this manuscript. They also would like to thank Dr. Norbert J. Pelc at Stanford University for the inspirational discussion related with CT NPS. This work was supported by a grant from the National Institute for Biomedical Imaging and Bioengineering (Grant No. R01 EB002138).
APPENDIX: NPS VS. NUMBER OF PROJECTIONS
This appendix is devoted to compare the image noise when the total scan dose is kept constant and the total number of projections is increased (or decreased) by a factor of n. This process can be achieved with following two independent steps, assume the 0D NPS or the image variance, σ2 is used as the measure of the noise level.
Step 1. Change the number of projections by a factor of n, keep the dose per projection the same, then the noise power has an inverse linear relationship with the number of projections n. Assuming that the original variance is , after the first step
Step 2. Keep the total number of projections the same from step 1, and change the total dose by a factor of n.
After the above two steps, the total dose is kept unchanged and the total number of projections is changed by a factor of n.
From the results of Fig. 10, the image variance after steps 1 and 2 can be determined by
where x1 and x2 are the reciprocal of the total dose after steps 1 and 2, with a relationship as x2=nx1.
Thus, we can compare the image variances before and after the above two steps, and ,
If n<1, then . This indicates that with the same amount of total dose, using fewer images provides lower image noise power in the CT image.
References
- Gayou O. and Miften M., “Commissioning and clinical implementation of a mega-voltage cone beam CT system for treatment localization,” Med. Phys. 10.1118/1.2752374 34(8), 3183–3192 (2007). [DOI] [PubMed] [Google Scholar]
- Kakeda S., Korogi Y., Miyaguni Y., Moriya J., Ohnari N., Oda N., Nishino K., and Miyamoto W., “A cone-beam volume CT using a 3D angiography system with a flat panel detector of direct conversion type: Usefulness for superselective intra-arterial chemotherapy for head and neck tumors,” AJNR Am. J. Neuroradiol. 28(9), 1783–1788 (2007). [DOI] [PMC free article] [PubMed] [Google Scholar]
- Showalter T. N., Nawaz A. O., Xiao Y., Galvin J. M., and Valicenti R. K., “A cone beam CT-based study for clinical target definition using pelvic anatomy during postprostatectomy radiotherapy,” Int. J. Radiat. Oncol., Biol., Phys. 70(2), 431–436 (2008). [DOI] [PubMed] [Google Scholar]
- Stavropoulos A. and Wenzel A., “Accuracy of cone beam dental CT, intraoral digital and conventional film radiography for the detection of periapical lesions. An ex vivo study in pig jaws,” Clin. Oral Investig. 11(1), 101–106 (2007). [DOI] [PubMed] [Google Scholar]
- Tward D. J., Siewerdsen J. H., Daly M. J., Richard S., Moseley D. J., Jaffray D. A., and Paul N. S., “Soft-tissue detectability in cone-beam CT: Evaluation by 2AFC tests in relation to physical performance metrics,” Med. Phys. 10.1118/1.2790586 34(11), 4459–4471 (2007). [DOI] [PubMed] [Google Scholar]
- Wang Z., Wu Q. J., Marks L. B., Larrier N., and Yin F. F., “Cone-beam CT localization of internal target volumes for stereotactic body radiotherapy of lung lesions,” Int. J. Radiat. Oncol., Biol., Phys. 69(5), 1618–1624 (2007). [DOI] [PubMed] [Google Scholar]
- Boone J. M., Kwan A. L., Yang K., Burkett G. W., Lindfors K. K., and Nelson T. R., “Computed tomography for imaging the breast,” J. Mammary Gland Biol Neoplasia 11(2), 103–111 (2006). [DOI] [PubMed] [Google Scholar]
- Boone J. M. and Lindfors K. K., “Breast CT: Potential for breast cancer screening and diagnosis,” Future Oncol 2(3), 351–356 (2006). [DOI] [PubMed] [Google Scholar]
- Boone J. M., Nelson T. R., Lindfors K. K., and Seibert J. A., “Dedicated breast CT: Radiation dose and image quality evaluation,” Radiology 10.1148/radiol.2213010334 221(3), 657–667 (2001). [DOI] [PubMed] [Google Scholar]
- Lindfors K. K., Boone J. M., Nelson T. R., Yang K., Kwan A. L., and Miller D. F., “Dedicated breast CT: Initial clinical experience,” Radiology 10.1148/radiol.2463070410 246(3), 725–733 (2008). [DOI] [PMC free article] [PubMed] [Google Scholar]
- Chen B. and Ning R., “Cone-beam volume CT breast imaging: Feasibility study,” Med. Phys. 10.1118/1.1461843 29(5), 755–770 (2002). [DOI] [PubMed] [Google Scholar]
- Chen Z. and Ning R., “Why should breast tumour detection go three dimensional?,” Phys. Med. Biol. 10.1088/0031-9155/48/14/312 48(14), 2217–2228 (2003). [DOI] [PubMed] [Google Scholar]
- Glick S. J., Thacker S., Gong X., and Liu B., “Evaluating the impact of x-ray spectral shape on image quality in flat-panel CT breast imaging,” Med. Phys. 10.1118/1.2388574 34(1), 5–24 (2007). [DOI] [PubMed] [Google Scholar]
- Gong X., Glick S. J., Liu B., Vedula A. A., and Thacker S., “A computer simulation study comparing lesion detection accuracy with digital mammography, breast tomosynthesis, and cone-beam CT breast imaging,” Med. Phys. 10.1118/1.2174127 33(4), 1041–1052 (2006). [DOI] [PubMed] [Google Scholar]
- Lai C. J., Shaw C. C., Chen L., Altunbas M. C., Liu X., Han T., Wang T., Yang W. T., Whitman G. J., and Tu S. J., “Visibility of microcalcification in cone beam breast CT: Effects of x-ray tube voltage and radiation dose,” Med. Phys. 10.1118/1.2745921 34(7), 2995–3004 (2007). [DOI] [PMC free article] [PubMed] [Google Scholar]
- Yang W. T., Carkaci S., Chen L., Lai C. J., Sahin A., Whitman G. J., and Shaw C. C., “Dedicated cone-beam breast CT: Feasibility study with surgical mastectomy specimens,” AJR, Am. J. Roentgenol. 189(6), 1312–1315 (2007). [DOI] [PMC free article] [PubMed] [Google Scholar]
- Kwan A. L., Boone J. M., Yang K., and Huang S. Y., “Evaluation of the spatial resolution characteristics of a cone-beam breast CT scanner,” Med. Phys. 10.1118/1.2400830 34(1), 275–281 (2007). [DOI] [PubMed] [Google Scholar]
- Yang K., Kwan A. L., and Boone J. M., “Computer modeling of the spatial resolution properties of a dedicated breast CT system,” Med. Phys. 10.1118/1.2737263 34(6), 2059–2069 (2007). [DOI] [PMC free article] [PubMed] [Google Scholar]
- J. T.DobbinsIII, Ergun D. L., Rutz L., Hinshaw D. A., Blume H., and Clark D. C., “DQE(f) of four generations of computed radiography acquisition devices,” Med. Phys. 10.1118/1.597627 22(10), 1581–1593 (1995). [DOI] [PubMed] [Google Scholar]
- Droege R. T. and Morin R. L., “A practical method to measure the MTF of CT scanners,” Med. Phys. 10.1118/1.595124 9(5), 758–760 (1982). [DOI] [PubMed] [Google Scholar]
- Hanson K. M., “Detectability in computed tomographic images,” Med. Phys. 10.1118/1.594534 6(5), 441–451 (1979). [DOI] [PubMed] [Google Scholar]
- Kijewski M. F. and Judy P. F., “The noise power spectrum of CT images,” Phys. Med. Biol. 10.1088/0031-9155/32/5/003 32(5), 565–575 (1987). [DOI] [PubMed] [Google Scholar]
- Riederer S. J., “Application of the noise power spectrum to positron emission CT self-absorption correction,” Med. Phys. 10.1118/1.594937 8(2), 220–224 (1981). [DOI] [PubMed] [Google Scholar]
- Siewerdsen J. H., Cunningham I. A., and Jaffray D. A., “A framework for noise-power spectrum analysis of multidimensional images,” Med. Phys. 10.1118/1.1513158 29(11), 2655–2671 (2002). [DOI] [PubMed] [Google Scholar]
- ICRU (International Commission on Radiation Units and Measurements) 1996 Medical Imaging—The Assessment of Image Quality ICRU Report 54 (ICRU, Bethesda, MD, 1996). [Google Scholar]
- Boone J. M., “Determination of the presampled MTF in computed tomography,” Med. Phys. 10.1118/1.1350438 28, 356 (2001). [DOI] [PubMed] [Google Scholar]
- Siewerdsen J. H. and Jaffray D. A., “Three-dimensional NEQ transfer characteristics of volume CT using direct-and indirect-detection flat-panel imagers,” Proc. SPIE 10.1117/12.479970 5030, 92 (2003). [DOI] [Google Scholar]
- Chesler D. A., Riederer S. J., and Pelc N. J., “Noise due to photon counting statistics in computed x-ray tomography,” J. Comput. Assist. Tomogr. 10.1097/00004728-197701000-00009 1(1), 64–74 (1977). [DOI] [PubMed] [Google Scholar]
- Riederer S. J., Pelc N. J., and Chesler D. A., “The noise power spectrum in computed x-ray tomography,” Phys. Med. Biol. 10.1088/0031-9155/23/3/008 23(3), 446–454 (1978). [DOI] [PubMed] [Google Scholar]
- Boedeker K. L., Cooper V. N., and McNitt-Gray M. F., “Application of the noise power spectrum in modern diagnostic MDCT: Part I. Measurement of noise power spectra and noise equivalent quanta,” Phys. Med. Biol. 52(14), 4027–4046 (2007). [DOI] [PubMed] [Google Scholar]
- Feldkamp L. A., Davis L. C., and Kress J. W., “Practical cone-beam algorithm,” J. Opt. Soc. Am. A 1(6), 612–619 (1984). [Google Scholar]
- Kak A. C. and Slaney M., Principles of Computerized Tomographic Imaging (IEEE, New York, 1988). [Google Scholar]
- Zarowski C. J., An Introduction to Numerical Analysis for Electrical and Computer (Wiley, New York, 2004). [Google Scholar]
- Shannon C. E., “Communication in the presence of noise,” Proc. IEEE 72(9), 1192–1201 (1984). [Google Scholar]
- Boone J. M., Kwan A. L., Seibert J. A., Shah N., Lindfors K. K., and Nelson T. R., “Technique factors and their relationship to radiation dose in pendant geometry breast CT,” Med. Phys. 10.1118/1.2128126 32(12), 3767–3776 (2005). [DOI] [PubMed] [Google Scholar]
- Kwan A. L. C., Yang K., Packard N. J., and Boone J. M., RSNA 2006 (RSNA, Chicago, 2006).
- Wang G., Yu H., and De Man B., “An outlook on x-ray CT research and development,” Med. Phys. 10.1118/1.2836950 35(3), 1051–1064 (2008). [DOI] [PubMed] [Google Scholar]
- Dainty J. C. and Shaw R., Image Science (Academic, London, 1974). [Google Scholar]
- Barnes G. T., “Radiographic mottle: A comprehensive theory,” Med. Phys. 10.1118/1.595126 9(5), 656–667 (1982). [DOI] [PubMed] [Google Scholar]
- Nishikawa R. M. and Yaffe M. J., “Signal-to-noise properties of mammographic film-screen systems,” Med. Phys. 10.1118/1.595781 12(1), 32–39 (1985). [DOI] [PubMed] [Google Scholar]


