Abstract
A computerized regional registration and characterization system for analysis of microcalcification clusters on serial mammograms is being developed in our laboratory. The system consists of two stages. In the first stage, based on the location of a detected cluster on the current mammogram, a regional registration procedure identifies the local area on the prior that may contain the corresponding cluster. A search program is used to detect cluster candidates within the local area. The detected cluster on the current image is then paired with the cluster candidates on the prior image to form true (TP-TP) or false (TP-FP) pairs. Automatically extracted features were used in a newly designed correspondence classifier to reduce the number of false pairs. In the second stage, a temporal classifier, based on both current and prior information, is used if a cluster has been detected on the prior image, and a current classifier, based on current information alone, is used if no prior cluster has been detected. The data set used in this study consisted of 261 serial pairs containing biopsy-proven calcification clusters. An MQSA radiologist identified the corresponding clusters on the mammograms. On the priors, the radiologist rated the subtlety of 30 clusters (out of the 261 clusters) as 9 or 10 on a scale of 1 (very obvious) to 10 (very subtle). Leave-one-case-out resampling was used for feature selection and classification in both the correspondence and malignant∕benign classification schemes. The search program detected 91.2% (238∕261) of the clusters on the priors with an average of 0.42 FPs∕image. The correspondence classifier identified 86.6% (226∕261) of the TP-TP pairs with 20 false matches (0.08 FPs∕image) relative to the entire set of 261 image pairs. In the malignant∕benign classification stage the temporal classifier achieved a test Az of 0.81 for the 246 pairs which contained a detection on the prior. In addition, a classifier was designed by using the clusters on the current mammograms only. It achieved a test Az of 0.72 in classifying the clusters as malignant and benign. The difference between the performance of the temporal classifier and the current classifier was statistically significant (p=0.0014). Our interval change analysis system can detect the corresponding cluster on the prior mammogram with high sensitivity, and classify them with a satisfactory accuracy.
Keywords: computer-aided diagnosis, interval changes, microcalcification classification, feature analysis, mammography, malignancy
INTRODUCTION
Mammography is currently the most effective method for early breast cancer detection.1, 2 Radiologists routinely compare mammograms from a current examination with those obtained in previous years, if available, for identifying interval changes, detecting potential abnormalities, and evaluating breast lesions. It is widely accepted that analysis of interval changes in mammographic features is very useful for both detection and classification of abnormalities.3, 4 A variety of computer-aided diagnosis (CAD) techniques have been developed to detect mammographic abnormalities and to distinguish between malignant and benign lesions. We are studying the use of CAD techniques to assist radiologists in interval change analysis.
Most CAD systems use information from a single examination. These systems have been shown to perform well in lesion classification problems.5, 6, 7, 8, 9, 10, 11, 12, 13, 14 However, when multiple-year mammograms of a lesion are available, new computer vision methods that effectively use the temporal information to improve the differentiation between benign and malignant lesions are required.
The goal of our research is to develop a technique for computerized analysis of temporal differences between a microcalcification cluster on the most recent mammogram and a prior mammogram of the same view.15, 16, 17 The computer system can be used to assist radiologists in evaluating interval changes and distinguishing between malignant and benign microcalcification clusters. It will also be useful for improving the identification of new or developing clusters or for improving classification of malignant and benign clusters in a computer-aided diagnosis system. In our previous studies we have demonstrated that interval change analysis can improve differentiation of malignant and benign masses.18, 19 Timp et al.20 also reported improved classification results based on interval change analysis of masses using their automated registration and characterization system.
The purpose of this study is to develop a computerized system which performs both automated registration and classification of microcalcification clusters on serial mammograms and to evaluate the accuracy of this method. This system is unique in two ways: It includes the automated tasks for both microcalcification cluster registration and classification, and it applies temporal analysis in the cluster classification stage. To our knowledge, this is the first system to perform both automated registration and classification of microcalcification clusters on serial mammograms.
MATERIALS AND METHODS
Data set
In this study, 261 serial mammogram pairs containing biopsy-proven microcalcification clusters were used, of which 94 were biopsy-proven to be malignant and 167 benign. The 261 temporal pairs consisted of a total of 393 unique mammograms from 94 patients. The data collection protocol had been approved by our Institutional Review Board. Patient informed consent was waived for this retrospective study. The mammograms were digitized with a LUMISCAN 85 laser scanner at a pixel resolution of 50 μm×50 μm and 4096 gray levels. The image matrix size was reduced by averaging every 2×2 adjacent pixels and down-sampled by a factor of 2 to obtain images with a pixel size of 100 μm×100 μm for analysis. The 393 mammograms contained different mammographic views (CC, MLO, and lateral views) and multiple examinations of the clusters. The 261 temporal pairs were formed by matching clusters of the same view from two or three different examinations of the same patient. In cases where there were only two examinations available, a single pair was formed for the given view. If there were three examinations, three temporal pairs were formed (first exam paired with second exam, first exam with third exam, and second exam with third exam). Within a pair, the current mammogram was defined as the one with the later date. Therefore, for cases with three consecutive examinations, where three temporal pairs were formed, two of the mammograms for such a case could be termed “current.” Among the 261 temporal pairs there were 221 current mammograms, and 217 prior mammograms based on these definitions. An experienced MQSA radiologist identified the biopsy-proven cluster locations on corresponding mammogram pairs as the reference standard. The radiologist also marked the nipple location on every film.
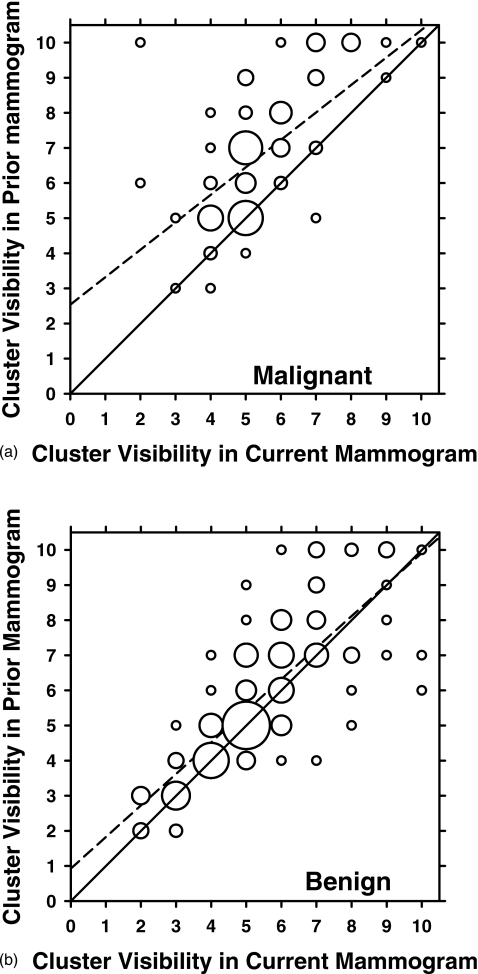
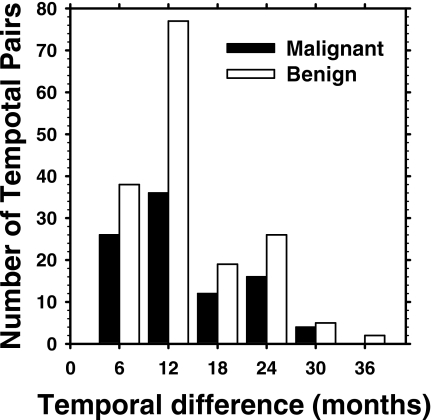
The radiologist rated the visibility of the clusters on the mammograms relative to those encountered in clinical practice on a ten-point scale, with 1 representing the most obvious and 10 representing the subtlest cluster. The visibility of the clusters on the prior mammogram is plotted against that on the current mammogram for the malignant and benign pairs in Figs. 1a, 1b, respectively. It can be seen that the malignant clusters tend to be less visible on the prior mammogram than on the current mammogram [Fig. 1a], while it is difficult to notice such a trend for the benign clusters [Fig. 1b]. The mean difference in the visibility rating between the prior and current mammograms for the malignant cases is 1.40 compared to 0.39 for the benign cases. The correlation coefficient between the visibility ratings for the current and prior clusters is 0.593 for the malignant and 0.791 for the benign clusters. On the priors, the radiologist rated the subtlety of 30 clusters as 9 or 10. A histogram depicting the temporal interval between the current and prior mammograms of the data set is given in Fig. 2. The time interval for the temporal pairs ranges from 3 to 36 months. In addition, the radiologist estimated the cluster sizes as the longest dimension of the cluster on the mammogram. The average cluster sizes for the malignant cases were 10.4 mm on the prior mammograms and 15.0 mm on the current mammograms. The average cluster sizes for the benign cases were 13.0 and 13.7 mm for the prior and current mammograms, respectively.
Figure 1.
Visibility ratings of the microcalcification clusters on the current mammogram plotted against those on the prior mammogram for (a) malignant and (b) benign temporal pairs. The visibility was rated on a ten-point discrete scale (1=most obvious, 10=subtlest). The area of the circles is proportional to the number of data points with the same ratings. The smallest circles in both (a) and (b) represent one data point. The largest circle in (a) represents 15 data points, and the largest circle in (b) represents 29 data points. The solid diagonal line y=x represents equal visibility ratings on the current and prior mammograms. The dashed lines are the linear regression lines for the data fitted as y=0.782x+2.54 for (a) and as y=0.899x+0.925 for (b). The correlation coefficient is 0.593 for the malignant clusters and 0.791 for the benign clusters.
Figure 2.
Temporal interval between the current and the prior mammograms for the 261 pairs in our data set.
Registration of corresponding clusters in serial mammograms
Our automated system consists of two stages: (1) Registration of corresponding clusters on temporal pairs of mammograms, and (2) characterization of the temporal pairs of clusters as malignant or benign. The registration procedure is described below. The characterization methods are described in Sec. 2C.
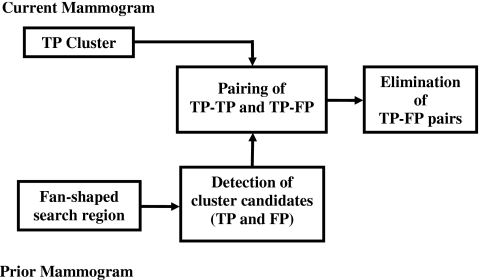
A flowchart outlining the registration procedure is shown in Fig. 3. Initially, a regional registration procedure identifies the local area on the prior mammogram that may contain the corresponding cluster. An automated detection program is used to detect cluster candidates within this local area that may include true positives (TPs) and false positives (FPs). The cluster on the current image is then paired with each of the detected cluster candidates on the prior image to form either true (TP-TP) or false (TP-FP) pairs. A correspondence classifier is used to reduce the false pairs. The individual phases of the registration procedure are described below.
Figure 3.
Block diagram of the regional registration for temporal microcalcification clusters (stage 1).
Identification of local search area on prior mammogram
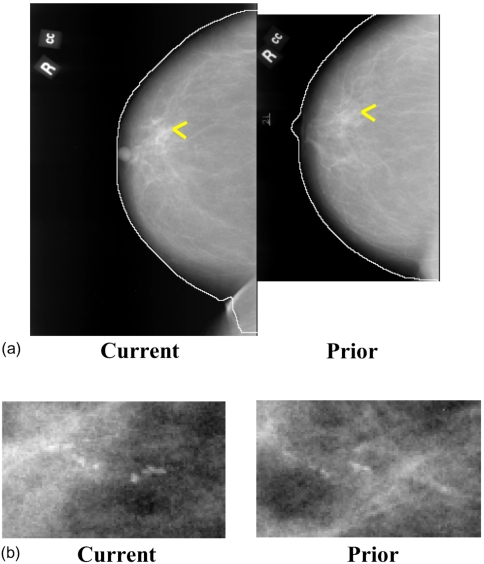
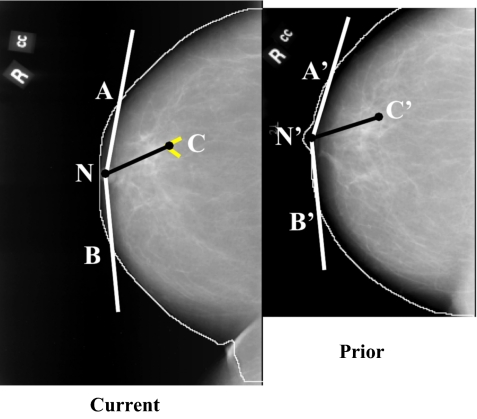
Initially an automated procedure is used to detect the breast boundary on the mammograms [Fig. 4a]. The detailed procedure for identification of a local search area on the prior mammogram is described previously.21 Briefly, the location of the microcalcification cluster on the current mammogram [Fig. 4b] is determined in a polar coordinate system with the nipple as the origin. By using the radial distance Rcurr between the nipple and cluster centroid, ∣NC∣, an arc is drawn which intersects the breast boundary at points A and B (Fig. 5). Three angles are estimated at the radial distance Rcurr: The angle β between NC and NA, the angle φ between NC and NB, and the angle θ between NA and NB (θ=β+φ). The location of the cluster is uniquely specified by Rcurr and the angle β or φ. Using the radial distance Rcurr to draw an arc centered at the nipple centroid N′ on the prior mammogram, the two intersection points A′ and B′ with the breast boundary on the prior mammogram are determined. The angle θp between the radii ∣N′A′∣ and ∣N′B′∣ is estimated. An angular scaling factor α can be calculated as the ratio of the prior and the current angles, α=θp∕θ. In order to predict the angular location of the microcalcification cluster on the prior mammogram, the smaller of the two angles, β and φ, is selected as the angular coordinate of the cluster on the current mammogram. The selected angle, multiplied by the angular scaling factor α, is used as the predicted angle from the corresponding axis on the prior mammogram. The radial distance Rcurr is used to predict the radial position of the microcalcification cluster center on the prior mammogram.
Figure 4.
Temporal pair of mammograms containing microcalcification cluster. (a) Current and prior mammograms with automatically detected breast boundaries, (b) current and prior microcalcification cluster. The current and prior images were obtained 2 years apart.
Figure 5.
Initial estimation of the cluster centroid position on the prior mammogram based on the nipple-cluster distance and the angle between the nipple-cluster axis and breast periphery on the current mammogram.
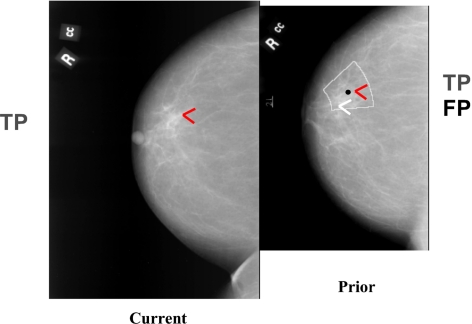
An initial fan-shaped search region is then defined on the prior mammogram centered at the predicted location of the cluster centroid (Fig. 6). The angular width of the fan-shaped region was estimated previously21 as 2ε, and ε has the form ε=0.25+5∕Rcurr, where the constant 5 is in the same unit as Rcurr (mm) and ε is in radians. The radial length of the fan-shaped region was also estimated previously21 to be 2δ, where δ=20 mm. The constants were chosen experimentally on an independent mass data set21 such that the estimated fan-shaped regions will essentially include all masses on the prior mammograms. Similarly, a fan-shaped region centered at the input microcalcification cluster center is defined on the current mammogram. More details on defining the fan-shaped region can be found elsewhere.21
Figure 6.
Definition of an initial fan-shaped search region on the prior mammogram centered at the predicted centroid location (black dot). An automated microcalcification detection program was used to detect cluster candidates [true (TP) and false (FP)] within the search region on the prior. The cluster on the current image is paired with the detected candidates on the corresponding prior image to form true (TP-TP) or false (TP-FP) pairs.
Detection of cluster candidates within the local search area
An automated detection program is used to detect cluster candidates within the local area defined by the fan-shaped region (Fig. 6) in both the current and prior mammograms. The automated program was previously developed in our laboratory for detection of microcalcification clusters on the entire mammogram and the detection results were previously reported.8, 22, 23 In this study two parameters of the detection program, namely, the maximum number of detected signals and the convolution neural network threshold, were adjusted to adapt it for detection in a local region. In brief, the detection program involves three key steps: Preprocessing, segmentation, and classification. In the preprocessing step two filters are applied to the extracted region inside the breast boundary. The first is a signal enhancement filter which enhances potential microcalcifications on the image. The second is a signal suppression filter whose main function is to smooth and remove noise from the image. The two filtered images are subtracted to yield a difference image. Ideally the signal-to-noise ratio (SNR) in this difference image is enhanced such that the low frequency background structures are removed and the high frequency noise is suppressed. In the segmentation stage, candidate signal sites above a global gray level threshold are identified. This threshold is determined automatically by an iterative procedure for which only the maximum number of detected signals (1500) and the maximum number of iterations are preset. At each identified potential signal site, a locally adaptive gray level threshold, derived from an input SNR threshold and the local noise, is used to determine the number of connected pixels above the local threshold. Furthermore, during the segmentation step, signal characteristics to be used in the classification step, such as size, SNR, and maximum contrast are extracted. Signals below a certain size (2 pixels) and larger than 80 pixels are discarded. Signals having a contrast higher than an input SNR threshold (10) are also discarded. A convolution neural network with an output threshold of 0.4 was applied to the individual signals and was used to reduce some of the false positive microcalcification signals. A clustering criterion is applied to the remaining signals to eliminate isolated noise points. The detected cluster candidates within the local region may include TPs and FPs. A cluster candidate is counted as a TP if it overlaps with the cluster identified by the radiologist. Detected clusters that fail to achieve any overlap are considered FPs.
Our CAD system only requires the input of a region of interest (ROI) approximately containing the cluster of interest on the current mammogram. The cluster ROI can be determined by a radiologist or a CAD system. Since this cluster location is known, any other FP cluster that may be detected in the fan-shaped region on the current mammogram is eliminated. Only the detected cluster candidate that overlaps with the input ROI is retained and labeled as a TP. Since the CAD system does not require the radiologist to identify the cluster on the prior mammogram, all clusters detected in the prior are retained. The number of FP clusters on the prior mammogram is reduced using the correspondence classifier described below.
Feature extraction
Morphological features were extracted from the automatically detected microcalcification clusters, which were used both in the correspondence classifier and in the classifiers for characterization of malignant and benign clusters. These features provided information about the size, shape, and orientation of the detected microcalcification clusters, as well as similar information about the signals comprising the clusters. Five different features were extracted from the individual microcalcifications in each cluster as described previously by Chan et al.:8 Signal area, mean density (DENS), eccentricity, moment ratio, and axis ratio. We also defined a new feature, the mean distance (MEAN_DIST), which is the average of the distances between the microcalcification and every other microcalcification in the cluster. In addition, the signal volume was extracted from the individual microcalcifications as previously described by Jiang et al.9 For each of these individual microcalcification features three corresponding cluster features were derived by calculating the average, the standard deviation, and the coefficient of variation (CV) of the feature for the signals within the cluster. Six additional morphological features were extracted from the cluster as a whole. One feature was the total number of microcalcifications in the cluster as described by Chan et al.8 Three features were those described by Jiang et al.:9 Area of cluster, circularity of cluster, and cluster density. Finally, we designed two new types of morphological cluster features. One was the sum of the distances of the calcifications to the centroid of the cluster (SUMDIST), and the other (SDEVQUADS) was calculated by dividing the cluster into four quadrants and computing the standard deviation between the number of microcalcifications located in each of the quadrants. Overall this resulted in a total of 27 (21 cluster features derived from features extracted from individual microcalcifications and six extracted from the cluster as whole) morphological features. Three sets of texture features were also extracted. Texture features were extracted from a rectangular region of interest centered at the centroid of the automatically detected cluster. The size of the rectangular region was 512×512 pixels (approximately 50×50 mm). The extraction of texture features from run length statistics (RLS) matrices was discussed in detail previously.18, 24 Five different texture measures were used: Short run emphasis , long run emphasis (LRE), gray level nonuniformity, run length nonuniformity, and run percentage. These five measures were extracted from either a vertical or a horizontal (H) gradient image and in one of two directions, θ=0°, and θ=90° resulting in a total of 20 RLS features. The extraction of gray level dependence features (GLDS), which measured the coarseness of the texture elements of an image, was also discussed in detail previously.25, 26 Four unique GLDS features were extracted: Angular second momentum, contrast, mean, and entropy. The displacement vector used to compute the GLDS features had a phase of θ=0°, 45°, 90°, or 135° and a distance of either 4 or 12 pixels. This resulted in a total of 32 extracted GLDS features. The third set of texture features consisted of spatial gray level dependence (SGLD) features. The features were computed from two different SGLD matrices [axial (A) and diagonal (D)] at a pixel pair distance of 4 pixels. Thirteen unique features were computed from each of the two SGLD matrices: Correlation, energy, entropy, inertia, inverse difference moment, sum average, sum entropy, difference entropy, information measure for correlation 1, information measure for correlation 2, sum variance, difference variance (DFV), and difference average. This yielded a total of 26 SGLD features. The construction of the SGLD matrices and the computation of the features were discussed in detail elsewhere.7, 27
Correspondence classifier for FP reduction
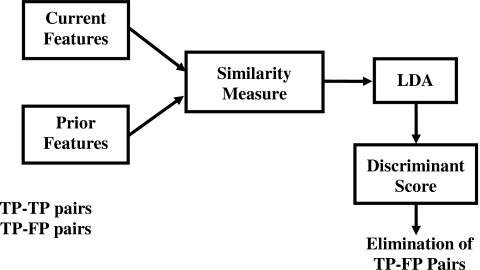
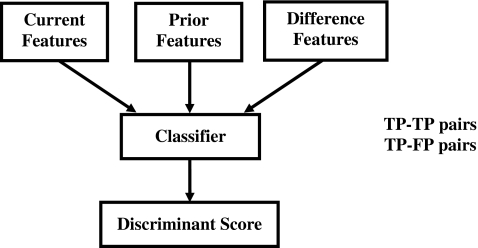
As previously mentioned, the cluster of interest on the current image is paired with the detected candidates on the corresponding prior image to form TP-TP or TP-FP pairs (Fig. 6). The objective of the correspondence classifier is to identify one TP-TP cluster pair for each temporal pair of mammograms while eliminating the TP-FP pairs (Fig. 7).16 A set of 25 morphological features (all morphological features described above except SUMDIST and SDEVQUADS) was extracted from each of the detected cluster candidates from the prior mammograms. Similarly, the same set of morphological features was extracted from the detected microcalcifications on the current mammograms. To utilize the temporal information, a difference feature σdiff, was derived from each pair of corresponding current and prior cluster features as follows:
where σprior and σcurrent are the current and prior features, respectively, for the temporal pair of candidate clusters. Here, the absolute value of the difference between a specific feature from the current cluster and the same feature from the prior cluster is used to compute an exponent with a base arbitrarily chosen to be smaller than one. A large difference between the current and prior features would result in a σdiff value close to 0; conversely, a small difference would result in a σdiff value close to 1.
Figure 7.
Block diagram of the correspondence classifier used to reduce the false pairs (TP-FP).
A leave-one-case-out resampling method was used for stepwise feature selection from the set of 25 available difference morphological features (σdiff). The leave-one-case-out resampling was performed per patient in this and the following classifier design. In a given leave-one-case-out cycle, all temporal pairs corresponding to the same patient were left out during training and the trained classifier was applied to the left-out pairs for testing. A linear discriminant analysis (LDA) classifier was formulated in leave-one-case-out training and testing mode using the selected features. For each temporal pair of mammograms, the candidate cluster pair with the highest test discriminant score (i.e., the highest similarity) was selected. Ideally all of the clusters selected by the classifier on the prior mammograms would be TPs.
Classification of malignant and benign clusters
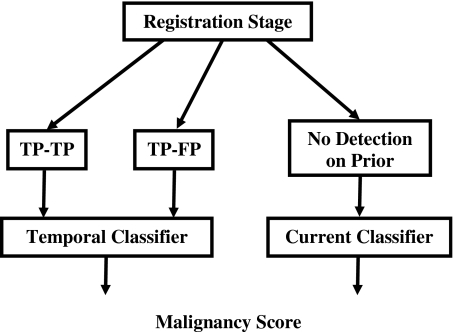
Classification of each temporal cluster pair as malignant and benign can take one of two pathways depending on whether or not a cluster was detected on the prior mammogram for the case (Fig. 8). A temporal classifier (Fig. 9) based on both current and prior information is used if a cluster has been detected on the prior mammogram; otherwise, a current classifier based on information extracted from the current mammogram alone is used.
Figure 8.
Block diagram of classification stage for temporal microcalcification clusters (stage 2).
Figure 9.
Block-diagram of the temporal classifier for classification of malignant and benign microcalcification clusters. Both TP-TP and TP-FP pairs can be input to the system.
Temporal classifier
All 27 unique morphological features described above, along with the 20 RLS texture features, were available to the temporal classifier for the characterization of the cluster cases which had a detection on the prior. We derived four different feature sets, three sets from the 27 morphological features and one set from the RLS texture features, to describe the interval change information for malignant and benign classification.
The first set consisted of the difference features, similar to those for the correspondence classification, each of which was derived from the features of the selected current and prior cluster pair
where σprior and σcurrent are the current and prior features for the specific temporal pair of clusters. The constant in the exponent in the difference feature above was smaller than the one used for the correspondence classifier. This was related to the fact that the correspondence classifier had to distinguish between the true and false microcalcification cluster pairs (larger standard deviation of ∣σprior−σcurrent∣), whereas the temporal malignant-benign classifier had to distinguish between malignant and benign clusters within the set of the true cluster pairs (smaller standard deviation of ∣σprior−σcurrent∣). The smaller constant used for malignant-benign classifier resulted in a normalized difference feature range which is similar to the range of the correspondence classifier.
The second set of 27 morphological features consisted of the features extracted from the current mammogram of each temporal pair. The third set consisted of the features extracted from the prior mammogram of each pair. Finally, a fourth set consisting of RLS texture features was constructed by dividing the RLS feature extracted from the current cluster with the corresponding RLS feature extracted from the prior cluster for each temporal pair. Leave-one-case-out resampling was used for stepwise feature selection from the combined feature space including the four sets of features described above. An LDA classifier was then trained and tested in the leave-one-case-out mode using the selected features.
Current classifier
Since we expect that for some subtle cases there will be no microcalcification detection on the prior mammograms, we have designed a separate classification scheme to classify these cases. In order to perform the malignant-benign classification of the cases without a detection on the prior mammogram, leave-one-case-out resampling feature selection was applied to the 221 current mammograms from the data set of 261 temporal pairs. Features were selected from a feature space containing the 27 morphological features, the 32 GLDS texture features, and the 26 SGLD features. An LDA classifier was trained and tested in the leave-one-case-out mode using the selected features.
Receiver operating characteristic analysis
To evaluate the classifier performance, the training and test discriminant scores were analyzed using receiver operating characteristic (ROC) methodology.28 The discriminant scores of the malignant and benign microcalcification clusters were used as decision variables in the LABROC program,29 which fits a binormal ROC curve based on maximum likelihood estimation. The classification accuracy was evaluated as the area under the ROC curve, Az, and the partial area index30 calculated above a sensitivity threshold of 0.9, .
RESULTS
Registration stage
The objective in this stage was to identify a search area for the corresponding cluster on the prior mammogram based on the location of the detected cluster on the current mammogram. For all 261 cases in this study, the fan-shaped region defined on the prior mammogram enclosed the true location of the microcalcification cluster defined by the radiologist. The average area of the defined fan-shaped search region was 1598 mm2, and the average distance between the centroid of the search region and the center of the true cluster location was 11.04 mm.
Detection stage
A total of 412 cluster candidates were identified by the automated detection program within the fan-shaped regions on the prior mammograms from the set of 261 temporal pairs. In 246 of the 261 prior mammograms at least one cluster was detected, while in the remaining 15 cases there were no cluster candidates detected on the prior mammogram. In 238 of the 246 priors that contained at least one detection, there was an overlap between at least one of the detected clusters and the true location of the cluster from the reference standard. In other words, 91.2% (238∕261) of the temporal pairs included at least one TP detection. Of the total of 412 detected cluster candidates, 110 were FPs, as they did not overlap with the true cluster locations, yielding an FP detection rate of 0.42 (110∕261) FPs∕image. Most of the multiple TP clusters in the search region were caused by the cluster being detected as several smaller clusters.
For a subset of 54 temporal pairs, for which hand-marked individual mirocalcification locations were available, we estimated the microcalcification detection rates of the detection program. We defined a microcalcification true-positive detection ratio (TPD) and a microcalcification false-positive detection ratio (FPD) following Jiang et al.9 as: TPD=TPdet∕TPgold; FPD=(ALLdet−TPdet)∕TPgold, where TPdet was the number of detected TP microcalcifications, TPgold was the number of hand-marked TP microcalcifications, and ALLdet was the number of all detected microcalcification candidates. For the current mammograms the TPD was 72% with an FPD of 148%. For the prior mammograms the TPD was 68% with an FPD of 130%.
Correspondence classification
A set of 25 morphological features was extracted from each of the 412 detected cluster candidates from the 246 prior mammograms. The 412 cluster candidates were then paired with the clusters on the corresponding current mammograms. These 412 pairs consisted of either TP-TP pairs or TP-FP pairs. A leave-one-case-out resampling method was used for feature selection from the set of 25 available morphological difference features. An average of four difference features was selected. The selected difference features included the average effective microcalcification volume, mean density, eccentricity, and the number of microcalcifications in cluster. The LDA classifier achieved a test Az of 0.78±0.03. For every mammogram pair, the candidate cluster pair with the highest test discriminant score was selected. This yielded 226 (86.6%) selected TP-TP pairs and 20 selected TP-FP pairs for the total of 261 mammogram pairs in the data set. The 20 TP-FP temporal pairs were considered to be FPs yielding FP detection rate of 0.08 (20∕261) FPs∕image.
Classification of malignant and benign clusters
In this stage of the system two classifiers were used to characterize the 261 cases as malignant or benign. The temporal classifier was used to characterize the 246 cases for which there was a cluster detected on the prior mammogram. The current classifier was used to characterize the 15 cases for which no cluster was detected on the prior mammogram.
Temporal classifier
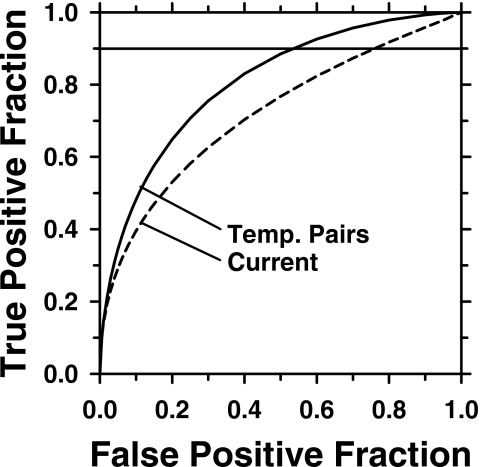
Leave-one-case-out resampling was used for feature selection from the feature sets described in Sec. 2C1. The features most frequently selected are listed in Table 1. An average of six features were selected including two difference morphological features, one difference RLS texture feature, two prior morphological features, and one current morphological feature. The LDA classifier using these features obtained a leave-one-case-out test Az of 0.81±0.03 for the set of 246 (226 TP-TP and 20 TP-FP) temporal pairs (Fig. 10), with a partial area index of 0.30. The test Az for the subset of the 20 TP-FP temporal pairs was 0.63±0.15. The large standard deviation reflects the fact that fitting an ROC curve to the discriminant scores of the data set with such a small sample size may not be reliable.
Table 1.
Features selected for malignant-vs-benign classification.
| Feature type | Feature name | Temporal classifier | Current classifier | ||
|---|---|---|---|---|---|
| Curr | Prior | Diff | |||
| Morphological | SUMDIST | X | X | ||
| CV_MEAN_DIST | X | ||||
| CV_DENS | X | X | |||
| SDEVQUADS | X | ||||
| Texture (RLS) | H_LRE_90 | X | |||
| Texture (SGLD) | DFV_A_4 | X | |||
Figure 10.
ROC curves for the temporal malignant-benign classifier (Az=0.81±0.03) and current malignant-benign classifier (Az=0.72±0.04). The difference in Az between the two classifiers was statistically significant (p=0.0014).
In our data set, the available temporal pairs per patient differed in the number of available views (range: 1–3) and in the number of temporal pairs per view (range: 1–3) among the patients. For the 92 patients with detection on the prior mammogram, if a single temporal pair score per patient was generated by averaging the test discriminant scores of all temporal pairs available for that patient, the Az was 0.82±0.04.
Current classifier
Features were selected using leave-one-case-out resampling from a set of 27 morphological features, 32 GLDS, and 26 SGLD texture features extracted from the 221 current mammograms. An average of two features was selected (Table 1). One morphological feature and one SGLD texture feature were selected consistently. The LDA classifier using the selected features yielded a leave-one-case-out test Az of 0.72±0.04 and a partial area index of 0.12 for the 221 current clusters. Fitting an ROC curve to the test discriminant scores for the 15 cases that had no detection on the priors was not reliable due to the small sample size so that no Az was estimated for this subset.
The difference in the test Az between the classifier based on the temporal pairs and that based on the corresponding current images alone (current images from the set of temporal pairs) is statistically significant (p=0.0014). The ROC curves for the temporal and the current classifiers are presented in Fig. 10.
DISCUSSION
In the first stage of the system a fan-shaped region is estimated on the prior mammogram based on the location of the cluster on the current mammogram. It is of utmost importance that the search region is determined correctly so that it encloses the location of the microcalcification cluster of interest on the prior mammogram. If an incorrect search region is located, the cluster will certainly not be found because the detection is performed only inside the search region. Our registration algorithm was highly accurate in identifying the fan-shaped regions for this data set. As discussed in Sec. 3A, the fan-shaped regions enclosed the true location of the microcalcification clusters on the prior mammograms for all 261 cases. The high accuracy in registration implies that all 261 clusters could potentially be identified by the detection algorithm.
The detection algorithm consisted of three key steps: Image preprocessing, segmentation, and classification. In the segmentation step we could effectively control the sensitivity of the detection algorithm by tuning the global gray level threshold. Increasing this threshold decreased the sensitivity in identifying potential microcalcification signals. While choosing a high threshold will reduce the number of FP signals detected, the trade-off is that the detection system may fail to identify signals which actually comprise the true microcalcification cluster. For some images the system may even fail to detect any clusters. Conversely, it is possible to increase the sensitivity of the detection system by setting a low threshold with an increased number of FP detections. This would consequently put a greater burden on the correspondence classifier in the next step to eliminate the increased number of FPs. We chose our threshold in such a way as to keep a reasonable balance between the detection of unwanted FP signals and the failure to detect signals of interest. Of the 412 candidate clusters identified by the detection stage, 110 were FPs as there was no overlap between them and the true cluster locations. In addition, as mentioned previously, on 8 of the 246 prior images which contained detected cluster candidates, there was no overlap between the cluster candidates and the true cluster location. Ideally the correspondence classifier would select a (TP-TP) pair of clusters for each of the 246 cases, however, given the results from the detection stage the best that could be achieved would be 238 TP-TP pairs. The correspondence classifier proved to be highly effective in reducing the number of FP detections such that it reduced the FP rate from 0.42(110∕261) to 0.08 (20∕261) FPs∕image and identified 226 TP-TP pairs.
The input feature space for the correspondence classifier contained temporal feature information by including an initial set of 25 morphological difference features, which were reduced to four features after stepwise feature selection. In previous studies the temporal feature information was obtained from a simple arithmetic difference between the corresponding features extracted from the current and the prior mammograms.18 In this study we designed a new measure, σdiff, which is based on the exponent of the difference between the corresponding features. The main motivation behind using such a measure is to transform all difference features into the same range which in this case was chosen to be 0–1. Since not all features are expressed in the same units and therefore tend to have a wide range of values, utilizing this difference measure serves to standardize the weights of all features.
One of the key findings in this study is that malignant-versus-benign classification of the microcalcification clusters in this data set was improved when temporal information was included in comparison to using information from the current mammogram alone. Five out of the six selected features contained prior information. Both morphological and RLS texture features were useful for the design of the temporal classifier. The newly defined morphological features SUMDIST, SDEVQUADS, and MEAN_DIST were effective for classification of malignant and benign microcalcification clusters. The current SUMDIST feature (the sum of the distances of the calcifications to the centroid of the cluster) was consistently selected both for the temporal classifier and the current classifier. The difference between the performance of the temporal classifier and the current classifier was notable, and the p value of 0.0014 confirmed that this difference was statistically significant.
We further validated the robustness of the temporal classifier by using 0.632 and 0.632+ bootstrap methods.31, 32, 33 We used the six most frequently selected features (Table 1) and performed 1000 bootstrap iterations for both methods. For the 0.632 bootstrap we obtained a test Az of 0.831 with 95% confidence interval of (0.779, 0.875). For the 0.632+ bootstrap we obtained a test Az of 0.830 with 95% confidence interval of (0.772, 0.875). These results show that the estimated performance of the temporal classifier is consistent using the different resampling methods. The test Az (Az=0.81) from the leave-one-case-out method, was lower than the Az obtained by using the bootstrap methods, which shows that the leave-one-case-out based classifier is the least optimistically biased, if any, among these three commonly used resampling methods. This result is consistent with the results from our previous simulation study33 that compared the leave-one-case-out method with 0.632 and 0.632+ bootstrap methods.
The failure of the system to detect any clusters on the prior mammograms of the 15 cases can be attributed in part to the subtlety of the clusters in these cases. The average visibility rating given by the radiologist was 7.6 for the 15 prior clusters, while for the remaining 246 cases, the average visibility for the prior clusters was 6.0. In four out these 15 cases, the microcalcification clusters on the prior mammograms were rated as very subtle by the radiologist (rating of 10).
We also performed a pilot ROC observer study with one experienced MQSA radiologist different than the one that marked the cases. The radiologist evaluated the temporal pairs displayed on a graphical user interface providing the likelihood of malignancy confidence ratings. The radiologist’s Az values were 0.72 for both the 261 and the 246 temporal pairs data sets. This indicates that the microcalcification clusters in these data sets cannot be easily distinguished as malignant or benign even by an experienced radiologist evaluating them on the temporal pairs of mammograms, consistent with the fact that all clusters had indeed undergone biopsy.
It is also interesting to note that, just as in the correspondence classification, the input feature space for the temporal malignant-benign classifier included an exponential difference similarity measure. It was found that incorporating the temporal information in this way, as a measure having values range between 0 and 1, was more effective than simply using the arithmetic difference.
A potential way to further improve the performance of the entire system is to improve the accuracy of the microcalcification detection program, which will result in more true cluster detections with less FPs and therefore generate less TP-FP pairs.
Last, there were previous studies related to identification, detection and characterization of corresponding lesions on CC and MLO views.34, 35, 36, 37, 38, 39, 40 The identification of the lesion in some of the two-view studies is based on the nipple-to-lesion distance as well, however, the search region is an arch instead of a fan-shaped region as in the case of temporal pairs identification, and the arch search area is generally larger than the fan-shaped region. The two-view information differs from the temporal pair information in that it provides complementary information for the lesion based on the additional projection views at one point in time. The serial mammograms from the same view, on the other hand, contain information about change in the lesion over time which is useful for diagnosis. Previously, we performed an observer study comparing radiologists’ accuracy in characterizing masses on temporal pairs of mammograms on single and two views (CC and MLO).41 We concluded that the use of two-view information improved the radiologist performance in characterizing masses on temporal pairs of mammograms. To investigate the effect of two-view analysis on microcalcification classification on temporal pairs, we performed an experiment using a subset of 62 patients who had corresponding temporal pairs for both CC and MLO views. The test Az for the 124 single-view CC and MLO temporal pairs was 0.82±0.04. When the test scores from the CC and MLO temporal pairs were combined by averaging for every patient (62 combined scores) and analyzed, the test Az was 0.86±0.05. This indicates that the use of two-view information has the potential to improve the performance of microcalcification characterization in interval change analysis, similar to our previous results for mass lesions.41 This will be a topic of interest for future investigation.
CONCLUSION
In this study, we have developed an automated system for detecting and characterizing microcalcification clusters on serial mammograms. The first stage of the system performed the registration of corresponding clusters on the temporal pair of mammograms. Our method for identifying a corresponding local search area on the prior mammogram proved to be highly effective. The locations of all 261 clusters on the prior mammograms were enclosed by the fan-shaped search regions defined in this stage. The correspondence classifier was effective in eliminating false positive detections while preserving true positives. An evaluation of the classification stage showed that an interval change analysis provided a significant advantage in characterizing the clusters as malignant or benign. A statistically significant improvement (p=0.0014) in the performance of the computer classifier was achieved by incorporating the temporal information.
ACKNOWLEDGMENTS
This work was supported by USAMRMC Grant Nos. DAMD17-02-1-0489 and DAMD17-02-1-0214, and USPHS Grant No. CA95153. The authors are grateful to Dr. Charles E. Metz for the LABROC program.
References
- Feig S. A., D’Orsi C. J., Hendrick R. E., Jackson V. P., Kopans D. B., Monsees B., Sickles E. A., Stelling C. B., Zinninger M., and Wilcox-Buchalla P., “American College of Radiology guidelines for breast cancer screening,” AJR, Am. J. Roentgenol. 171, 29–33 (1998). [DOI] [PubMed] [Google Scholar]
- Cady B. and Michaelson J. S., “The life-sparing potential of mammographic screening,” Cancer (N.Y.) 91, 1699–1703 (2001). [DOI] [PubMed] [Google Scholar]
- Bassett L. W., Shayestehfar B., and Hirbawi I., “Obtaining previous mammograms for comparison: Usefullness and costs,” AJR, Am. J. Roentgenol. 163, 1083–1086 (1994). [DOI] [PubMed] [Google Scholar]
- Burnside E. S., Sickles E. A., Sohlich R. E., and Dee K. E., “Differential value of comparison with previous examinations in diagnostic versus screening mammography,” AJR, Am. J. Roentgenol. 179, 1173–1177 (2002). [DOI] [PubMed] [Google Scholar]
- Chan H. P., Wei D., Lam K. L., Sahiner B., Helvie M. A., Adler D. D., and Goodsitt M. M., “Classification of malignant and benign microcalcifications by texture analysis,” Med. Phys. 22, 938 (1995). [DOI] [PubMed] [Google Scholar]
- Jiang Y., Nishikawa R. M., Wolverton D. E., Metz C. E., Giger M. L., Schmidt R. A., Vyborny C. J., and Doi K., “Malignant and benign clustered microcalcifications: Automated feature analysis and classification,” Radiology 198, 671–678 (1996). [DOI] [PubMed] [Google Scholar]
- Chan H. P., Sahiner B., Petrick N., Helvie M. A., Leung K. L., Adler D. D., and Goodsitt M. M., “Computerized classification of malignant and benign microcalcifications on mammograms: Texture analysis using an artificial neural network,” Phys. Med. Biol. 10.1088/0031-9155/42/3/008 42, 549–567 (1997). [DOI] [PubMed] [Google Scholar]
- Chan H.-P., Sahiner B., Lam K. L., Petrick N., Helvie M. A., Goodsitt M. M., and Adler D. D., “Computerized analysis of mammographic microcalcifications in morphological and texture feature space,” Med. Phys. 10.1118/1.598389 25, 2007–2019 (1998). [DOI] [PubMed] [Google Scholar]
- Jiang Y., Nishikawa R. M., and Papaioannou J., “Dependence of computer classification of clustered microcalcifications on the correct detection of microcalcifications,” Med. Phys. 10.1118/1.1397715 28, 1949–1957 (2001). [DOI] [PubMed] [Google Scholar]
- Salfity M. F., Nishikawa R. M., Jiang Y., and Papaioannou J., “The use of a priori information in the detection of mammographic microcalcifications to improve their classification,” Med. Phys. 10.1118/1.1559884 30, 823–831 (2003). [DOI] [PubMed] [Google Scholar]
- Paquerault S., Yarusso L. M., Papaioannou J., Jiang Y., and Nishikawa R. M., “Radial gradient-based segmentation of mammographic microcalcifications: Observer evaluation and effect on CAD performance,” Med. Phys. 10.1118/1.1767692 31, 2648–2657 (2004). [DOI] [PubMed] [Google Scholar]
- Kallergi M., “Computer-aided diagnosis of mammographic microcalcification clusters,” Med. Phys. 10.1118/1.1637972 31, 314–326 (2004). [DOI] [PubMed] [Google Scholar]
- Leichter I., Lederman R., Buchbinder S. S., Bamberger P., Novak B., and Fields S., “Computerized evaluation of mammographic lesions: What diagnostic role does the shape of the individual microcalcifications play compared with the geometry of the cluster?,” AJR, Am. J. Roentgenol. 2004, 705–712 (2004). [DOI] [PubMed] [Google Scholar]
- Wei L., Yang Y., Nishikawa R. M., and Jiang Y., “A study on several machine-learning methods for classification of malignant and benign clustered microcalcifications,” IEEE Trans. Med. Imaging 10.1109/TMI.2004.842457 24, 371–380 (2005). [DOI] [PubMed] [Google Scholar]
- Hadjiiski L. M., Chan H. P., Sahiner B., Petrick N., Helvie M. A., Roubidoux M. A., and Gurcan M. N., “Computer-aided characterization of malignant and benign microcalcification clusters based on the analysis of temporal change of mammographic features,” Proc. SPIE 4684, 749–753 (2002). [Google Scholar]
- Hadjiiski L. M., Chan H. P., Sahiner B., Helvie M. A., Roubidoux M. A., and Zhou C., “Interval change analysis based on computerized regional registration of corresponding microcalcification clusters on temporal pairs of mammograms,” RSNA Program Book 2004. [DOI] [PMC free article] [PubMed]
- Hadjiiski L. M., Drouillard D., Chan H. P., Sahiner B., Helvie M. A., Roubidoux M. A., and Zhou C., “Characterization of corresponding microcalcification clusters on temporal pairs of mammograms for interval change analysis—Comparison of classifiers,” Proc. SPIE 6144, 5Q1–5Q6 (2006). [DOI] [PMC free article] [PubMed] [Google Scholar]
- Hadjiiski L. M., Sahiner B., Chan H. P., Petrick N., Helvie M. A., and Gurcan M. N., “Analysis of temporal change of mammographic features: Computer-aided classification of malignant and benign breast masses,” Med. Phys. 10.1118/1.1412242 28, 2309–2317 (2001). [DOI] [PubMed] [Google Scholar]
- Hadjiiski L. M. et al. , “Improvement of radiologists’ characterization of malignant and benign breast masses in serial mammograms by computer-aided diagnosis: An ROC study,” Radiology 233, 255–265 (2004). [DOI] [PubMed] [Google Scholar]
- Timp S., Varela C., and Karssemeijer N., “Temporal change analysis for characterization of mass lesions in mammography,” IEEE Trans. Med. Imaging 10.1109/TMI.2007.897392 26, 945–953 (2007). [DOI] [PubMed] [Google Scholar]
- Hadjiiski L. M., Chan H. P., Sahiner B., Petrick N., and Helvie M. A., “Automated registration of breast lesions in temporal pairs of mammograms for interval change analysis—Local affine transformation for improved localization,” Med. Phys. 10.1118/1.1376134 28, 1070–1079 (2001). [DOI] [PubMed] [Google Scholar]
- Chan H. P., Doi K., Galhotra S., Vyborny C. J., MacMahon H., and Jokich P. M., “Image feature analysis and computer-aided diagnosis in digital radiography. 1. Automated detection of microcalcifications in mammography,” Med. Phys. 10.1118/1.596065 14, 538–548 (1987). [DOI] [PubMed] [Google Scholar]
- Chan H. P., Lo S. C. B., Sahiner B., Lam K. L., and Helvie M. A., “Computer-aided detection of mammographic microcalcifications: Pattern recognition with an artificial neural network,” Med. Phys. 10.1118/1.597428 22, 1555–1567 (1995). [DOI] [PubMed] [Google Scholar]
- Galloway M. M., “Texture classification using gray level run lengths,” Comput. Graph. Image Process. 10.1016/S0146-664X(75)80008-6 4, 172–179 (1975). [DOI] [Google Scholar]
- Weszka J. S., Dyer C. R., and Rosenfeld A., “A comparative study of texture measures for terrain classification,” IEEE Trans. Syst. Man Cybern. 6, 269–285 (1976). [Google Scholar]
- Sahiner B., Chan H. P., Petrick N., Wei D., Helvie M. A., Adler D. D., and Goodsitt M. M., “Classification of mass and normal breast tissue: A convolution neural network classifier with spatial domain and texture images,” IEEE Trans. Med. Imaging 10.1109/42.538937 15, 598–610 (1996). [DOI] [PubMed] [Google Scholar]
- Haralick R. M., Shanmugam K., and Dinstein I., “Texture features for image classification,” IEEE Trans. Syst. Man Cybern. 10.1109/TSMC.1973.4309314 3, 610–621 (1973). [DOI] [Google Scholar]
- Metz C. E., “ROC methodology in radiologic imaging,” Invest. Radiol. 10.1097/00004424-198609000-00009 21, 720–733 (1986). [DOI] [PubMed] [Google Scholar]
- Metz C. E., Shen J. H., and Herman B. A., “New methods for estimating a binormal ROC curve from continuously-distributed test results,” Annual Meeting of the American Statistical Association (Anaheim, CA, 1990).
- Jiang Y., Metz C. E., and Nishikawa R. M., “A receiver operating characteristic partial area index for highly sensitive diagnostic tests,” Radiology 201, 745–750 (1996). [DOI] [PubMed] [Google Scholar]
- Efron B., “Estimating the error rate of a prediction rule: Improvement on cross-validation,” J. Am. Stat. Assoc. 10.2307/2288636 78, 316–331 (1983). [DOI] [Google Scholar]
- Efron B. and Tibshirani R., “Improvements on cross-validation: The 632+ bootstrap method,” J. Am. Stat. Assoc. 10.2307/2965703 92, 548–560 (1997). [DOI] [Google Scholar]
- Sahiner B., Chan H. P., and Hadjiiski L., “Classifier performance prediction for computer-aided diagnosis using a limited data set,” Med. Phys. 10.1118/1.2868757 35, 1559–1570 (2008). [DOI] [PMC free article] [PubMed] [Google Scholar]
- Paquerault S., Sahiner B., Petrick N., Hadjiiski L. M., Gurcan M. N., Zhou C., and Helvie M. A., “Prediction of object location in different views using geometrical models,” presented at the IWDM-2000, Toronto, Canada, June 11–14, 2000; in Digital Mammography IWDM 2000: 5th International Workshop on Digital Mammography, edited by Yaffe M. J. (Medical Physics, Madison, WI, 2000), pp. 748–755. [Google Scholar]
- Paquerault S., Petrick N., Chan H. P., Sahiner B., and Helvie M. A., “Improvement of computerized mass detection on mammograms: Fusion of two-view information,” Med. Phys. 10.1118/1.1446098 29, 238–247 (2002). [DOI] [PubMed] [Google Scholar]
- Sahiner B., Chan H.-P., Hadjiiski L. M., Helvie M. A., Paramagul C., Ge J., Wei J., and Zhou C., “Joint two-view information for computerized detection of microcalcifications on mammograms,” Med. Phys. 10.1118/1.2208919 33, 2574–2585 (2006). [DOI] [PMC free article] [PubMed] [Google Scholar]
- Gupta S. and Markey M. K., “Correspondence in texture features between two mammographic views,” Med. Phys. 10.1118/1.1915013 32, 1598–1606 (2005). [DOI] [PubMed] [Google Scholar]
- Zheng B., Leader J. K., Abrams G. S., Lu A. H., Wallace L. P., Maitz G. S., and Gur D., “Multiview-based computer-aided detection scheme for breast masses,” Med. Phys. 10.1118/1.2237476 33, 3135–3143 (2006). [DOI] [PubMed] [Google Scholar]
- Huo Z., Giger M. L., and Vyborny C. J., “Computerized analysis of multiple-mammographic views: Potential usefulness of special view mammograms in computer-aided diagnosis,” IEEE Trans. Med. Imaging 10.1109/42.974923 20, 1285–1292 (2001). [DOI] [PubMed] [Google Scholar]
- van Engeland S. and Karssemeijer N., “Combining two mammographic projections in a computer aided mass detection method,” Med. Phys. 10.1118/1.2436974 34, 898–905 (2007). [DOI] [PubMed] [Google Scholar]
- Hadjiiski L. M. et al. , “Breast masses: Computer-aided diagnosis with serial mammograms,” Radiology 240, 343–356 (2006). [DOI] [PubMed] [Google Scholar]


