Abstract
Identifying the corresponding images of a lesion in different views is an essential step in improving the diagnostic ability of both radiologists and computer-aided diagnosis (CAD) systems. Because of the nonrigidity of the breasts and the 2D projective property of mammograms, this task is not trivial. In this pilot study, we present a computerized framework that differentiates between corresponding images of the same lesion in different views and noncorresponding images, i.e., images of different lesions. A dual-stage segmentation method, which employs an initial radial gradient index (RGI) based segmentation and an active contour model, is applied to extract mass lesions from the surrounding parenchyma. Then various lesion features are automatically extracted from each of the two views of each lesion to quantify the characteristics of density, size, texture and the neighborhood of the lesion, as well as its distance to the nipple. A two-step scheme is employed to estimate the probability that the two lesion images from different mammographic views are of the same physical lesion. In the first step, a correspondence metric for each pairwise feature is estimated by a Bayesian artificial neural network (BANN). Then, these pairwise correspondence metrics are combined using another BANN to yield an overall probability of correspondence. Receiver operating characteristic (ROC) analysis was used to evaluate the performance of the individual features and the selected feature subset in the task of distinguishing corresponding pairs from noncorresponding pairs. Using a FFDM database with 123 corresponding image pairs and 82 noncorresponding pairs, the distance feature yielded an area under the ROC curve (AUC) of 0.81±0.02 with leave-one-out (by physical lesion) evaluation, and the feature metric subset, which included distance, gradient texture, and ROI-based correlation, yielded an AUC of 0.87±0.02. The improvement by using multiple feature metrics was statistically significant compared to single feature performance.
Keywords: computer-aided diagnosis, full-field digital mammography, correlative feature analysis, lesion segmentation, feature selection
INTRODUCTION
Breast cancer is a leading cause of mortality in American women, with an estimated 182 460 new cancer cases and 40 480 deaths in the United States in 2008.1 Nevertheless, between the years 1990 to 2003, there has been a steady decrease in the annual death rate due to female breast cancer.2 This decrease largely reflects improvements in early detection and treatment. Currently, x-ray mammography is the most prevalent imaging procedure for the early detection of breast cancer.3
During mammographic screening, multiple projection views, such as craniocaudal (CC), mediolateral oblique (MLO), and mediolateral (ML) views, are usually obtained. Researchers have analyzed images from these different views to increase the performance of computer-aided detection. Paquerault et al.4 developed a two-view matching method that computes a correspondence score for each possible region pair in CC and MLO views, and merged it with a single-view detection score to improve lesion detectability. To reduce the number of false positive detections, Zhenget al.5 identified a matching strip of interest on the ipsilateral view based on the projected distance to the nipple and searched for a region within the strip and paired it with the original region. Engeland et al.6 built a cascaded multiple-classifier system, in which the last stage computes suspiciousness of an initially detected region conditional on the existence and similarity of a linked candidate region in the other view.
It has also been well recognized that multiple views can improve the diagnosis of breast cancer in the computerized analysis of mammograms,7, 8, 9, 10 since different projections provide complementary information about the same physical lesion. To merge information from images of different views, an essential step is to verify that these images actually represent the same physical lesion.
We present a dual-stage correlative feature analysis (CFA) method to address the task of classifying corresponding images of lesions as seen in different views. In this method, mass lesions are initially segmented automatically from the surrounding parenchyma. Then various features, including distance, morphological, and textural features, are extracted from the mass lesion on each of the two views. For a given pair of images, one from each view, each pair of computer-extracted features is merged through a Bayesian artificial neural network (BANN) to obtain correspondence metrics. The correspondence metrics are then merged with a second BANN to yield an estimate of the probability that the two lesions on different mammographic images are of the same physical lesion. This CFA method is different from conventional image registration methods in the following two aspects: (1) The task of image registration is to align two images known to represent the same object, while CFA is to assess the probability that the given two images represent the same object. (2) The key point of image registration is to determine a geometrical transformation that minimizes some cost functions defined by intensities, contours, and mutual information,11, 12, 13 in which various geometrical landmarks, such as control points and inherent image landmarks (nipple, curves, regions and breast skin),14, 15, 16 are identified and matched. The proposed CFA technique is feature based, which is motivated by the studies on fusion of two-view information for computer-aided detection,4, 5, 6 as well as our prior research on the task of automated classification of breast lesions, i.e., in the determination of benign and malignant breast lesions based on computer-extracted features.17, 18
Differing from the studies on computer-aided detection, however, our purpose is to identify the corresponding lesions from different views, and ultimately improve the performance of computer-aided diagnosis. Therefore, the noncorresponding pairs in our study will be lesion-lesion pairs, as compared to the lesion-parenchyma or parenchyma-parenchyma noncorresponding pairs in lesion detection task. In a correspondence study between two mammographic views for the lesion diagnosis task, Gupta et al.19 investigated the correlation between corresponding texture features from two different views, and suggested that one could include features from an additional view only if they were less correlated with features from the existing view, i.e., providing more complementary information. Our study, however, does not discuss methods to merge information from different views, but rather focuses on classifying the correspondence between lesions instead.
MATERIALS AND METHODS
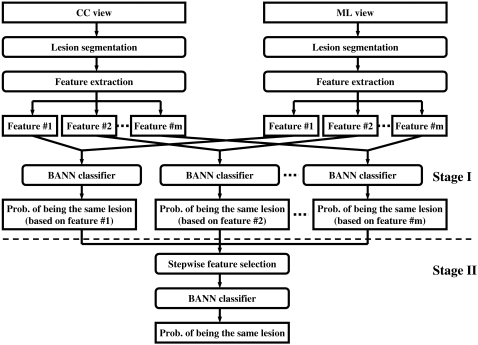
The main aspect of the proposed correlative feature analysis includes automatic lesion segmentation, computerized feature extraction, feature selection, and an estimation of the probability that two given images represent the same physical lesion. Figure 1 shows the schematic diagram of the proposed method.
Figure 1.
Schematic diagram of the proposed correlative feature analysis.
Database
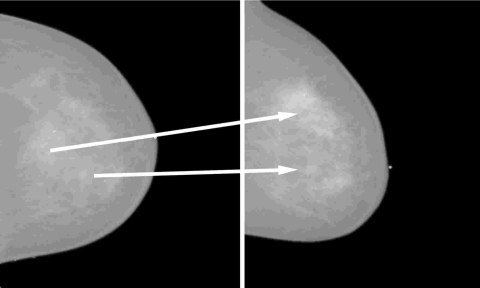
The full-field digital mammography (FFDM) database in our study consists of 135 biopsyproven mass lesions acquired at the University of Chicago Hospitals, in which lesions were collected under an approved institutional review board (IRB) protocol. Of the 135 lesions, 67 are benign with 123 mammograms and 68 are malignant with 139 mammograms. All the images were obtained from GE Senographe 2000D systems (GE Medical Systems Milwaukee, WI) with a spatial resolution of 100×100 μm2 in image plane. The masses were identified and outlined by an expert breast radiologist based on visual criterion and biopsy-proven reports. Based on the correspondence of lesions identified by the radiologist, we constructed 123 corresponding pairs and 82 noncorresponding pairs. Each pair consists of a CC view and a ML view. Figure 2 shows an example case with multiple lesions seen on mammograms in CC and ML views. Considering the most realistic scenario of lesion mismatch in clinical practice, the noncorresponding pairs were constructed from cases of the same patients but different physical lesions. Since in our database only 28 patients had two or more lesions in the same breast, the noncorresponding dataset, which includes all possible lesion combinations from the different views, is limited. Table 1 lists the detailed information regarding the corresponding and noncorresponding datasets.
Figure 2.
An example of two lesions in the same breast as seen in CC view (left) and ML view (right). The arrow indicates the correspondence of the same physical lesion in different views.
Table 1.
The number of lesion∕image pairs in corresponding and noncorresponding datasets. The noncorresponding pairs were constructed from cases of the same breasts but different physical lesions.
| Corresponding dataset | Noncorresponding dataset | |
|---|---|---|
| Benign | ||
| Images | 112 | 72 |
| Lesions | 56 | 39 |
| Malignant | ||
| Images | 134 | 64 |
| Lesions | 67 | 19 |
| Mixed | ||
| Images | — | 28 |
| Lesions | — | 14 |
Lesion segmentation
In our study, a dual-stage method,20 on which we have already reported, was employed to automatically extract lesions from the normal breast tissue. In this method, a radial gradient index (RGI) based segmentation21 is used to yield an initial contour in a computationally efficient manner. This initial segmentation also provides a base to identify the effective circumstance of the lesion via an automatic background estimation method. Then a region-based active contour model22, 23 is utilized to evolve the contour further to the lesion margin. The active contour model relies on an intrinsic property of image segmentation in that each segmented region (i.e., the lesion region and the parenchymal background region) should be as homogeneous as possible. Thus, the contour evolution tries to minimize the following energy function:
| (1) |
where μ⩾0, v⩾0, λ1, λ2>0 are fixed weight parameters, C is the evolving contour, and Length(C) is a regularizing term that prevents the final contour from converging to a small area due to noise. Ω represents the entire image space and ∫Ω(1−‖∇ϕt‖)2dxdy is an additional regularizing term that provides a smoother contour and pushes the contour closer to the lesion margin with less iterations. c1 and c2 are mean values inside and outside of C, respectively. The minimization of this energy function can be achieved by level set theory24 and Calculus of Variations, in which the two-dimensional evolving contour C is represented implicitly as the zero level set of a three-dimensional function ϕ(x,y), i.e., C={(x,y)∊Ω:ϕ(x,y)=0}. Instead of empirically determined criteria such as fixed iteration times, a dynamic stopping criterion is implemented to automatically terminate the contour evolution when it reaches the lesion boundary.
Computerized feature extraction
In this study, our primary interest is to investigate the potential usefulness of various computer-extracted features in the task of differentiating corresponding image pairs from noncorresponding ones. Features in this study are grouped into three categories: (I) margin and density features, (II) texture features based on gray-level co-occurrence matrix (GLCM), and (III) a distance feature. The features in the first two categories have been described in detail elsewhere25, 26, 27 and are only summarized here.
Margin and density features
Margin and density of a mass are two important properties used by radiologists when assessing the probability of malignancy of mass lesions. The margin of a mass can be characterized by its sharpness and spiculation. The margin sharpness is calculated as the average of the gradient magnitude along the margin of the mass.25 The margin spiculation is measured by the full width at half maximum (FWHM) of the normalized edge-gradient distribution calculated for a neighborhood of the mass with respect to the radial direction, and by the normalized radial gradient (NRG).25 Three features were extracted to characterize different aspects of the density of a lesion. Gradient texture is the standard deviation of the gradient within a mass lesion. Average gray value is obtained by averaging the gray level values of each pixel within the segmented region of mass lesion, and contrast measures the difference between the average gray level of the segmented region and that of the surrounding parenchyma. Furthermore, an equivalent diameter feature was also used in this study, which is defined as the diameter of a circle yielding the same area as the segmented lesion.
Texture features
The calculation of texture features in our study is based on the gray-level co-occurrence matrix (GLCM).4, 19, 26, 27 For an image with G gray levels, the corresponding GLCM is of size G×G, where each element of the matrix is the joint probability (pr,θ(i,j)) of the occurrence of gray levels i and j in two paired pixels with an offset of r (pixels) along the direction θ in the image.
Fourteen texture feature were extracted from the GLCM matrix, including contrast, correlation, difference entropy, difference variance, energy, entropy, homogeneity, maximum correlation coefficient, sum average, sum entropy, sum variance, variance, and two information measures of correlation. These features quantify different characteristics of a lesion, such as homogeneity, gray-level dependence, brightness, variation, and randomness.
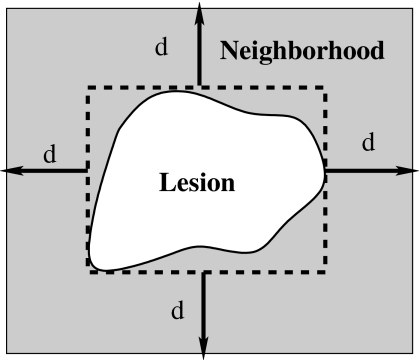
In our study, texture features were extracted from the lesion and the associated region of interest (ROI). A ROI includes a lesion and its surrounding neighborhood, which was determined by an automatic estimation method developed in our prior study.20 Here, an effective neighborhood is defined as the set of pixels within a distance d (pixels) from the circumscribed rectangle of the segmented lesion, as shown in Fig. 3. It should be noted that this neighborhood estimation is similar to that used earlier in the lesion segmentation, however, here the ROI is centered to the edge of the segmented lesion. Furthermore, a two-dimensional linear background trend correction was employed after the ROI extraction to eliminate the low-frequency background variations in the mammographic region.20
Figure 3.
Lesion neighborhood illustration.
For each region, four GLCMs were constructed along four different directions of 0°, 45°, 90°, and 135°, and a nondirectional GLCM was obtained by summing all the directional GLCMs. Texture features were computed from each nondirectional GLCM, resulting in a total of 28 texture features. To avoid sparse GLCMs for smaller ROIs, the gray level range of all the image data was scaled down to 6 bits, resulting in GLCMs of size 64×64. The offset r was empirically determined to be 16 (pixels).
Distance feature
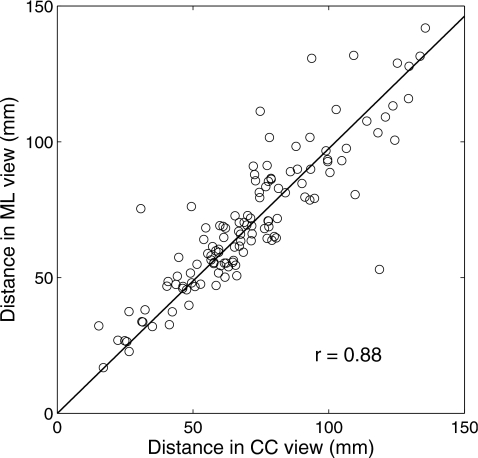
In clinical practice, radiologists commonly use the distance from the nipple to the center of a lesion to correlate the lesion in different views.4, 5 It is generally believed that this distance remains fairly constant. Thus, a distance feature in our study measures the Euclidean distance between the nipple location and the mass center of the lesion. Figure 4 shows the high correlation between the distance features of the same lesions in CC and ML views, with a correlation coefficient of 0.88. For this figure, the nipple locations were manually identified.
Figure 4.
The correlation between distance features of the same lesions in CC and ML views. The distance feature is defined as the Euclidean distance between the nipple location and the mass center of the lesion. Here, the nipple location is manually identified.
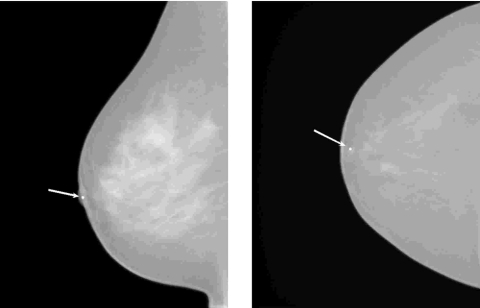
In mammographic images, nipple markers are commonly used. These present as bright markers on the mammograms (as shown in Fig. 5), and, thus, an automatic nipple localization scheme was developed to locate those markers. The scheme includes several processing stages. Initially, gray-level thresholding is employed to the entire mammogram to extract the breast region from the air background. Then, another gray-level threshold is applied to the breast region, yielding several nipple marker candidates. The breast skin boundary is obtained by subtracting a morphologically eroded28 breast region from its original region. To reduce the number of falsely identified nipple markers, area and circularity constraints are imposed on each candidate, and those candidates with area within a given range and circularity above a certain threshold are kept for the final step. The area range and circularity threshold were empirically determined with ten randomly selected images in this study. The nipple marker is finally chosen as the one closest to the breast boundary. For those cases in which there is no nipple marker or the marker is neglected erroneously by the above scheme, the nipple location is roughly estimated as the point on the breast skin boundary with the largest distance to the chest wall.
Figure 5.
Two examples of nipple markers. Nipple markers are bright spots close to the breast skin boundary, as indicated by arrows.
Feature selection and classification
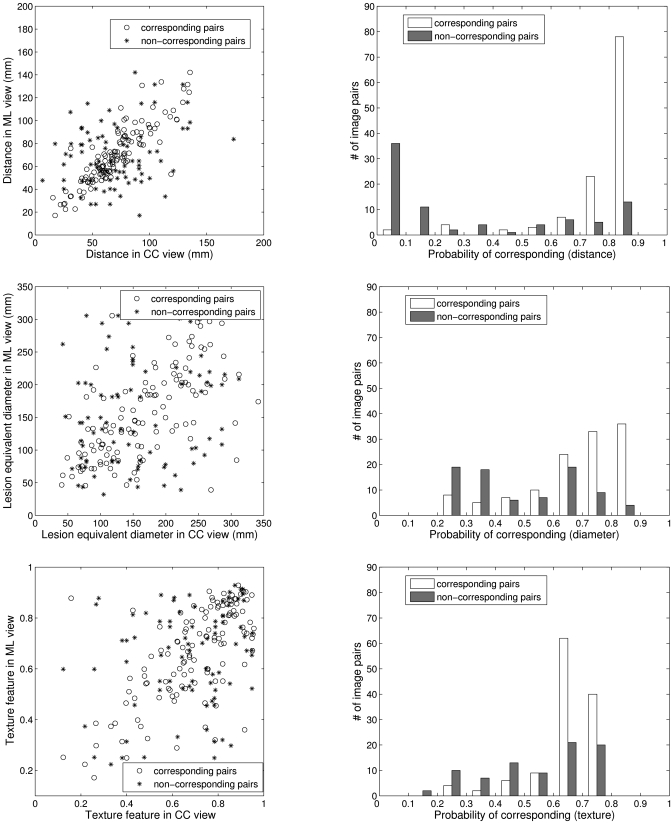
For each pairwise set of features extracted from lesions in different views, a Bayesian Artificial Neural Network (BANN) classifier29, 30 was employed to merge each feature pair into a correspondence metric, which is an estimate of the probability that the two lesion images are of the same physical lesion, i.e., stage I as shown in Fig. 1. For example, Fig. 6a shows the distributions of three features (distance, diameter, and texture) generated from breast lesions taken in different views for corresponding and noncorresponding datasets. The histograms in Fig. 6b demonstrate, for the corresponding and noncorresponding datasets, the distribution of these correspondence metrics output from the first BANN.
Figure 6.
(a) The scatter plots of three features (distance, diameter, and texture) generated from lesions seen on CC and ML views. (b) The distribution of the output correspondence metrics of these features obtained from the first BANN stage.
Linear stepwise feature selection31 with Wilks lambda criterion was employed on all feature-based correspondence metrics to select a subset of metrics for the final task of distinguishing corresponding pairs from noncorresponding ones. Note that instead of using lesion features directly, the correspondence metrics obtained from the first BANNs are used as inputs in the feature selection. BANNs were then retrained with the selected correspondence metrics to yield an overall estimate of probability of correspondence, i.e., the second BANN stage as shown in Fig. 1.
Evaluation
Receiver operating characteristic (ROC) analysis32, 33 was used to assess the performance of the individual feature-based correspondence metrics and the overall performance in the task of distinguishing corresponding image pairs from noncorresponding ones. The area under the maximum likelihood-estimated binormal ROC curve (AUC) was used as an index of performance. ROCKIT software (version 1.1 b, available at http:∕∕xray.bsd.uchicago. edu∕krl∕KRL_R0C∕software_index6.htm)34 was used to determine the p value of the difference between two AUC values, and the Holm t test35 for multiple tests of significance was employed to evaluate the statistical significance. Leave-one-out by lesion analysis was used in all performance evaluations. This method removes all images of a lesion while training with all other images. The trained classifier is then run on the images of the lesion removed. In the case of correspondence analysis, images of all pairs, both corresponding and noncorresponding pairs, are removed in the training to eliminate bias.
RESULTS
Segmentation
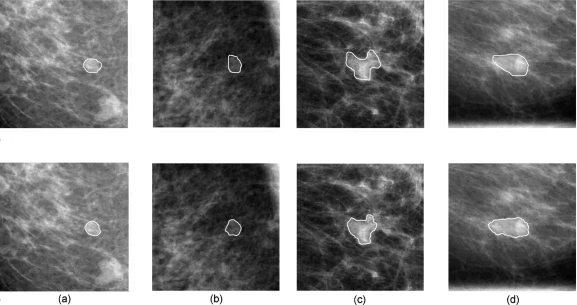
Figure 7 shows two examples of lesion segmentation using the dual-stage segmentation method. A measure of area overlap ratio (AOR) was used to quantitatively evaluate the segmentation performance, which is defined as the intersection of human outline and computer segmentation over the union of them. At the overlap threshold of 0.4, 81% of the images are correctly segmented.
Figure 7.
Segmentation results for a benign lesion and a malignant lesion. The solid lines in the upper four images depict the lesion margin as outlined by a radiologist, and the solid lines in the bottom four images are segmentation results from our previously-reported automatic dual-stage method (Ref. 20). (a) CC view of a benign lesion, (b) the corresponding ML view of the benign lesion, (c) CC view of a malignant lesion, and (d) the corresponding ML view of the malignant lesion.
Nipple localization method
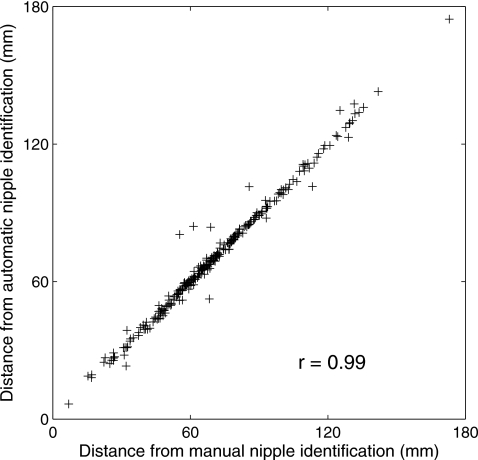
Figure 8 shows the correlation between distance features calculated with manually identified nipples and those calculated with computer-identified nipples. These two distance features are highly correlated with correlation coefficient of 0.996 (p-value<10−4). Both of these two distance features have an AUC value of 0.81±0.02 in the task of distinguishing between corresponding and noncorresponding image pairs.
Figure 8.
The correlation between distance features calculated from manually identified nipple locations and those calculated from computer-identified nipple locations.
Performance of single-feature correspondence metrics
We calculated the correlation coefficient r for the corresponding dataset, the r′ for the noncorresponding datasets, and their associated p-value for features extracted from two view images. Table 2 shows the results for features with r⩾0.5. It also shows the AUC values and the associated standard errors (se) representing the performance of the correspondence metrics of these individual features in the task of differentiating the corresponding lesion pairs from noncorresponding ones, with the lesions automatically delineated by the segmentation algorithm. The results show that all three categories have potential for the classification task. The results also show that the performance of pairwise image classification as learned by a BANN is determined by both the correlation of corresponding pairs and that of noncorresponding pairs.
Table 2.
Performance of the correspondence metrics from computer-extracted lesion features that yielded r⩾0.5 in differentiating corresponding image pairs from noncorresponding ones. r is the correlation coefficient for the corresponding dataset and r′ is for the noncorresponding dataset. The value after “±” is the standard error (se) associated with each AUC.
| Corresponding pairs | Noncorresponding pairs | AUC±se | |||
|---|---|---|---|---|---|
| r | p value | r′ | p value | ||
| I. Density and morph. features | |||||
| FI,1: Gradient texture | 0.53 | <0.001 | 0.27 | 0.01 | 0.56±0.03 |
| FI,2: Average gray level | 0.58 | <0.001 | −0.10 | 0.39 | 0.54±0.03 |
| FI,3: Equivalent diameter | 0.62 | <0.001 | 0.14 | 0.22 | 0.66±0.03 |
| II. Texture features | |||||
| * Lesion based | |||||
| FII,1: Correlation | 0.56 | <0.001 | 0.13 | 0.25 | 0.65±0.03 |
| FII,2: Info. corr. 1 | 0.50 | <0.001 | 0.06 | 0.61 | 0.67±0.03 |
| FII,3: Info. corr. 2 | 0.53 | <0.001 | 0.09 | 0.40 | 0.67±0.03 |
| FII,4: Max. corr. | 0.53 | <0.001 | 0.11 | 0.35 | 0.66±0.03 |
| ** ROI based | |||||
| FII,5: Contrast | 0.58 | <0.001 | 0.16 | 0.15 | 0.54±0.03 |
| FII,6: Correlation | 0.67 | <0.001 | 0.24 | 0.03 | 0.56±0.03 |
| FII,7: Diff. variance | 0.61 | <0.001 | 0.20 | 0.07 | 0.53±0.03 |
| FII,8: Entropy | 0.51 | <0.001 | 0.15 | 0.17 | 0.56±0.03 |
| FII,9: Info. corr. 1 | 0.62 | <0.001 | 0.16 | 0.15 | 0.61±0.03 |
| FII,10: Info. corr. 2 | 0.62 | <0.001 | 0.14 | 0.21 | 0.57±0.03 |
| FII,11: Max. corr. | 0.61 | <0.001 | 0.11 | 0.33 | 0.55±0.03 |
| FII,12: Sum. Average | 0.63 | <0.001 | 0.27 | 0.01 | 0.59±0.03 |
| FII,13: Sum. Entropy | 0.53 | <0.001 | 0.16 | 0.15 | 0.57±0.03 |
| FII,14: Sum. Variance | 0.61 | <0.001 | 0.41 | <0.001 | 0.50±0.03 |
| III. Distance feature | |||||
| FIII,1: Distance | 0.88 | <0.001 | 0.23 | 0.04 | 0.81±0.02 |
We also investigated the effect of lesion segmentation on the performance of each individual feature-based correspondence metric. Table 3 shows the AUC values and the associated standard error (se) of the 18 features extracted from lesions delineated by a radiologist and by the dual-stage segmentation algorithm, respectively. Also shown are the 95% confidence intervals (C. I.) of the difference of AUCs obtained from radiologist-outlined lesions (AUCR) and the computer-segmented lesions (AUCC), i.e., ΔAUC=AUCR−AUCC. For 5 of the 18 features, manual segmentation yielded statistically significant higher AUC values than computer segmentation (overall significant level αT=0.05),35 and we failed to show significant differences between manual segmentation and computer segmentation for the remaining features.
Table 3.
Performance of 18 single feature-based correspondence metrics obtained from radiologist-outlined (AUCR) and computer-segmented (AUCC) lesions, respectively. The value after “±” is the standard error (se) associated with each AUC. The two-tailed p-value and 95% C.I. of ΔAUC were calculated by ROCKIT. The “Sig. level” column represents the significance level of individual tests adjusted with Holm t test (overall significant level αT=0.05) and the tests with asterisks ( *) indicate significant difference using the adjusted significance level. The features have the same convention as Table 2.
| Feature | AUCR±se | AUCC±se | p value | Sig. level | 95% C.I. of ΔAUC |
|---|---|---|---|---|---|
| FI,1 | 0.65±0.03 | 0.56±0.03 | 0.04 | 0.0045 | [0.004, 0.20] |
| FI,2 | 0.53±0.03 | 0.54±0.03 | 0.76 | — | [−0.07,0.05] |
| 0.78±0.03 | 0.66±0.03 | 0.001 | 0.0031 | [0.05, 0.19] | |
| FII,1 | 0.71±0.03 | 0.65±0.03 | 0.06 | — | [−0.01,0.13] |
| FII,2 | 0.68±0.03 | 0.67±0.03 | 0.66 | — | [−0.05,0.09] |
| FII,3 | 0.69±0.03 | 0.67±0.03 | 0.48 | — | [−0.04,0.09] |
| FII,4 | 0.70±0.03 | 0.66±0.03 | 0.20 | — | [−0.02,0.11] |
| FII,5 | 0.57±0.03 | 0.54±0.03 | 0.30 | — | [−0.03,0.10] |
| FII,6 | 0.61±0.03 | 0.56±0.03 | 0.01 | 0.0042 | [0.01, 0.10] |
| FII,7 | 0.61±0.03 | 0.53±0.03 | 0.009 | 0.0038 | [0.02, 0.15] |
| FII,8 | 0.58±0.03 | 0.56±0.03 | 0.44 | — | [−0.03,0.07] |
| 0.69±0.03 | 0.61±0.03 | 0.002 | 0.0036 | [0.03, 0.14] | |
| 0.65±0.03 | 0.57±0.03 | 4×10⁻⁴ | 0.0029 | [0.04, 0.13] | |
| 0.66±0.03 | 0.55±0.03 | <10−5 | 0.0028 | [0.06, 0.15] | |
| FII,12 | 0.62±0.03 | 0.59±0.03 | 0.34 | — | [−0.03,0.09] |
| FII,13 | 0.58±0.03 | 0.57±0.03 | 0.90 | — | [−0.05,0.05] |
| 0.59±0.03 | 0.50±0.03 | 0.001 | 0.0031 | [0.05, 0.18] | |
| FIII,1 | 0.81±0.02 | 0.81±0.02 | 0.73 | — | [−0.01,0.01] |
Multiple features performance
Two sets of individual feature-based correspondence metrics were selected by stepwise feature selection31—one set for each of the two segmentation methods, as shown on Table 4. The subset selected from the feature-based correspondence metrics based on manually segmented lesions included distance (FIII,1), equivalent diameter (FI,3), and gradient texture (FI,1). The subset selected from computer-segmented lesions included distance (FIII,1), ROI-based correlation (FII,6), and gradient texture (FI,1). The leave-one-out (by lesion) validation using BANN to merge the selected correspondence metrics yielded an AUC of 0.89 for manual segmentation and 0.87 for computer segmentation, respectively. We failed to show a statistically significant difference between the performances of these two metric subsets (p=0.35). The improvement by using multiple-feature-based correspondence metrics was statistically significant compared to that of single feature-based correspondence metric performance, as shown in Table 4.
Table 4.
Performances of the overall correlative feature analysis method using leave-one-out (by lesion) validation, as well as the comparison with the distance feature alone. This table also shows the comparison between the overall performances of merged features obtained from radiologist-outlined and computer-segmented lesions. Same convention as Table 3.
| Lesion segmentation | Feature set | AUC±se | p value | 95% C.I. of ΔAUC | |
|---|---|---|---|---|---|
| Radiologist outlined | FIII,1 | 0.81±0.02 | } | 3×10⁻⁴ | [0.04, 0.12] |
| FIII,1, FI,3, FI,1 | 0.89±0.02 | ||||
| } | 0.35 | [−0.02,0.06] | |||
| Computer segmented | FIII,1, FII,6, FI,1 | 0.87±0.02 | } | 0.01 | [0.01, 0.08] |
| FIII,1 | 0.81±0.02 |
Since the distance feature performed best among the individual features for differentiating corresponding and noncorresponding image pairs, we evaluated the performance of the proposed correlative feature analysis method with the distance feature excluded. Using the remaining 17 features extracted from the computer-segmented lesions, a feature-based correspondence metric subset was obtained by stepwise feature selection, which included equivalent diameter (FI,3), ROI-based correlation (FII,6), and ROI-based sum of variance (FII,14). The leave-out-out (by lesion) validation using BANN yielded an AUC of 0.71±0.03. The difference as compared to the performance of distance feature is statistically significant (p=0.005). This result indicates that the distance feature is dominant but not sufficient for the overall performance of the proposed method.
DISCUSSION
In this study, we presented a correlative feature analysis framework to assess the probability that a given pair of two mammographic images is of the same physical lesion. Our results demonstrate that this framework has potential to distinguish between corresponding and noncorresponding lesion pairs. It is very important to note that our method is feature based, which employs two BANN classifiers to estimate the relationships (linear or nonlinear) between computer-extracted features of a lesion in different views. The supervised-learning manner not only makes the relationship flexible to each feature, but also avoids the sophisticated geometrically deformable models and the corresponding computationally demanding optimizations that are used in geometric breast registrations.36, 37
In our study, we excluded those features characterizing subtle information of a lesion, such as spiculation, margin sharpness, and normalized radial gradient (NRG). These features have been used in the task of distinguishing between benign and malignant lesions for mammographic images.9, 25 However, as the lesion details are usually sensitive to positions, it is expected that the associated features are less correlated in different views. Nevertheless, our ultimate aim is to improve the diagnostic performance of CAD systems with multiple images, in which complementary information provided by different images are desired; therefore, those features corresponding to lesion details would be used in the later step of the overall CAD scheme for differentiating between malignant and benign lesions.
In addition, as shown in Table 3, improving lesion segmentation can improve the performance of the computer in differentiating corresponding and noncorresponding image pairs. This is expected since more accurate segmentation yields more reliable computer-extracted features with which to characterize the lesion and the two-view correspondence.
A two-stage procedure was employed to address the problem of estimating the probability of correspondence for a pair of lesion images in different views. Stage I deals with the pairwise features and estimates the probability of correspondence based on individual lesion features. Stage II merges the correspondence metrics estimated in stage I from various individual lesion features to yield an overall probability of correspondence. To illustrate the superiority of the proposed two-stage method to a one-stage method that combines the multiple paired features directly, we compared the performances of the two methods with the four features of distance, lesion equivalent diameter, lesion-based correlation, and lesion-based information correlation, all of which performed best among the 18 individual features extracted from computer-segmented lesions. The two-stage scheme yielded an AUC of 0.83 while the one-stage scheme yielded an AUC of 0.67, with difference being statistically significant (p<10−4). The inferior performance of the one-stage scheme can be mainly explained by the fact that a single BANN classifier lacks the ability to deal with features in a pairwise way, thus the information regarding correlation between feature pairs cannot be efficiently utilized.
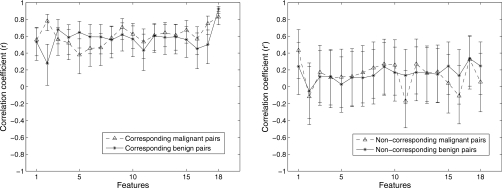
In order to evaluate how the pathology of lesions affects the performance of the proposed method, the entire dataset was split into benign and malignant subsets, as described in Table 1. As noted earlier, the correlation value between pairwise features, and not the feature value itself, plays a crucial role in the task of distinguishing corresponding and noncorresponding image pairs, thus we compared the correlation coefficients between image pairs for benign and malignant lesions, respectively. We failed to observe significant difference for most of features between benign and malignant lesions, as shown in Fig. 9. The results indicate that the pairwise feature analysis may be independent of pathology.
Figure 9.
Correlation coefficients between CC and ML views and associated 95% confidence intervals of the 18 features extracted from benign (solid) and malignant (dash) lesions. All the lesions were segmented via an automatic segmentation algorithm. Left: corresponding image pairs. Right: noncorresponding image pairs.
Due to the database size, there are two limitations in this preliminary study. First, the proposed correlative feature analysis was only applied on CC versus ML views, however, pairing other views, such as CC versus MLO and ML versus MLO, is also commonly used in clinical practice. Thus, in further study, we will evaluate the computerized analysis on those view pairs and investigate how the different pairwise views affect the performance of proposed analysis. Second, for noncorresponding pairs, lesions could be with either same pathology (i.e., both malignant or both benign) or different pathology (i.e., one malignant and one benign). Specifically, we are more interested in noncorresponding lesions of different pathology since integrating information from lesions with different pathology would hinder more the performance of CAD systems. However, we regarded the noncorresponding lesion pairs as a whole in this study as there are only 28 image pairs with different pathology. The performance of the proposed analysis on noncorresponding lesion pairs with different pathology, and the mismatching effects on the CAD performance are interesting research questions for our future study.
CONCLUSION
In this paper, we have presented a novel two-BANN correlative feature analysis framework to estimate the probability that a given pair of two images is of the same physical lesion. Our investigation indicates that the proposed method is a promising way to distinguish between corresponding and noncorresponding pairs. With leave-one-out (by lesion) cross validation, the distance-feature-based correspondence metric yielded an AUC of 0.81 and a feature correspondence metric subset, which includes distance, gradient texture, and ROI-based correlation, yielded an AUC of 0.87. The improvement by using multiple feature correspondence metrics was statistically significant compared to single feature metric performance. This method has the potential to be generalized and employed to differentiating corresponding and noncorresponding pairs from multi-modality breast imaging.
ACKNOWLEDGMENTS
This work was supported in part by US Army Breast Cancer Research Program (BCRP) Predoctoral Traineeship Award (W81XWH-06-1-0726), by United States Public Health Service (USPHS) Grant Nos. CA89452 and P50-CA125183, and by Cancer Center Support Grant (5-P30CA14599). MLG is a stockholder in, and receives royalties from, R2 Technology, Inc (Sunnyvale, CA), a Hologic Company. It is the University of Chicago Conflict of Interest Policy that investigators disclose publicly actually or potential significant financial interest which would reasonably appear to be directly and significantly affected by the research activities.
References
- Jemal A., Siegel R., Ward E., Hao Y., Xu J., Murray T., and Thun M. J., “Cancer statistics, 2008,” Ca-Cancer J. Clin. 58, 71–96 (2008). [DOI] [PubMed] [Google Scholar]
- Jemal A. J., Siegel R., Ward E., Murray T., Xu J., and Thun M. J., “Cancer statistics, 2007,” Ca-Cancer J. Clin. 57, 43–66 (2007). [DOI] [PubMed] [Google Scholar]
- Heywang-Kobrunner S. H., Dershaw D. D., and Schreer I., Diagnostic Breast Imaging: Mammography, Sonography, Magnetic Resonance Imaging, and Interventional Procedures, 2nd ed. (Thieme Medical Publisher, Stuttgart, 2001). [Google Scholar]
- Paquerault S., Petrick N., Chan H. P., Sahiner B., and Helvie M. A., “Improvement of computerized mass detection on mammograms: fusion of two-view information,” Med. Phys. 10.1118/1.1446098 29, 238–247 (2002). [DOI] [PubMed] [Google Scholar]
- Zheng B., Leader J. K., Abrams G. S., Lu A. H., Wallace L. P., Maitz G. S., and Gur D., “Multiview-based computer-aided detection scheme for breast masses,” Med. Phys. 10.1118/1.2237476 33, 3135–3143 (2006). [DOI] [PubMed] [Google Scholar]
- van Engeland S. and Karssemeijer N., “Combining two mammographic projections in a computer aided mass detection method,” Med. Phys. 10.1118/1.2436974 34, 898–905 (2007). [DOI] [PubMed] [Google Scholar]
- Jiang Y., Nishikawa R. M., Wolverton D. E., Metz C. E., Giger M. L., Schmidt R. A., Vyborny C. J., and Doi K., “Malignant and benign clustered microcalcifications: Automated feature analysis and classification,” Radiology 198, 671–678 (1996). [DOI] [PubMed] [Google Scholar]
- Chan H. P., Sahiner B., Lam K. L., Petrick N., Helvie M. A., Goodsitt M. M., and Adler D. D., “Computerized analysis of mammographic microcalcifications in morphological and texture feature spaces,” Med. Phys. 10.1118/1.598389 25, 2007–2019 (1998). [DOI] [PubMed] [Google Scholar]
- Huo Z., Giger M. L., and Vyborny C. J., “Computerized analysis of multiple-mammographic views: Potential usefulness of special view mammograms in computer-aided diagnosis,” IEEE Trans. Med. Imaging 10.1109/42.974923 20, 1285–1292 (2001). [DOI] [PubMed] [Google Scholar]
- Liu B., Metz C. E., and Jiang Y., “An ROC comparison of four methods of combining information from multiple images of the same patient,” Med. Phys. 10.1118/1.1776674 31, 2552–2563 (2004). [DOI] [PubMed] [Google Scholar]
- Hill D. L. G., Batchelor P. G., Holden M., and Hawkes D. J., “Medical image registration,” Phys. Med. Biol. 10.1088/0031-9155/46/3/201 46, R1–R45 (2001). [DOI] [PubMed] [Google Scholar]
- Pluim J. P. W., Maintz J. B. A., and Viergever M. A., “Mutual-information-based registration of medical images: a survey,” IEEE Trans. Med. Imaging 10.1109/TMI.2003.815867 22, 986–1004 (2003). [DOI] [PubMed] [Google Scholar]
- Maes F., Collignon A., Vandermeulen D., Marchal G., and Suetens P., “Multimodality image registration by maximization of mutual information,” IEEE Trans. Med. Imaging 10.1109/42.563664 16, 187–198 (1997). [DOI] [PubMed] [Google Scholar]
- Vujovic N. and Brzakovic D., “Control points in pairs of mammographic images,” IEEE Trans. Inf. Theory 6, 1388–1399 (1997). [DOI] [PubMed] [Google Scholar]
- van Engeland S., Snoeren P., Hendriks J., and Karssemeijer N., “A comparison of methods for mammogram registration,” IEEE Trans. Med. Imaging 10.1109/TMI.2003.819273 22, 1436–1444 (2003). [DOI] [PubMed] [Google Scholar]
- Marias K., Behrenbruch C., Parbhoo S., Seifalian A., and Brady M., “A registration framework for the comparison of mammogram sequences,” IEEE Trans. Med. Imaging 24, 782–790 (2005). [DOI] [PubMed] [Google Scholar]
- Giger M. L., Huo Z., Kupinski M. A., and Vyborny C. J., “Computer-aided diagnosis in mammography,” Proc. SPIE 2, 915–1004 (2000). [Google Scholar]
- Huo Z., Giger M. L., Vyborny C. J., Bick U., and Lu P., “Analysis of spiculation in the computerized classification of mammographic masses,” Med. Phys. 10.1118/1.597626 22, 1569–1579 (1995). [DOI] [PubMed] [Google Scholar]
- Gupta S. and Markey M. K., “Correspondence in texture features between two mammographic views,” Med. Phys. 10.1118/1.1915013 32, 1598–1606 (2005). [DOI] [PubMed] [Google Scholar]
- Yuan Y., Giger M. L., Li H., Suzuki K., and Sennett C., “A dual-stage method for lesion segmentation on digital mammograms,” Med. Phys. 10.1118/1.2790837 34, 4180–4193 (2007). [DOI] [PubMed] [Google Scholar]
- Kupinski M. A. and Giger M. L., “Automated seeded lesion segmentation on digital mammograms,” IEEE Trans. Med. Imaging 10.1109/42.730396 17, 510–517 (1998). [DOI] [PubMed] [Google Scholar]
- Chan T. F. and Vese L. A., “Active contours without edges,” IEEE Trans. Inf. Theory 10, 266–277 (2001). [DOI] [PubMed] [Google Scholar]
- Li C., Xu C., Gui C., and Fox M. D., “Level set evolution without re-initialization: A new variational formulation,” in Proc. 2005 IEEE CVPR, San Diego, 2005, pp. 1:430–436.
- Osher S. and Sethian J. A., “Fronts propagating with curvature-dependent speed: Algorithms based on Hamilton-Jacobin formulation,” J. Comput. Phys. 10.1016/0021-9991(88)90002-2 79, 12–49 (1988). [DOI] [Google Scholar]
- Huo Z., Giger M. L., Vyborny C. J., Wolverton D. E., Schmidt R. A., and Doi K., “Automated computerized classification of malignant and benign masses on digitized mammograms,” Acad. Radiol. 5, 155–168 (1998). [DOI] [PubMed] [Google Scholar]
- Haralick R. M., Shanmugam K., and Dinstein I., “Textural features for image classification,” IEEE Trans. Syst. Man Cybern. 10.1109/TSMC.1973.4309314 3, 610–621 (1973). [DOI] [Google Scholar]
- Chen W., Giger M. L., Li H., Bick U., and Newstead G. M., “Volumetric texture analysis of breast lesions on contrast-enhanced magnetic resonance images,” Magn. Reson. Med. 10.1002/mrm.21347 58, 562–571 (2007). [DOI] [PubMed] [Google Scholar]
- Sonka M., Hlavac V., and Boyle R., Image Processing, Analysis, and Machine Vision (PWS Publishing, Pacific Grove, CA, 1998). [Google Scholar]
- Bishop C. M., Neural Networks for Pattern Recognition (Oxford University Press, Oxford, 1995). [Google Scholar]
- Kupinski M. A., Edwards D. C., Giger M. L., and Metz C. E., “Ideal observer approximation using Bayesian classification neural networks,” IEEE Trans. Med. Imaging 10.1109/42.952727 20, 886–899 (2001). [DOI] [PubMed] [Google Scholar]
- Lachenbruch P. A., Discriminant Analysis (Hafner, London, 1975). [Google Scholar]
- Metz C. E., “ROC methology in radiologic imaging,” Invest. Radiol. 10.1097/00004424-198609000-00009 21, 720–733 (1986). [DOI] [PubMed] [Google Scholar]
- Metz C. E., Herman B. A., and Shen J., “Maximum likelihood estimation of receiver operating characteristic ROC curves from continuously-distributed data,” Stat. Med. 17, 1033–1053 (1998). [DOI] [PubMed] [Google Scholar]
- Metz C. E., Herman B. A., and Roe C. A., “Statistical comparison of two ROC-curve estimates obtained from partially-paired datasets,” Med. Decis Making 18, 110–121 (1998). [DOI] [PubMed] [Google Scholar]
- Glantz S. A., Primer of Biostatistics (McGraw-Hill, New York, 2002). [Google Scholar]
- Richard F. and Cohen L., “A new image registration technique with free boundary constraints: application to mammography,” Comput. Vis. Image Underst. 89, 166–196 (2003). [Google Scholar]
- Kita Y., Highnam R., and Brady M., “Correspondence between different view breast X-rays using a simulation of breast deformation,” in Proc. IEEE Computer Society Conf. Computer Vision and Pattern Recognition (1998), pp. 700–707.


