Abstract
In humans, when the medial olivocochlear (MOC) pathway is activated by noise in the opposite ear, changes in distortion product otoacoustic emission (DPOAE) level, i.e., the MOC reflex, can be recorded in the test ear. Recent evidence suggests that DPOAE frequency influences the direction (suppression∕enhancement) of the reflex. In this study, DPOAEs were recorded at fine frequency intervals from 500 to 2500 Hz, with and without contralateral acoustic stimulation (CAS) in a group of 15 adults. The MOC reflex was calculated only at DPOAE frequencies corresponding to peaks in the fine structure. Additionally, inverse fast-Fourier transform was conducted to evaluate MOC effects on individual DPOAE components. Results show the following: (1) When considering peaks only, the mean MOC reflex was −2.05 dB and 97% of observations reflected suppression, (2) CAS reduced distortion characteristic frequency component levels more than overlap component levels, and (3) CAS produced an upward shift in fine structure peak frequency. Results indicate that when the MOC reflex is recorded at DPOAE frequencies corresponding to fine structure maxima (i.e., when DPOAE components are constructive and in phase), suppression is reliably observed and level enhancement, which probably reflects component mixing in the ear canal rather than strength of the MOC reflex, is eliminated.
INTRODUCTION
Descending medial olivocochlear (MOC) fibers synapse almost exclusively on outer hair cells (OHCs) and through cholinergic channels, alter OHC function. This alteration in OHC function influences motion of the basilar membrane and by extension, impacts otoacoustic emissions (OAEs) (Guinan, 2006). The MOC reflex, as it has been termed, has been studied in laboratory animals and humans by recording distortion product otoacoustic emissions (DPOAEs) in one ear while presenting contralateral noise to the opposite ear (Collet et al., 1990; Puel and Rebillard, 1990; Moulin et al., 1993). Contralateral acoustic stimulation (CAS) is thought to activate the uncrossed MOC pathway. This activation can be quantified by measuring the difference between DPOAE levels recorded in no-CAS and +CAS conditions. Another means of activating the MOC reflex is to present a suppressor ipsilaterally. This produces a larger onset adaptation response in cats and other laboratory animals, presumably because it includes the larger bundle of crossed fibers (Liberman et al., 1996). Work with humans, however, has not shown the same robust DPOAE onset adaptation (Agrama et al., 1998; Kim et al., 2001).
DPOAEs are generally reduced in level by MOC activity, but sometimes show amplitude enhancement as well (Maison and Liberman, 2000; Abdala et al., 1999; Müller et al., 2005). The amount of MOC-induced suppression typically ranges from 1 to 3 dB in humans (Abdala et al., 1999; Bassim et al., 2003; Moulin et al., 1993). Some studies have reported larger changes when the MOC reflex value is calculated in absolute values (i.e., disregarding direction of the change) or when the range between suppression and enhancement is used as an index of the MOC reflex (Müller et al., 2005; Wagner et al., 2007).
The MOC reflex has been measured using other types of OAEs that arguably could provide a more effective assay than DPOAE-based paradigms. Guinan (2006, p. 597) warns that the most critical difficulty associated with use of DPOAEs for measurement of the MOC reflex is that “…the effect can be in either direction and can change greatly with small changes in stimulus parameter, thereby making a single measurement difficult to interpret.” Recent modifications to the typical DPOAE-based MOC reflex protocol have attempted to control for, or at least consider, the bidirectionality of changes in DPOAE level produced by CAS (Sun, 2008b; Müller et al., 2005; Zhang et al., 2007). These modified paradigms take into account how the choice of DPOAE frequency (and where this frequency falls along the pattern of alternating level peaks and dips known as fine structure) influences measures of the MOC reflex.
The ear canal DPOAE is thought to be comprised of a nonlinear distortion component from around the primary tone overlap or f2 region, and a reflection component from the DP characteristic frequency (CF) region at 2f1−f2 (Dhar et al., 2002; Kim, 1980; Shera and Guinan, 1999; Talmadge et al., 1999). These two components mix in the ear canal through vector summation and form the composite DPOAE that is traditionally measured at the probe microphone. Because phase rotates as a function of frequency at different rates for each component, they can sum either constructively or destructively, depending on their relative phase. DPOAE fine structure is considered an “interference pattern,” depicting the phase relationships between these two DPOAE sources across frequency. If the components sum while out of phase, they can cancel one another and produce reduced DPOAE level; that is, a “minimum” or dip in fine structure. If they combine in a constructive fashion, while in phase, they augment DPOAE level and produce a “maximum” or peak in fine structure. Thus, for any DPOAE measurement, the test frequencies selected determine the phase relationship between components.
If MOC activation influences the two DP components differentially, it could explain observations of DPOAE level enhancement. For example, if the DPOAE is measured at a frequency where the two components are out of phase, producing cancellation (at a fine structure dip or minimum) and the MOC reflex suppresses only one component, it will alter the phase relationship between them, consequently releasing phase cancellation. Thus, MOC activation in this scenario would result in a sudden increase in DPOAE level, i.e., enhancement. Conversely, if the DPOAE is measured at a frequency where the two components are in phase and adding constructively (at a peak or maximum in fine structure), a reduction in amplitude of either or both components by MOC activation will produce a reduction in ear canal DPOAE level, i.e., suppression. By controlling the phase relationship between components, it is possible to effectively address the greatest difficulty attributed to DPOAE-based measures of the MOC reflex and avoid instances of enhancement that are unrelated to MOC reflex strength.
Most earlier studies of the MOC reflex using the DPOAE-based CAS paradigm, including one from our own laboratory, did not control for the phase relationship between the two DPOAE sources. Generally, test frequency has been selected without regard for fine structure and, as a result, MOC findings cannot be interpreted without ambiguity. The purpose of the present study is to describe (1) a DPOAE-based measure of the MOC reflex that attempts to control the phase relationship between components by measuring only at fine structure peaks, and (2) the effects of CAS on the relationship between dual components contributing to the ear canal DPOAE.
METHODS
Subjects
Twenty-one potential adult subjects were screened for participation in this study. Of those, 15 were included and six were eliminated primarily due to low DPOAE level, history of noise exposure, elevated audiometric thresholds, and∕or excessively high noise floor. Subjects were employees of the House Ear Institute (Los Angeles, CA) or friends of employees and were recruited via e-mail advertisement. They were screened for hearing thresholds ≤15 dB HL between 0.25 and 8 kHz and normal middle ear function, defined as a type A tympanogram with static compliance between 0.4 and 1.5 cm3 and peak pressure between ±150 daPa. Six left and nine right ears from 11 females and four males with a mean age of 31 years (range=21–43 years) were tested. All tests were conducted at the House Ear Institute in a sound-attenuated IAC booth. Each participant was tested twice with the same DPOAE protocol (trials 1 and 2). The two trials were separated by 30–45 min at most and did not typically include a refitting of the probe between trials.
Instrumentation and protocol
Signal generation and recording were controlled using custom software developed by Talmadge et al. (1999) and run on an Apple Macintosh G4 computer via a MOTU 828 Mk II (24 bits∕44 100 Hz). Stimulus tones were presented to the subjects’ ear canal via an Etymotic Research ER-10C DPOAE probe system. The output of the ER-10C microphone was preamplified and then passed through an analog high pass filter with 300 Hz cutoff frequency before being digitized by the MOTU and stored on disk.
DPOAE recordings were made between DP frequencies of ∼500 Hz (f2=782 Hz) and ∼2500 Hz (f2=3910 Hz) using stimulus levels of 65 (L1) and 55 (L2) dB sound pressure level (SPL) and a constant stimulus frequency ratio of (f2∕f1) 1.22. The stimulus tones were swept at a rate of 8 s∕octave, using a technique originally described by Long et al. (2004, 2008). Eight such sweeps were averaged in both no-CAS and +CAS conditions with conditions counterbalanced. Contralaterally presented broadband noise was generated by an external noise generator and presented at 60 dB SPL (unweighted) to all subjects, through an ER-2 insert phone. Preliminary work was conducted on ten normal-hearing adults to establish the optimal CAS level for MOC activation (between 30 and 70 dB SPL). In these ten subjects, 55–65 dB SPL produced maximum reductions in DPOAE level. Because 60 dB SPL is the recommended level used in most human studies of DPOAE contralateral suppression (Guinan, 2006) and it agreed with results of our preliminary testing, it was selected as the noise elicitor for all subjects in the current study. This CAS level is considered low enough that it does not evoke middle ear muscles in most cases (Gelfand, 1984) and high enough in level to produce MOC activation.
DPOAE level and noise-floor estimates were made using a least-square-fit algorithm (LSF) (Long et al., 2008) and yielded estimates at every 2 Hz around 500–1000 Hz and every 6 Hz around 2500 Hz. The stimulus levels were calibrated and system distortion measured in a Zwislocki coupler. The two transducers in the ER-10C were individually equalized to produce flat constant drive voltage frequency responses up to 7000 Hz. System distortion was below −30 dB SPL for the stimulus levels used in these recordings.
A MATLAB-based analysis software (NIPR), also developed by Talmadge et al. (1999), uses an inverse fast-Fourier transform (IFFT) algorithm described in Dhar et al., 2002 and Withnell et al., 2003 to separate the DPOAE overlap and CF components based on their respective group delays. DPOAE complex amplitude measured in the frequency domain is multiplied by a moving Welch window (400 Hz window width) in 50 Hz step sizes. The IFFT converts each windowed data set into the time domain, after which a time-window filter is applied to extract the desired delay component in the time domain. These filtered windows of data are then transformed back to the frequency domain by FFT and the complex amplitudes of the overlap and CF components are reconstructed in the frequency domain.
Data analysis
Fine structure classification
Level
The median value for every three successive data points was computed to calculate DPOAE level and noise floor. Data points where the signal-to-noise ratio (SNR) between level and noise-floor medians was not at least 6 dB were eliminated. Although, the LSF procedure for estimating DPOAE level is a more efficient measure than provided by traditional FFT analyses and is less contaminated by the noise floor, a rather conservative 6 dB SNR criterion was used to ensure valid and reliable DPOAE estimates.
Maxima
The identification of maxima and measurement of fine structure spacing and depth were conducted with an automated algorithm developed by Dhar (Dhar and Abdala, 2007). Fine structure maxima were identified based on the first and second derivatives of the DPOAE level function and the relationship between them. Data points where the first derivative was equal to zero were identified as extrema (maxima and minima) and then further classified as a maximum or minimum based on the second derivative being negative (maxima) or positive (minima). Although maxima were identified using an automated algorithm, this process was checked manually by two observers familiar with the identification of DPOAE fine structure. This secondary level of analysis was implemented to eliminate minor ripples associated with noise that were erroneously identified by the program as maxima. These errors typically included peaks that were artificially tall and narrow and mimicked the noise-floor configuration in the low-frequency range. Sixty-five percent of the maxima eliminated during secondary analysis were in the frequency region below 1000 Hz. (Note: An updated analysis algorithm currently in use automatically eliminates maxima with less than 2.5 dB depth and fine structure spacing that is artificially narrow: f∕Δf>25.)
Prevalence
Prevalence of fine structure periods was calculated by counting maxima in 1∕3 octave intervals.
Depth and spacing
Fine structure depth for each period was computed as FSdepth=20 log 10 (Pmax∕Pav(min)), where Pmax is the DPOAE level at a maximum and Pav(min) is the average DPOAE amplitude of the preceding and following minima. The frequency spacing of fine structure was computed both in Hz and as f∕Δf, where f is the geometric mean between two adjacent minima and Δf is the frequency separation between them (Shera, 2003).
Component separation
The composite DPOAE level was separated into two components using an IFFT technique, as described in Sec. 2. The two components are thought to reflect (a) the primary DPOAE generation source around f2, corresponding to the point of maximum overlap between the two stimulus tones (overlap component); and (b) a source at 2f1−f2, the DP CF component.
Quantifying the MOC effect
The MOC effect was quantified at frequencies corresponding to fine structure maxima only. Two indices of the MOC effect were calculated.
-
(a)
MOC reflex. This is the difference between DPOAE level at a given maxima frequency in the no-CAS condition and, at the same frequency, in the +CAS condition. Only the MOC reflex values that reflected DPOAE level suppression were included in analyses although the distribution of level enhancement evoked by CAS was reported as well.
-
(b)
MOC shift. This is a shift in peak frequency observed between a DPOAE maximum in the no-CAS condition and the same maxima during CAS. A frequency ratio value, f∕Δf, was calculated to reflect this frequency shift, similar to the index used in the analysis of fine structure spacing. In this case, f=peak frequency in the no-CAS condition and Δf=the difference between this reference frequency and frequency of the corresponding maxima in the +CAS condition. Only frequency shifts toward higher frequencies were analyzed but the distribution of both low- and high-frequency shifts was reported.
Statistical analyses
DPOAE level (including composite level and separate overlap and CF component levels), prevalence, depth, and spacing were calculated for each individual and compared across frequency, trial, and CAS condition in multiway repeated measures analyses of variance (ANOVAs) using the statistical computing package, STATVIEW (SAS Institute). MOC reflex and shift were calculated for each individual and compared across frequency and trial. For analysis and display of DPOAE level only, f2 frequency was plotted on the abscissa, as is typical in much of literature. Most DP-grams (DP level×frequency), as they are referred to in clinical nomenclature, are plotted as a function of f2 or the geometric mean of f1 and f2 since this is considered the frequency∕cochlear region being evaluated. We wish to remain consistent with this convention and produce a recognizable graph of DPOAE level. All fine structure, DPOAE component, and MOC-related variables were displayed and analyzed as a function of DP frequency (2f1−f2).
Variables were averaged into discrete frequency bands for analysis and display. For each subject, DPOAE level (in dB SPL) was averaged into four f2 frequency bands centered at 1000, 2000, 3000, and 4000 Hz, corresponding to 2 mm distance on the basilar membrane as per Greenwood’s map of frequency (1 mm on each side of the center frequency except for 4000 Hz, which had reduced range on the high-frequency end). DPOAE fine structure, component, and MOC variables were averaged into the following four 500-Hz-wide frequency bands for analysis: 500–1000, 1000–1500, 1500–2000, and 2000–2500 Hz. In all figures, these frequency bands are denoted by a value representing the upper limit of the frequency interval.
RESULTS
DPOAE fine structure
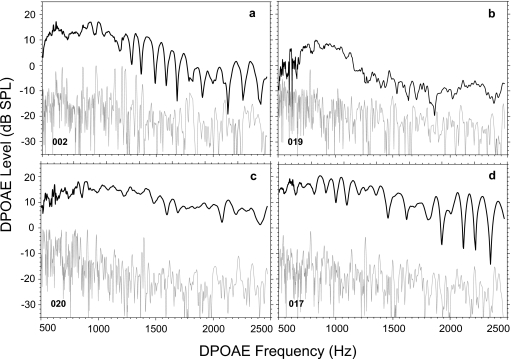
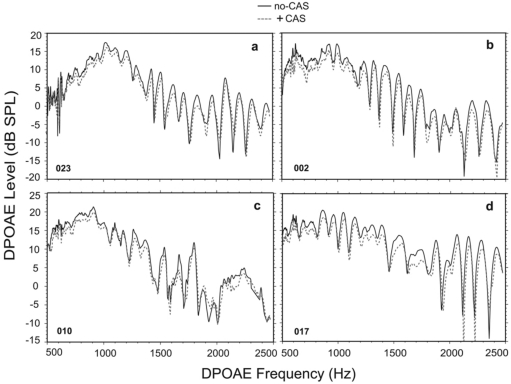
Prior to analyzing any effects of CAS on DPOAEs, initial analyses quantified fine structure characteristics from all subjects in the no-CAS condition. Figure 1 (a)–(d) show fine structure and corresponding noise floor from four randomly chosen adult subjects. Panels (a) and (d) show extremely deep, pronounced, strong fine structure throughout the frequency range. Panel (b) shows relatively poorly defined fine structure and low DPOAE levels beyond about 1000 Hz. Panel (c) shows moderate fine structure throughout the frequency range.
Figure 1.
DPOAE fine structure and noise floor from four randomly selected adult subjects. Panels (a) and (d) are from adults with strong fine structure and pronounced minima. Panels (b) and (c) in contrast show relatively poor-to-fair fine structure, with more shallow minima and more poorly defined peaks.
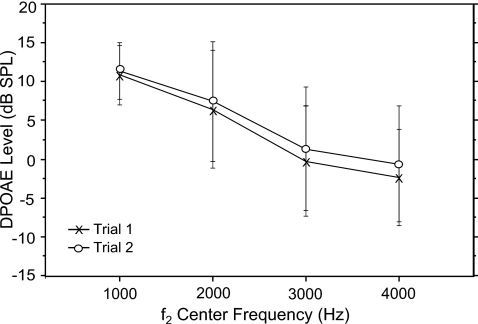
Mean DPOAE level ranged from an average of −3 dB SPL at 4000 Hz to a high of 11 dB SPL at 1000 Hz. Figure 2 shows mean level at each f2 center frequency for trials 1 and 2 separately. A repeated measures ANOVA of DPOAE level (trial×f2 frequency) showed a significant effect of frequency (f=117.87; p=0.0001) and no effect of trial. DP level decreased with increasing f2 frequency.
Figure 2.
Mean DPOAE level at four f2 center frequencies in 15 normal-hearing adults. Data were collected for each subject during two separate runs (trials 1 and 2) within the same test session. Error bars reflect ±1 s.d.
Prevalence of fine structure maxima was calculated in six 1∕3 octave intervals: 630–794, 794–1000, 1000–1260, 1260–1587, 1587–2000, and 2000–2500 Hz (not a full 1∕3 octave interval). The corresponding prevalence of fine structure periods for these six DP frequency ranges was 0.9, 1.6, 2.5, 2.5, 3.2, and 2.8 with an average of 2.25 periods per 1∕3 octave interval and an overall average of 13.5 periods over the entire approximately two-octave range analyzed. A repeated measures ANOVA (trial×DP frequency) showed a significant effect of frequency (f=27.8; p=0.0001) with no effect of trial. The prevalence of DPOAE fine structure periods increased with DP frequency and peaked in the mid- to high-frequency range (1587–2500 Hz).
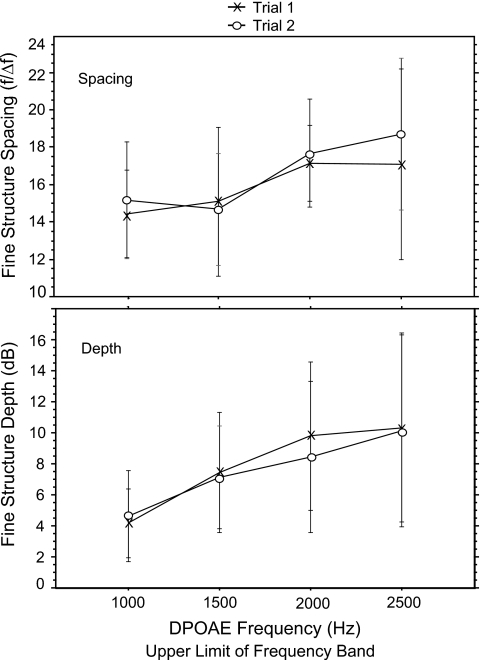
Fine structure spacing (in Hz) ranged from 65 at 1000 Hz to 125 at 2500 Hz. These values were converted into an f∕Δf ratio for analysis and averaged into four DPOAE frequency bands with upper limits of 1000, 1500, 2000, and 2500 Hz. The overall mean ratio was 16.4, consistent with estimates of spontaneous OAE spacing in normal-hearing adult subjects (Shera, 2003). Mean spacing ratios ranged from 14.8 at 1000 Hz to 18.0 at 2500 Hz (Fig. 3, upper panel). A repeated measures ANOVA found no effect of trial on spacing but a significant effect of frequency (f=7.0; p=0.0003).
Figure 3.
Mean DPOAE fine structure spacing ratio and depth as a function of DP frequency in 15 adults. Data were collected for each subject during two separate runs (trials 1 and 2) within the same test session. Error bars reflect ±1 s.d.
The depth of each fine structure period ranged from a mean of 4 dB at 1000 Hz to 10.3 dB at 2500 Hz (Fig. 3, lower panel). A repeated measures ANOVA of depth (frequency×trial) showed a significant effect of frequency on fine structure depth (f=10.9; p<0.0001) but no effect of trial. Fine structure periods became deeper as frequency increased.
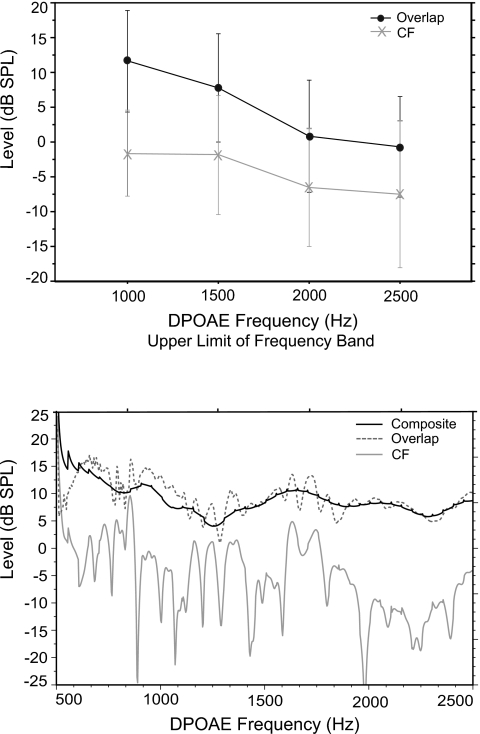
Once the composite DPOAE was separated into two components using IFFT, DP level from both the overlap and CF regions was analyzed with a three-way repeated measures ANOVA (component×frequency×trial). This analysis sought to determine if response level was different between components and whether this difference was frequency or trial dependent. There was a main effect of component (f=116; p<0.0001) and frequency (f=94; p<0.0001) and an interaction between the two (f=8.9; p<0.0001). There was no effect of trial. The upper panel of Fig. 4 shows mean DP component levels (summed over trial) as a function of DPOAE frequency. Overlap component levels were higher than CF component levels by a mean value of 9.3 dB. Additionally, there was a general decrease in level as DPOAE frequency increased, for the overlap component only. The lower panel of Fig. 4 shows complete IFFT level output for one subject. Although much greater frequency resolution is apparent in this IFFT output graph, the same pattern is evident in both panels; the overlap component is higher in level than the CF component across frequency.
Figure 4.
Upper panel: Mean DP component level (overlap and CF) as a function of DP frequency in 15 adults. Data from trials 1 and 2 are combined. Lower panel: IFFT level output from one adult subject showing composite DPOAE level recorded in the ear canal, as well as overlap and CF component levels.
The effects of CAS on DPOAE fine structure
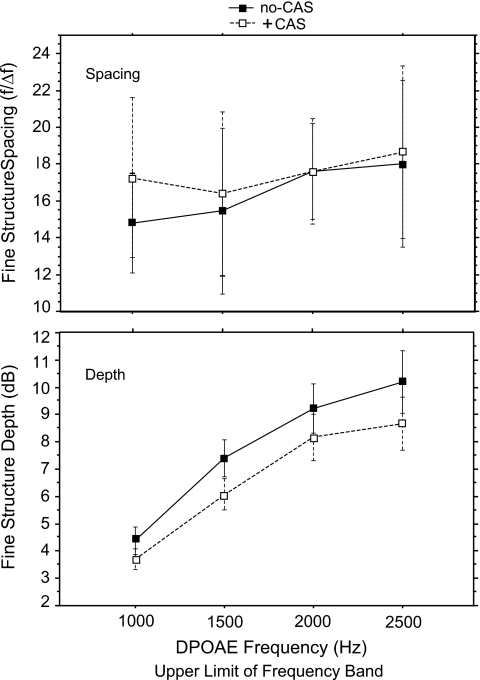
Because data from trials 1 and 2 were indistinguishable in previous analyses, they were combined here. Prevalence of DPOAE fine structure periods did not change with the presentation of CAS (CAS condition×frequencyANOVA). A similar test was conducted on spacing (f∕Δf) and showed an effect of CAS (f=14.6; p=0.0008) and an effect of frequency (f=4.8; p=0.007). The upper panel of Fig. 5 depicts spacing ratio as a function of DPOAE frequency. As noted in Fig. 5, an interaction between CAS condition and frequency was also observed (f=2.7; p=0.04). Post hoc t-tests were conducted to further scrutinize the interaction using a Bonferoni adjusted alpha level (4 contrasts∕0.05=0.012) and showed that the effect of CAS on fine structure spacing was only present in the lowest-frequency band: 500–1000 Hz (p=0.0003). The mean spacing ratio in the low-frequency band was 14.7 (s.d.=2.72) in the no-CAS condition and 17.2 (s.d.=4.25) when CAS was presented. It may be noteworthy that the calculated average spacing value in this low-frequency interval was typically based on many fewer individual observations than averages in the other three frequency bands, due to a higher noise floor.
Figure 5.
Mean DPOAE fine structure spacing ratio (upper panel) and depth (lower panel) as a function of DP frequency in 15 adult subjects. The parameter is absence or presence of CAS. The filled squares represent no-CAS and the open squares represent +CAS. Trials 1 and 2 data are combined. Error bars reflect ±1 s.d.
A repeated measures ANOVA (CAS condition×DP frequency) was conducted on fine structure depth and showed that depth values decreased and became more shallow when CAS was presented (f=32.8; p<0.0001). In the absence of CAS, overall mean depth across all frequencies and subjects was 7.45 dB and with CAS presented, mean depth was 6.45 dB (Fig. 5, lower panel).
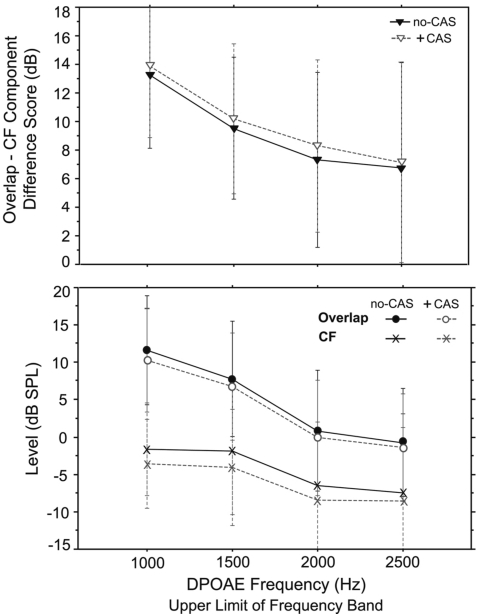
Previous analyses showed a significant difference between DP component levels (overlap level>CF level). The effect of CAS on this difference was analyzed by computing a difference score between component levels and testing it with a repeated measures ANOVA (CAS condition×frequency). Results showed an effect of both CAS (f=5.8; p=0.02) and DP frequency (f=9.7; p<0.0001) on the component level difference score. (See Fig. 6, upper panel.) The presentation of CAS increased the level difference between components by reducing CF levels more than overlap component levels. (See Fig. 6, lower panel.) MOC activation produced a mean reduction of 1.2 dB in the level of the overlap component, compared to 1.8 dB for the CF component level.
Figure 6.
Upper panel: Mean difference scores reflecting the level difference between overlap and CF components as a function of DP frequency. The filled triangles represent no-CAS and the open triangles represent +CAS. Lower panel: Mean level for the overlap and CF components in no-CAS and +CAS conditions. Error bars reflect ±1 s.d.
The MOC effect
Reliability
Prior to quantifying the MOC reflex, initial tests were conducted to establish the reliability of DPOAE level changes attributed to CAS. A three-way repeated measures ANOVA (CAS condition×frequency×trial) was conducted on DPOAE level. However, unlike the MOC reflex that was quantified at maximum frequencies only, this initial measure was conducted with all level estimates (n∼900) across the frequency range, regardless of their position in the fine structure pattern. The ANOVA showed a main effect of noise on DPOAE level (f=37.1; p<0.0001) but no main effect of trial (p=0.66). Overall, the mean difference between DPOAE level recorded during trials 1 and 2 was 0.24 dB, whereas the overall difference in DPOAE level between no-CAS and +CAS noise conditions was 0.9 dB. These results suggest that changes in DPOAE level produced by CAS exceeded natural changes in DPOAE level that occur for any given subject during multiple trials. Thus, the test-retest reliability of the MOC reflex is high and changes in DPOAE level attributed to CAS cannot be easily assigned to random intrasubject variability.
MOC reflex
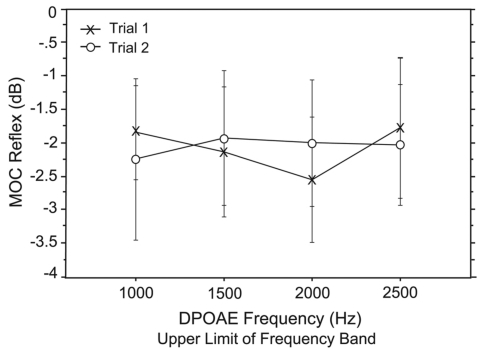
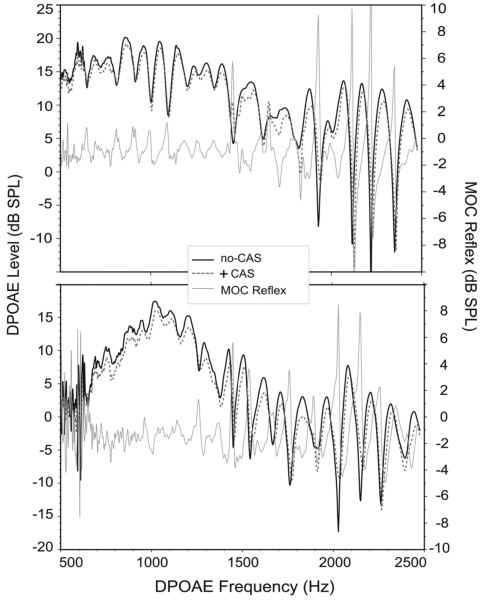
When the MOC reflex was measured at only peak frequencies, 97% of data points reflected suppression. In contrast, if the MOC reflex was measured at all frequencies—not just fine structure maxima—only 68% of data points across all subjects and trials reflected level suppression and 32% reflected no change or level enhancement. MOC-induced suppression ranged from −1.93 dB at 1000 Hz to −2.47 dB at 2000 Hz with a mean of −2.05 dB as shown in Fig. 7. Figure 8 shows an example of DPOAE fine structure with and without CAS for four adult subjects. As is evident from this figure, very little response enhancement was observed at peak frequencies. Figure 9 shows fine structure in no-CAS and +CAS conditions for the same subjects shown in Figs. 8a, 8d, but with the MOC reflex superimposed (and referenced to the right axis) to illustrate these findings in more detail. At fine structure minima, there was most often no change or DPOAE level enhancement with CAS, as evident from sharp spikes in the MOC reflex toward positive values around dips in fine structure. Conversely, around maxima, consistent decreases in DPOAE level were noted. No effect of trial or DP frequency was observed on the MOC reflex.
Figure 7.
Mean MOC reflex (defined as the difference between DPOAE level in no-CAS and +CAS conditions) calculated at DPOAE fine structure maximum frequencies only and shown as a function of DP frequency. Data were collected during two separate trials conducted within the same test session for 15 adults. Error bars reflect ±1 s.d.
Figure 8.
DPOAE fine structure for four adult subjects with no-CAS, which is depicted with a solid black line, and in +CAS, which is depicted by a dashed gray line.
Figure 9.
DPOAE fine structure from the two adult subjects also shown in panels (d) and (a) of Fig. 8. The no-CAS condition is depicted with a solid black line and +CAS with a dashed line. The corresponding MOC reflex (gray solid line) is superimposed on fine structure and referenced to the right axis.
MOC shift
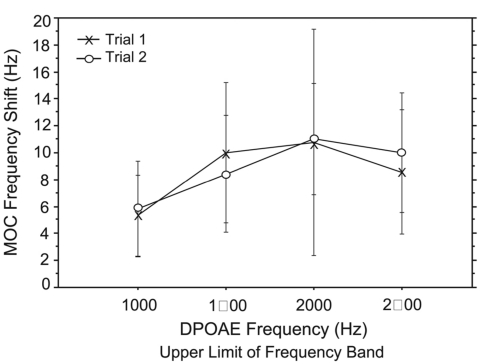
As can be seen in Fig. 8, CAS also produced a shift in fine structure peak frequency. When peaks shifted, they shifted upward in frequency 80% of the time. The shift ranged from 5.9 Hz at 1000 Hz to 10.6 Hz at 2000 Hz (Fig. 10). There was no effect of trial on MOC shift but a significant effect of frequency (f=4.4; p=0.007); shift increased with increasing DPOAE frequency. As a secondary analysis the shift was quantified as a ratio (f∕Δf), the alpha level was adjusted, and the ANOVA was repeated with no significant effect of trial or frequency.
Figure 10.
Mean MOC shift (defined as an upward shift in fine structure peak frequency with the presentation of CAS) as a function of DP frequency for 15 adult subjects. Error bars reflect ±1 s.d.
DISCUSSION
Normative fine structure
The data from these normal-hearing, healthy young adults collected using a swept tone paradigm are comparable to normative fine structure data previously reported in literature (Reuter and Hammershøi, 2006). Reuter and Hammershøi (2006) reported two to three “ripples” or fine structure periods in each 1∕3 octave interval and the present study reports an average of 2.25 per 1∕3 octave. Additionally,Reuter and Hammershøi (2006) reported fine structure depth to be between 3 and 9 dB, depending to some extent on frequency, and we reported mean depth values of between 4 and 10 dB, with increasing depth in the mid- to high-frequency ranges.
The absolute spacing values reported in the present study are generally consistent with Reuter and Hammershøi (2006) and hover around 100–125 Hz in the midfrequency ranges. This is a bit lower than other reports, considering some have identified average spacing intervals of 157 Hz from 1.8–2.6 Hz (Engdahl and Kemp, 1996) and 180 Hz between 2000 and 4000 Hz. The differences in absolute spacing intervals may be due to slight differences in the algorithms used to calculate spacing. Additionally, the swept tone recording paradigm has much greater frequency resolution than those used in past studies and, therefore, this approach may have been able to define spacing intervals with greater accuracy. As expected, larger spacing intervals with increased DPOAE frequency were observed in the present study, consistent with past reports (Reuter and Hammershøi, 2006; He and Schmiedt, 1993; Engdahl and Kemp, 1996; Heitmann et al., 1996). Changes in the spacing ratio index as a function of frequency were also observed and are somewhat surprising considering the presumed scaling symmetry along the basilar membrane. The observed increases in spacing ratio with increases in DPOAE frequency may suggest deviations from scaling symmetry and warrant further investigation to elucidate the source of this finding.
In addition to showing good agreement with the most current normative fine structure data, these findings also suggest that two trials from the same individual produce DPOAE level (component and composite) and fine structure features that do not differ significantly. This suggests stable fine structure within a subject. The two trials occurred within the same 2 h session and did not include a probe refitting but did include normal head and body movements during testing breaks. Reuter and Hammershøi (2006) also studied the repeatability of DPOAE fine structure in normal-hearing adults and found generally stable intrasubject fine structure patterns both within session and 4 weeks after the initial test.
Effects of CAS on DPOAE fine structure and components
Few reports exist on the effects of CAS (i.e., MOC activation) on DPOAE fine structure or individual DP components. In this study, effects of CAS on fine structure spacing were observed only in the low-frequency band (500–1000 Hz). However, as noted in Sec. 3, the spacing average in this frequency band was based on only half the number of individual values compared to the other frequency-band averages. It is possible that this may have produced excessive variability in the estimate and influenced the result. Only one other study has addressed this issue and reported no change in periodicity of fine structure with presentation of contralateral noise (Sun, 2005). However, the data were reported on limited subjects, not analyzed statistically and unpublished, making comparison tenuous. We also found that the presentation of CAS made DPOAE fine structure more shallow (on average by 1 dB), which is consistent with results reported by Sun (2005).
The data shown in Fig. 6 show that CAS reduced the CF component level more than it reduced overlap levels, which suggests that the MOC reflex differentially affects the two DPOAE sources. This likelihood has been suggested by various researchers (Maison and Liberman, 2000; Müller et al., 2005; Sun, 2008b) and is not unexpected. The MOC reflex is thought to act more strongly on the basilar membrane response to low-level stimulation. Consistent with this, indices of MOC function are often reported to be most robust at low stimulus levels (Abdala et al., 1999; Moulin et al., 1993; Janssen et al., 2003). The component at DP CF is considered a low-level reflection source associated with cochlear amplifier function. The low-level nature of this component may make it particularly sensitive to changes in basilar membrane vibration and, thus, more susceptible to MOC activation. Others have hypothesized this same effect and have suggested that CAS should have its most significant effect on the reflection component of the DPOAE (Long et al., 2004). Our findings are consistent with this hypothesis.
The MOC reflex at fine structure maxima
It is highly unlikely that the middle ear muscle reflex was activated or can account for DPOAE suppression evoked by 60 dB SPL of contralateral noise. A typical clinical instrument has a middle ear muscle threshold of 75 dB SPL for broadband noise (Gelfand, 1984) whereas a more sensitive piece of research equipment may detect thresholds around 65 dB SPL (Guinan et al., 2003; Guinan, 2006). Thus, presenting a 60 dB SPL noise elicitor of MOC activity is unlikely to produce interference from middle ear muscle reflexes. An important caveat is that studies defining the middle ear muscle (MEM) reflex threshold to broadband noise cannot fully represent the paradigm used here since pure tones (f1 and f2) are not presented simultaneously to the opposite ear. This bilateral stimulation could lower MEM reflex threshold. It is not possible to be unequivocally certain that MEM reflexes are not activated with this combination of stimuli. A recent study argues against the likelihood of MEM reflex interference. Sun (2008a) found that contribution from the acoustic reflex to measures of DPOAE contralateral suppression is negligible, if present at all, when CAS is presented below the acoustic reflex threshold. Adult subjects in Sun’s (2008a) study had a median reflex threshold for broadband noise of 85 dB SPL (range=70–100 dB SPL) and even when contralateral noise was presented at high enough levels to elicit the MEM reflex, the added effect on DPOAE level recorded in the opposite ear was insignificant.
In the present study, overall MOC-induced suppression averaged −2.05 dB (mean s.d.=0.965) when measured only at fine structure maxima. The magnitude of the MOC reflex recorded in the present study is somewhat larger than in our past work. Abdala et al. (1999) measured DPOAE contralateral suppression in normal-hearing adults without considering fine structure or the phase relationship between components and found MOC reflexes averaging 1.2 dB across frequency. Additionally, we reported greater intersubject variability (larger standard deviations) with respect to MOC reflex estimates than was observed here. Moulin et al. (1993) reported contralateral suppression ranging from 0.68 to 2.0 dB in normal-hearing adults, while Williams and Brown (1995) described mean values ranging from 1.1 to 1.9 dB in adult subjects. Thus, in the present study, by recording the MOC reflex at peak frequencies in fine structure only, the magnitude of the reflex was at least equal to and generally more robust than earlier studies that did not consider DPOAE fine structure. Additionally, the MOC reflex recorded in this study was a less variable assay than reflex measures reported in past studies, consistent with recent findings reported by Sun (2008b). Because episodes of enhancement were almost completely eliminated, the large swings between negative and positive reflex values were not present in our recordings and, therefore, variability was constrained. If all DPOAE frequencies spanning the entire test range of 500–2500 Hz (not just peak frequencies) were considered, DP level enhancement was observed in one-third of all data points. Müller et al. (2005) similarly found that 31% of their data points reflected enhancement of DPOAE level when measured at dips in fine structure. By eliminating these observations, we have lessened variability associated with estimates of the MOC reflex.
The “true” MOC reflex
Our results indicate that MOC activation does not suppress each component equally, explaining why DPOAE level will sometimes increase with CAS. In past studies of MOC activation in humans, including one from our own laboratory, target frequencies were selected without regard for DPOAE fine structure. Thus, when recording the MOC reflex at a given frequency, researchers were not certain of the phase relationship between the primary components contributing to the DPOAE. As briefly considered in Sec. 1, if the DP components were out of phase at the test frequency selected, and one of the components was influenced by MOC activation more than the other, the phase relationship between them could shift, producing a release of cancellation. The result is often a marked enhancement of DPOAE level. DPOAE level enhancement around fine structure minima only is clearly noted in Fig. 9 and typifies the data collected in this study and reported elsewhere (Sun, 2005; Sun, 2008b; Zhang et al., 2007). Like the present study, Sun (2008b) reported that CAS reduces DPOAE level at peak frequencies in fine structure, while producing little change or even enhancement in level at minima. Zhang et al. (2007) similarly found larger suppression values at fine structure peaks versus dips and reported less variability in measures of the MOC reflex when recorded at maxima.
In contrast to the strategy proposed here, that MOC effects be measured at DPOAE fine structure peak frequencies only, some investigators have specifically targeted fine structure dips for measurement of the MOC reflex. These investigators argue that a “bipolar” MOC effect, including both suppression and enhancement values, will be more robust than suppression alone. Müller et al. (2005) recorded DPOAEs at dip frequencies while systematically presenting varied L1∕L2 combinations in normal-hearing adults. With the presentation of CAS, they found an overall mean swing in DPOAE level from suppression to enhancement of 14 dB with small changes in primary tone level separation. Müller et al. (2005) suggested that this bipolar MOC effect was a tool well suited to measuring the strength of the MOC reflex in humans because it provided larger reflex values. Wagner et al. (2007) similarly recommended measuring MOC reflex only at dips in DPOAE fine structure because of these large bidirectional effects.
Results of the present study argue strongly against recording large bidirectional swings in DPOAE level and suggest that these indices do not accurately reflect MOC reflex strength. As primary tone level separation is altered and∕or CAS is presented, the phase relationship between dual sources comprising the ear canal DPOAE shifts. The large, abrupt swings between suppression and enhancement most likely represent the changing phase relationship between these two components, not the strength of the MOC reflex. For this very reason, the present study chose to control for these shifts in component phase relationship by recording the MOC reflex only at fine structure peak frequencies. By choosing a maximum frequency, it was certain that both components were in a constructive relationship. Thus, any alteration in either component by CAS would produce a reduction in amplitude, as reliably shown for 97% of MOC reflex data points in this study. This stable reduction in amplitude of around 2 dB, though smaller than the large bidirectional effects, is reliable and more strongly linked to underlying MOC activation. The fact that we were able to eliminate DPOAE level enhancement almost completely by controlling the phase relationship between components during activation of the MOC reflex supports our contention that shifts in phase produce the large bipolar swings reported in literature. An additional advantage of measuring the MOC reflex at peak frequencies only is that DPOAE level is always significantly higher at maxima than at minima; thus, signal-to-noise ratio is better.
Finally, we have detected another effect of MOC activation on DPOAE fine structure that may serve as an additional index of MOC integrity. A mean frequency shift of 5–10 Hz was observed for some fine structure peaks with CAS. This effect has been reported in previous literature (Sun 2005; Sun, 2008b; Mauermann and Kollmeier, 2004) but not well defined or quantified. Future studies are warranted to further elucidate the mechanism and biological significance of this frequency shift.
CONCLUSIONS
The results of this study suggest that recording DPOAE contralateral suppression as an index of the MOC reflex is most effective at fine structure peak frequencies to exert some control over acoustic mixing of DP components. This mixing may interfere with accurate estimates of MOC reflex strength. When measured at peak frequencies only, episodes of DPOAE level enhancement were eliminated and 97% of all data points showed suppression. This is unlike past reports, that used the DPOAE-based CAS paradigm with no regard for fine structure and found DPOAE level enhancement in one-third of all observations. Findings in the present study suggest that when measured at DPOAE fine structure maxima, moderate levels of CAS reliably reduce the DPOAE by approximately 2 dB. We argue that this reduction in level more strongly reflects MOC activation and minimizes the effect of spurious phase shifts between components in the ear canal. Reducing and∕or controlling for unwanted sources of variance moves us toward the noteworthy goal of developing a diagnostic assay of the human MOC reflex to assess integrity of the auditory system.
ACKNOWLEDGMENTS
This research was supported by the National Institutes of Health, NIDCD R01 DC003552, the A. Charles Holland Foundation, and the House Ear Institute. The authors would like to thank Dr. Sumitrajit Dhar for his input both during the analysis of these data and during the writing of this manuscript.
References
- Abdala, C., Ma, E., and Sininger, Y. S. (1999). “Maturation of medial efferent system function in humans,” J. Acoust. Soc. Am. 10.1121/1.426844 105, 2392–2402. [DOI] [PubMed] [Google Scholar]
- Agrama, M. T., Waxman, G. M., Stagner, B. B., Martin, G. K., and Lonsbury-Martin, B. L. (1998). “Effects of efferent activation on distortion-product otoacoustic emissions in normal humans using ipsilateral acoustic stimulation,” 21st Annual Midwinter Meeting of the Association for Research in Otolaryngology, Abstract 605.
- Bassim, M. K., Miller, R. L., Smith, D. W., and Buss, E. (2003). “Rapid adaptation of the 2f1-f2 DPOAE in humans: Binaural and contralateral stimulation effects ,” Hear. Res. 10.1016/S0378-5955(03)00190-4 182, 140–152. [DOI] [PubMed] [Google Scholar]
- Collet, L., Kemp, D. T., Veuillet, E., Duclaux, R., Moulin, A., and Morgon, A. (1990). “Effect of contralateral auditory stimuli on active cochlear micro-mechanical properties in human subjects,” Hear. Res. 10.1016/0378-5955(90)90232-E 43, 251–261. [DOI] [PubMed] [Google Scholar]
- Dhar, S., and Abdala, C. (2007). “A comparative study of distortion-product-otoacoustic-emission fine structure in human newborns and adults with normal hearing,” J. Acoust. Soc. Am. 10.1121/1.2770544 122, 2191–2202. [DOI] [PubMed] [Google Scholar]
- Dhar, S., Talmadge, C. L., Long, G. R., and Tubis, A. (2002). “Multiple internal reflections in the cochlea and their effect on DPOAE fine structure,” J. Acoust. Soc. Am. 10.1121/1.1516757 112, 2882–2897. [DOI] [PubMed] [Google Scholar]
- Engdahl, B., and Kemp, D. T. (1996). “The effect of noise exposure on the details of distortion product otoacoustic emissions in humans,” J. Acoust. Soc. Am. 10.1121/1.414733 99, 1573–1587. [DOI] [PubMed] [Google Scholar]
- Gelfand, S. A. (1984). “The contralateral acoustic-reflex threshold,” in The Acoustic Reflex, edited by Silman S. (Academic, Orlando, FL: ), pp. 137–186. [Google Scholar]
- Guinan, J. J., Jr. (2006). “Olivocochlear efferents: Anatomy, physiology, function, and the measurement of efferent effects in humans,” Ear Hear. 10.1097/01.aud.0000240507.83072.e7 27, 589–607. [DOI] [PubMed] [Google Scholar]
- Guinan, J. J., Jr., Backus, B. C., Lilaonitkul, W., and Aharonson, V. (2003). “Medial olivocochlear efferent reflex in humans: Otoacoustic emission (OAE) measurement issues and the advantages of stimulus frequency OAEs,” J. Assoc. Res. Otolaryngol. 4, 521–540. [DOI] [PMC free article] [PubMed] [Google Scholar]
- He, N., and Schmiedt, R. A. (1993). “Fine structure of the 2f1-f2 acoustic distortion product: Changes with primary levels ,” J. Acoust. Soc. Am. 10.1121/1.407350 94, 2659–2669. [DOI] [PubMed] [Google Scholar]
- Heitmann, J., Waldmann, B., and Plinkert, P. K. (1996). “Limitations in the use of distortion product otoacoustic emissions in the objective audiometry as the result of fine structure,” Eur. Arch. Otorhinolaryngol. 253, 167–171. [DOI] [PubMed] [Google Scholar]
- Janssen, T., Gehr, D. D., and Kevanishvilli, Z. (2003). “Contralateral DPOAE suppression in humans at very low sound intensities,” in Biophysics of the Cochlea: From Molecules to Models, edited by Gummer A. W. (World Scientific, London: ), pp. 498–505. [Google Scholar]
- Kim, D. O. (1980). “Cochlear mechanics: Implications of electrophysiological and acoustical observations,” Hear. Res. 10.1016/0378-5955(80)90064-7 2, 297–317. [DOI] [PubMed] [Google Scholar]
- Kim, D. O., Dorn, P. A., Neely, S. T., and Gorga, M. P. (2001). “Adaptation of distortion product otoacoustic emissions in humans,” J. Assoc. Res. Otolaryngol. 2, 31–40. [DOI] [PMC free article] [PubMed] [Google Scholar]
- Liberman, M. C., Puria, S., and Guinan, J. J., Jr. (1996). “The ipsilaterally evoked olivocochlear reflex causes rapid adaptation of the 2f1-f2 distortion product otoacoustic emission ,” J. Acoust. Soc. Am. 10.1121/1.414956 99, 3572–3584. [DOI] [PubMed] [Google Scholar]
- Long, G. R., Lee, J., and Talmadge, C. (2004). “Using sweeping tones to evaluate DPOAE fine structure,” 27th Annual Midwinter Meeting of the Association for Research in Otolaryngology, Abstract 1076.
- Long, G. R., Talmadge, C. L., and Lee, J. (2008). “Measuring distortion product otoacoustic emissions using continuously sweeping primaries,” J. Acoust. Soc. Am. 10.1121/1.2949505 124, 1613–1625. [DOI] [PMC free article] [PubMed] [Google Scholar]
- Maison, S. F., and Liberman, M. C. (2000). “Predicting vulnerability to acoustic injury with a noninvasive assay of olivocochlear reflex strength,” J. Neurosci. 20, 4701–4707. [DOI] [PMC free article] [PubMed] [Google Scholar]
- Mauermann, M., and Kollmeier, B. (2004). “Distortion product otoacoustic emission (DPOAE) input∕output functions and the influence of the second DPOAE source,” J. Acoust. Soc. Am. 10.1121/1.1791719 116, 2199–2212. [DOI] [PubMed] [Google Scholar]
- Moulin, A., Collet, L., and Duclaux, R. (1993). “Contralateral auditory stimulation alters acoustic distortion products in humans,” Hear. Res. 10.1016/0378-5955(93)90213-K 65, 193–210. [DOI] [PubMed] [Google Scholar]
- Müller, J., Janssen, T., Heppelmann, G., and Wagner, W. (2005). “Relationship between fine-structure, contralateral suppression, and ipsilateral adaptation of distortion product otoacoustic emissions in humans,” J. Acoust. Soc. Am. 10.1121/1.2109127 118, 3747–3756. [DOI] [PubMed] [Google Scholar]
- Puel, J. L., and Rebillard, G. (1990). “Effects of contralateral sound stimulation on the distortion product 2f1-f2: Evidence that the medial efferent system is involved,” J. Acoust. Soc. Am. 10.1121/1.399410 87, 1630–1635. [DOI] [PubMed] [Google Scholar]
- Reuter, K., and Hammershøi, D. (2006). “Distortion product otoacoustic emission fine structure analysis of 50 normal-hearing humans,” J. Acoust. Soc. Am. 10.1121/1.2205130 120, 270–279. [DOI] [PubMed] [Google Scholar]
- Shera, C. A. (2003). “Mammalian spontaneous otoacoustic emissions are amplitude-stabilized cochlear standing waves,” J. Acoust. Soc. Am. 10.1121/1.1575750 114, 244–262. [DOI] [PubMed] [Google Scholar]
- Shera, C. A., and Guinan, J. J., Jr. (1999). “Evoked otoacoustic emissions arise by two fundamentally different mechanisms: A taxonomy for mammalian OAEs,” J. Acoust. Soc. Am. 10.1121/1.426948 105, 782–798. [DOI] [PubMed] [Google Scholar]
- Sun, X. M. (2005). “Distortion product otoacoustic emission (DPOAE) fine structure is responsible for the variability of DPOAE contralateral suppression effect,” 25th Annual Midwinter Meeting of the Association for Research in Otolaryngology, Abstract 1327.
- Sun, X. M. (2008a). “Contralateral suppression of distortion product otoacoustic emissions and the middle-ear muscle reflex in human ears,” Hear. Res. 10.1016/j.heares.2007.12.004 237, 66–75. [DOI] [PubMed] [Google Scholar]
- Sun, X. M. (2008b). “Distortion product otoacoustic emission fine structure is responsible for variability of distortion product otoacoustic emission contralateral suppression,” J. Acoust. Soc. Am. 10.1121/1.2912434 123, 4310–4320. [DOI] [PubMed] [Google Scholar]
- Talmadge, C. L., Long, G. R., Tubis, A., and Dhar, S. (1999). “Experimental confirmation of the two-source interference model for the fine structure of distortion product otoacoustic emissions,” J. Acoust. Soc. Am. 10.1121/1.424584 105, 275–292. [DOI] [PubMed] [Google Scholar]
- Wagner, W., Heppelmann, G., Müller, J., Janssen, T., and Zenner, H. P. (2007). “Olivocochlear reflex effect on human distortion product otoacoustic emissions is largest at frequencies with distinct fine structure dips,” Hear. Res. 10.1016/j.heares.2006.10.001 223, 83–92. [DOI] [PubMed] [Google Scholar]
- Williams, D. M., and Brown, A. M. (1995). “Contralateral and ipsilateral suppression of the 2f1-f2 distortion product in human subjects ,” J. Acoust. Soc. Am. 10.1121/1.412226 97, 1130–1140. [DOI] [PubMed] [Google Scholar]
- Withnell, R. H., Shaffer, L. A., and Talmadge, C. L. (2003). “Generation of DPOAEs in the guinea pig,” Hear. Res. 10.1016/S0378-5955(03)00064-9 178, 106–117. [DOI] [PubMed] [Google Scholar]
- Zhang, F., Boettcher, F. A., and Sun, X. M. (2007). “Contralateral suppression of distortion product otoacoustic emissions: Effect of the primary frequency in Dpgrams,” Int. J. Audiol. 46, 187–195. [DOI] [PubMed] [Google Scholar]


