Abstract
Both mechanically induced acoustic cavitation and thermally induced boiling can occur during high intensity focused ultrasound (HIFU) medical therapy. The goal was to monitor the temperature as boiling was approached using magnetic resonance imaging (MRI). Tissue phantoms were heated for 20 s in a 4.7-T magnet using a 2-MHz HIFU source with an aperture and radius of curvature of 44 mm. The peak focal pressure was 27.5 MPa with corresponding beam width of 0.5 mm. The temperature measured in a single MRI voxel by water proton resonance frequency shift attained a maximum value of only 73 °C after 7 s of continuous HIFU exposure when boiling started. Boiling was detected by visual observation, by appearance on the MR images, and by a marked change in the HIFU source power. Nonlinear modeling of the acoustic field combined with a heat transfer equation predicted 100 °C after 7 s of exposure. Averaging of the calculated temperature field over the volume of the MRI voxel (0.3×0.5×2 mm3) yielded a maximum of 73 °C that agreed with the MR thermometry measurement. These results have implications for the use of MRI-determined temperature values to guide treatments with clinical HIFU systems.
INTRODUCTION
The use of high intensity focused ultrasound (HIFU) for tissue ablation is rapidly achieving clinical acceptance for a wide range of medical applications.1, 2, 3, 4 The tissue ablation mechanism in the majority of these applications is coagulative necrosis, induced by heating of the tissue due to absorption of the intense ultrasound. Heating is often monitored by magnetic resonance imaging (MRI), in which the tissue temperature is calculated from direct measurements of the MR-signal phase change resulting from the water proton resonance frequency shift.5 The temperature measurements are then used to calculate the region of necrosed tissue—the lesion—based on a thermal dose criterion.6 MRI monitoring and lesion determination are used in the only clinical, transcutaneous HIFU device approved by the United States Food and Drug Administration (FDA).7 New treatment protocols are also being developed on this and similar machines that use high-amplitude ultrasonic pulses on the presumption of creating cavitation bubbles in tissue for enhanced heating.8, 9, 10, 11 However, enhanced heating can also occur due to nonlinear propagation effects, and such heating may be sufficient to cause boiling bubbles.12 When bubbles and enhanced heating have been observed in vivo, the MRI-determined temperature was less than 100 °C, and the result was interpreted as cavitation-enhanced heating.10 We speculate that the peak temperature may have been higher and that bubbles were due to boiling, the consequence, not the cause, of enhanced heating.
Acoustic cavitation and nonlinear acoustic propagation are two nonlinear mechanisms that can enhance HIFU heating beyond that expected to be produced by absorption at the HIFU excitation frequency. Nonlinear acoustic propagation distorts the HIFU wave and causes acoustic energy to be pumped from the fundamental excitation frequency to higher harmonic frequencies. Higher frequencies are more readily absorbed than lower ones and thus generate enhanced heating.12, 13, 14 An additional effect of nonlinear propagation is that the extra heating and initial boiling, if attained, are more localized than would be expected assuming linear propagation conditions.14, 15 One way to increase nonlinear effects is to increase the acoustic pressure as this accelerates the waveform distortion. With a sufficient pressure amplitude, nonlinear acoustic propagation results in a shock wave, which contains hundreds of harmonics and can cause boiling in milliseconds.16
Cavitation bubbles are nonlinear scatterers that result in acoustic re-radiation at frequencies higher than the fundamental HIFU wave and therefore generate enhanced HIFU heating.9, 11 The bubbles may also cause heating by viscous damping of their oscillations17 and by diffusion of heat from their gaseous interiors that are heated when compressed in oscillation.18 Increasing acoustic pressure amplitude may increase cavitation-enhanced heating as more bubble nuclei are recruited and bubbles are driven into more violent oscillation. Cavitation-enhanced heating has been demonstrated in tissue-mimicking phantoms, where the cavitation threshold is likely lower than in tissue, and only at low HIFU pressures (peak negative pressure amplitude <4 MPa).9, 19 Within this range, a small increase in HIFU pressure amplitude led to both detectable cavitation activity and significantly greater heating measured by thermocouples.9, 19 Other observations of enhanced heating that were attributed to cavitation are summarized in Ref. 9.
Cavitation and boiling bubbles created by HIFU are visibly distinct when observed in optically transparent gel, tissue phantoms.16 The cavitation or mechanically generated bubbles are diffuse and micron-sized, whereas the boiling or thermally generated bubbles are focal and millimeter-sized. Given sufficient acoustic pressures within the clinical range, both types of bubbles can appear quickly––cavitation in microseconds and boiling in milliseconds.16, 20 Several acoustic techniques have been reported to differentiate the two phenomena.15, 16, 21, 22 However, few of these techniques have yet been applied in bio-effect studies.
In bio-effect studies, in particular, all bubble activity is often categorized as cavitation, and the appearance of a bubble is a treatment-altering event.23 Bubbles cause backscatter of HIFU which results in distortion and migration of the lesion,24 scatter of imaging ultrasound that can be detected and used for guidance,25 and mechanical erosion of tissue.26In vitro studies suggest that the contribution of cavitation in at least the first two of these effects—acoustic backscatter and lesion distortion—is negligible compared to that of boiling, which might be expected since boiling bubbles are much larger.15 The tissue ablation arising from boiling and cavitation bubbles may also be different because of their size, motion, and surrounding temperature. Whether the clinical goal is to use cavitation or boiling bubbles or to avoid them in treatments, it is necessary to understand how the bubbles are created.
One example is to determine how enhanced heating and the presence of bubbles are related. A study that is commonly cited in the HIFU literature of cavitation-enhanced heating in vivo is that by Sokka et al.10 In this study, a short (0.5-s) high-amplitude pulse, preceding a long low-amplitude pulse, caused a greater MR-measured temperature rise compared to only a long low-amplitude pulse. The authors may have assumed that the detected bubble activity was not boiling (and therefore bubbles were the cause not the result of enhanced heating) because the temperature measured by MRI did not reach 100 °C. This threshold temperature for HIFU-induced boiling to occur in tissue has been justified by calculations16, 22 and thermocouple measurements.22, 27 Although bubbles have been detected in MRI measurements in tissue, there have been no results reporting the use of MRI to detect HIFU-induced boiling and to distinguish boiling from cavitation.
The goal of this research was to use MR as an imaging technique to observe boiling during HIFU exposure and simultaneously to use MR thermometry to measure the temperature when boiling occurred. The accuracy of MRI temperature measurements was investigated by comparing the time to boil and the temperature rise measured by MR to those determined using other experimental techniques as well as theoretical modeling based on the Khokhlov-Zabolotskaya-Kuznetsov (KZK) equation. The study was designed to enable a high MRI resolution and to work under well-controlled experimental conditions. Prior to the MR experiments, the acoustic field of the HIFU source was characterized, the cavitation pressure threshold and the temperature when boiling started in the phantoms were determined, and numerical simulations of the acoustic and temperature fields were performed.
THEORY
The temperature rise in the gel tissue phantom was numerically modeled by coupling an acoustic propagation model with a heat transfer model. The model equations and solution techniques have been described in previous publications and are only briefly summarized here.12, 15 A comparison of simulations and measurements of the acoustic field in water and gel for a source nearly identical to the one used here has also been reported.28
The HIFU field was modeled using a KZK-type nonlinear parabolic equation,15 generalized for the frequency-dependent absorption properties of the propagation medium:
| (1) |
Here p is the acoustic pressure, z is the propagation coordinate along the axis of the beam, τ=t−z∕c0 is the retarded time, c0 is the sound speed, ρ0 is the ambient density of the medium, β is the coefficient of nonlinearity, Δ⊥=∂2∕∂r2+r−1∂∕∂r is the Laplacian with respect to the transverse coordinate r, and Labs is the linear operator that accounts for absorption and dispersion in the medium.
The propagation of ultrasound was through a two-layer medium, consisting of water and gel. For water, the thermoviscous absorption was included as
| (2) |
where b is the dissipative parameter of water. For the tissue phantom, the operator Labs accounted for the measured power law of absorption:
| (3) |
where α0 is the absorption coefficient at the fundamental frequency f0. Small variation in the sound speed with frequency was calculated from the absorption law, Eq. 3, using local dispersion relations.12
The boundary condition for Eq. 1 was determined using the combined modeling and measurement calibration technique developed in a previous paper.28 Equation 1 was then solved numerically in the frequency-domain. First, the acoustic pressure waveform was represented as a Fourier series expansion. Next, the set of nonlinear, coupled differential equations for the amplitudes of the harmonics were derived and integrated numerically using the method of fractional steps with an operator-splitting procedure.15 Acoustic waveforms p(τ,z,r), spatial distributions of the intensities In of the harmonics nf0, and total intensity of the wave
| (4) |
were calculated. The distribution of heat sources qv due to absorption of ultrasound,
| (5) |
was obtained for further simulation of the temperature rise in the phantom.
The values of the physical constants used for acoustic modeling were ρ0=1000 kg∕m3, c0=1486 m∕s, β=3.5, and b=4.33×10⁻³ kg s−1 m−1 for water and ρ0=1044 kg∕m3, c0=1544 m∕s, β=4.0, and α0=1.6 m−1 at 1 MHz, η=1, for the tissue phantom.29 Changes in the acoustic parameters of the phantom due to HIFU-induced heating were not considered in the simulations.
To quantify the effect of acoustic nonlinearity under the experimental conditions employed in this study, simulations were also performed assuming linear HIFU propagation by setting β=0 in Eq. 1. In linear simulations, the HIFU waveforms remained sinusoidal; the intensity IL included the intensity of the first harmonic only,
| (6) |
and corresponded to the more common but less accurate linearly derated intensity typically used in HIFU studies. The distribution of heat sources was calculated as twice the product of the intensity and the absorption coefficient at the source operating frequency
| (7) |
The temperature rise in the phantom was modeled using the heat transfer equation
| (8) |
where T is the temperature in the phantom, cv is the heat capacity per unit volume, k is the thermal diffusivity, and qv is the distribution of thermal sources obtained from either nonlinear, Eq. 5, or linear, Eq. 7, acoustic simulations. Equation 8 was integrated numerically using finite differences.12 The thermal properties of the phantom used in simulations were cv=5.3×10⁶ J m−3 °C−1 and k=1.3×10⁻⁷ m2∕s.29
EXPERIMENTAL METHODS
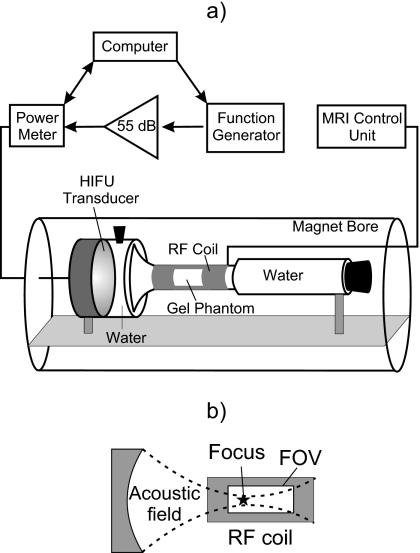
The experimental arrangement is shown in Fig. 1. The transducer, coupling medium (degassed water), and tissue phantom were housed in a custom-designed cylindrical acrylic enclosure that was centered within the bore of the magnet. The 5-cm-long, 2.5-cm-diameter phantom sample was positioned at the focus of the transducer in the narrowest part of the enclosure, which was wrapped by an Alderman–Grant type radiofrequency (rf) volume coil. The phantom was narrow and could therefore be placed in a small volume coil, which provided a good filling factor, increased the signal-to-noise ratio, and optimized the spatial and temporal resolution. A water-filled Tygon tube capped with an acoustically absorptive rubber stopper was placed distal to the coil to prevent reflections in the experimental arrangement. The driving electronics were located outside the magnet room and consisted of a laptop computer running LABVIEW (National Instruments, Austin, TX), an HP33150 function generator (Palo Alto, CA), and an ENI A150 amplifier (Bloomington, NY).
Figure 1.
Experimental arrangement (a) and relative position of the transducer focus and the MRI field of view (FOV) (b).
The HIFU transducer had an aperture and radius of curvature of 44 mm and a resonant frequency of 2.185 MHz, and was mounted within the wall of the acrylic enclosure. The source was identical to one previously characterized,28 but the housing was made of polycarbonate instead of metal to be MRI-compatible. The experimental exposure was continuous for 20 s. The electrical power delivered to the source was 63 W, and the acoustic power, measured by radiation force balance, was 49 W.
The tissue-mimicking phantom used in all of the experiments was polyacrylamide gel containing bovine serum albumin (BSA).15, 29 This optically transparent gel tissue phantom has acoustic and thermal properties similar to tissue, although the acoustic attenuation is lower, about one-third of the attenuation in tissue. Advantages of using a tissue phantom instead of tissue include the repeatability and uniformity of the phantom’s acoustic, thermal, and magnetic properties. Samples were degassed in a desiccant chamber for 1 h prior to polymerization. The axial distance from the transducer face to the proximal end of the sample was 35 mm. The geometrical focus of the transducer was within the sample, 9 mm from its proximal end.
Before the MRI experiment, a fiber-optic probe hydrophone (FOPH 2000, RP Acoustics, Leutenbach, Germany) with 100-μm active diameter was used to measure the focal pressure waveform in water and in the gel for the chosen 63-W source output. Waveforms were measured at the spatial maximum of the peak positive pressure, which coincided with the geometric focus of the source and was 44 mm from the transducer in water and in the water∕gel path. Measurements in water were performed with and without the cylindrical housing attached to ensure that the housing did not alter the waveform through reflection or scattering. Measurements in gel were performed without the housing in a slightly different experimental arrangement, but with the same propagation path in gel as used in MRI experiments. The focal waveforms were also modeled in water and in gel using source parameters (aperture, curvature, and electro-acoustic efficiency) determined through previously described calibration of an identical source.28
A rf power meter (model 21 A, Sonic Concepts, Woodinville, WA) was used to monitor the electrical power delivered to the transducer. The power meter readings were recorded by a digital acquisition (DAQ) board (model 6062E, National Instruments, Austin, TX) at 1 kHz. Fluctuation in the power meter signal was used as an indicator of boiling as has been reported previously.19, 30 Fluctuation in the power delivered to the source is the result of variations in the acoustic impedance, caused by the ultrasound that is backscattered from bubbles. The fluctuation is the most pronounced when bubbles appear at the transducer focus. Before the experiments in the magnet, this system was tested simultaneously with other indicators of boiling and cavitation, including a 20-MHz passive acoustic detection9, 16, 19 and a high-speed video camera.31 Obvious fluctuation in the power meter signal was observed only with boiling and not with cavitation. Passive acoustic detection, however, did detect cavitation and was also used to measure the acoustic pressure threshold for cavitation in the tissue phantom. Time to boil, yielded by all the measuring techniques, agreed within a few milliseconds (roughly the camera frame period and the DAQ sampling period). In replicate samples, boiling occurred in 7.2±0.3 s. The slight variation was attributed to the possible small difference among the sample batches, initial temperature, and the distance between the sample face and the transducer as well as stochastic variability in the distribution of boiling nuclei.31 The water temperature in the bench-top experiments was 22±1 °C. In the magnet, the initial temperature of each sample was measured using a thermocouple 2 min before HIFU exposure and was 21±1 °C.
In another set of preliminary experiments, bare-wire thermocouples (130 μm, type E, Omega Engineering, Stamford, CT) were implanted in gels at the focus of the transducer and exposed to the treatment conditions along with simultaneous high-speed camera observation to determine the temperature when boiling occurred. Temperature measurements were recorded at a sampling rate of 250 Hz using a data acquisition device (HP34970A, Hewlett-Packard Corp., Palo Alto, CA). A mount was used to cast the thermocouple and the FOPH in the gel 1 mm apart in the focal plane. Alignment of the HIFU focus with the thermocouple was performed by first finding the peak pressure with the FOPH and then by moving the transducer 1 mm to the thermocouple.
MRI experiments were performed in a 4.7-T Bruker magnet (Bruker Medical Systems, Karlsruhe, Germany) with a 30-cm-diameter bore equipped with a Varian (Varian Inc., Palo Alto, CA) INOVA spectrometer and a custom-built, Alderman-Grant type, rf volume coil with an inner diameter of 2.5 cm. All of the MRI data were collected using a gradient-echo sequence. Both magnitude and phase of the MR signal were acquired to obtain primarily axial images, i.e., images in the plane containing the axis of the cylindrical magnet.
In three of the experimental samples, images were collected during very low energy ultrasound exposure (<2 °C temperature rise for <2 s) 10 min prior to experimental exposure in order to confirm the location of the HIFU focus relative to the center of the magnet and, therefore, to define the location of the acquisition volume. This step was deemed unnecessary for the other three samples, and no difference was observed between the two groups. Single-slice gradient-echo MR images were then acquired continuously for 24 s before, 20 s during, and 100 s after HIFU exposure. The following acquisition parameters were used: matrix size 64×128 pixels, TE=4.2 ms, TR=20 ms, flip angle=20 deg, total image acquisition time of 1.3 s, and field of view (FOV) 30×40 mm2. The in-plane resolution was 0.3×0.5 mm2 and the slice thickness was 2 mm. Several minutes after HIFU exposure, high spatial resolution axial and transverse MR images were acquired to locate and resolve residual bubbles. In the axial sequences, the following parameters were used: 256×256 pixels, TE=7.4 ms, TR=300 ms, flip angle=20 deg, FOV=30×40 mm2, and slice thickness was 2 mm. The voxel volume in these high-resolution images was 120 μm×160 μm×2 mm.
The gradient-echo data were reconstructed to generate both magnitude and phase images. The magnitude images were used to visualize bubbles, and the phase images were used to determine the proton resonance frequency shift.5 Phase shifts were converted to temperature changes using a calibration curve that was obtained for heated water prior to the HIFU measurements.32 The calibration measurement was performed in water, not in the tissue phantom, which is 95% water, to ensure the most uniform temperature throughout the sample volume. To obtain the calibration curve, hot (initially boiling) water was poured into a 6-mm-diameter plastic tube centered in the rf coil used in the HIFU experiments. The tube was plugged to ensure that there was no water flow. A thermocouple was positioned on the tube axis, 2 cm away from the coil center. Gradient-echo images (TR∕TE∕flip angle=24 ms∕4.1 ms∕20 deg, matrix size 64×32, FOV 2×2 cm2, and slice thickness 2 mm) were acquired to monitor resonance frequency changes as the water cooled from 90 to 40 °C.
Eddy currents within the gel, generated by the rapidly switching gradients, caused transient, repeatable phase shifts to occur at the onset of MR data acquisition in the absence of temperature changes. These phase shifts could be mistaken for substantial temperature changes. To correct for this potential artifact, a series of control images was acquired from each gel prior to heating. The MR parameters were identical to those described for the gradient-echo images above, and the resulting series of phase images was subtracted, image by image, from those acquired during HIFU exposure.
RESULTS
Measurements and calculations to characterize experimental conditions
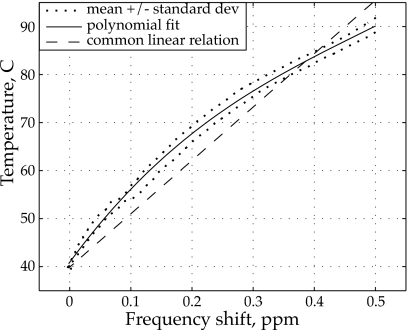
An experimentally measured calibration curve was obtained to determine temperature changes from the MR acquired phase shifts in the tissue phantom. In Fig. 2, the calibration curve of the temperature versus the absolute value of the water proton chemical shift is plotted. A third-order polynomial was determined based on a least-squares fit of the experimental data points:
| (9) |
where δφ is the phase shift of the MR signal and δT is the temperature change relative to 40 °C.32 Equation 9 was used to obtain temperature maps during HIFU exposure instead of the linear relationship 0.009 ppm∕°C that is commonly used for lower field magnets and smaller temperature variations.33, 34 The calibration measurement was only performed one time because it was very difficult safely to get a sufficient volume of water uniformly heated to near 100 °C into the bore of the magnet. Hence, a degree of skepticism should be applied when interpreting the results in Fig. 2. While there are evidence in literature, including Ref. 37 commonly cited for the linear relation, that the dependence between proton resonance frequency and temperature is nonlinear,35, 36, 37, 38 the exact nature of the dependency over broad temperature ranges at 4.7 T requires further validation. Nevertheless, note that the use of the linear relationship would yield lower peak MR-determined temperatures than those reported here.
Figure 2.
Water proton resonance frequency shift calibration curve obtained in the 4.7-T magnet that was used for MR thermometry in present work. The solid line shows a third-order polynomial fit to the mean temperature as determined from 12 measurement points located near the center of the rf coil. The dotted lines show the mean ± standard deviation of the measurements. The linear conversion curve (dashed line) often used in 1.5-T magnets is also shown for comparison.
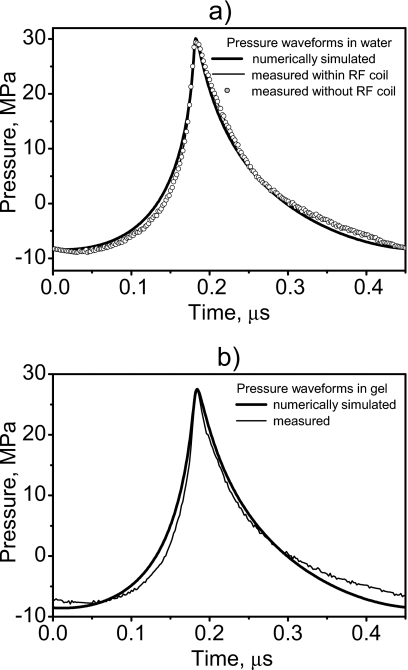
Focal waveforms were measured and modeled in water [Fig. 3a] and in the tissue phantom [Fig. 3b]. The excellent agreement between the waveforms measured in water with and without the cylindrical sample housing attached to the transducer (Fig. 1) indicates that the housing in the MRI experiments did not alter the acoustic field. Modeling of the field could thus be performed assuming free field conditions. The modeled waveforms also agree well with those measured experimentally both in water and in the phantom [Figs. 3a, 3b], which supports the use of simulations to determine acoustic and temperature distributions in the phantom. Note also that part of the calibration procedure28 is to attain agreement between model and measurement in the acoustic distribution for low acoustic excitation. Figure 3 shows that for the source power used in experiments, the combined effects of nonlinear propagation and diffraction led to a typical asymmetric and distorted focal waveform.12 The compression phase was higher in amplitude, steeper, and shorter in duration than in the linearly predicted waveform (shown as a dashed curve). The peak positive pressure was 30 MPa in water and 27.5 MPa in the phantom. The rarefaction phase was lower in amplitude, smoother, and longer in duration than in the linear waveform with peak negative pressure of 8.4 MPa in water and 8.6 MPa in the phantom. Since nonlinear distortion was clearly observed in the focal waveform, enhanced heating due to nonlinear acoustic propagation effects was expected.
Figure 3.
Focal waveforms simulated numerically and measured by the fiber-optic hydrophone in water with and without the cylindrical, water-filled chamber attached (a) and in the phantom (b). The cylindrical housing did not alter the waveform, and the numerical data are in excellent agreement with the measurements.
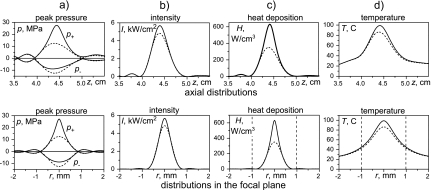
Figure 4 summarizes the results of linear (dashed curves) and nonlinear (solid curves) simulations for various acoustic field parameters and temperature rise in the phantom. Distributions of peak pressure (a), acoustic intensity (b), heat deposition rate (c), and temperature after a 7-s exposure (d) are presented on the HIFU axis (top row) and across the axis in the focal plane z=44 mm (bottom row). The −6-dB pressure beam width and length calculated linearly were 1 mm and 6 mm. Nonlinear effects result in reduction in the focal dimensions for the peak positive pressure (0.5 mm and 4 mm) and enlargement of the dimensions for the peak negative pressure (1.2 mm and 8 mm). The maximum value of the peak positive pressure doubled, and the peak negative pressure dropped 30% from the linear to the nonlinear waveform. The in situ spatial peak intensity I=5670 W∕cm2, Eq. 4, is slightly higher than the linearly calculated, Eq. 6, intensity IL=4830 W∕cm2. The heat deposition rate at the focus is twice that calculated linearly. However, since the heating is over a long time (in seconds) and the extra nonlinear heating is so localized in space, diffusion smoothes the temperature distributions over time, and the final peak temperatures differ much less between the linear and nonlinear simulations than do the peak heating rates. Nonlinear simulations indicate a peak temperature of 99 °C, which we will refer to hereafter as 100 °C because it is so close, while linear simulations yield 86 °C after 7 s of exposure. Dashed vertical lines in Figs. 4c, 4d show the slice thickness, 2 mm, of the MR voxel. The other voxel dimension in the focal plane is 0.5 mm, and the voxel length in the axial direction is 0.3 mm. The dimensions of the voxel are comparable to those of the heated region. In particular, the 2-mm thickness of the voxel is larger than the half maximum beam width of both the heat sources and even the radial temperature rise profile. Spatial averaging over one voxel can, therefore, be of importance in MR temperature measurements.
Figure 4.
Simulation results for acoustic and temperature fields in the phantom obtained assuming nonlinear (solid) and linear (dashed) acoustic propagations. Spatial distributions of the peak positive and peak negative pressures, intensity, heat deposition rate, and temperature after 7 s of HIFU exposure are presented axially (upper row) and in the focal plane radially (lower row). Dashed vertical lines on the heat deposition and temperature plots indicate the width of the voxel.
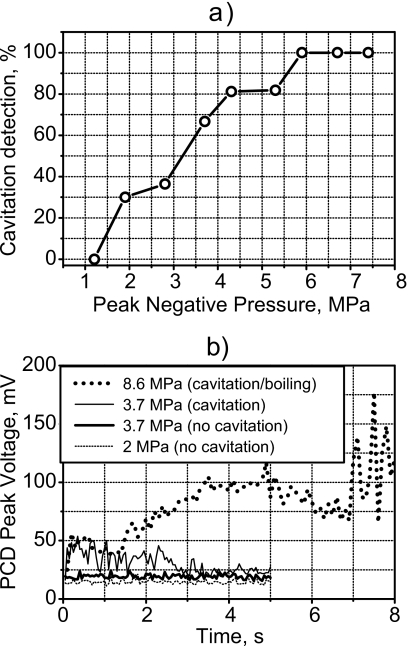
At the acoustic exposure levels used in the MR experiments (Fig. 4), cavitation was observed immediately (within a few acoustic cycles) in the phantom with a 20-MHz passive cavitation detector (PCD); in other words, cavitation was present throughout all of the MRI experiments. Figure 5a shows the measured threshold curve for cavitation in the phantom for 5-s exposures. For in situ peak negative pressures larger than 5 MPa, cavitation was measured immediately in all samples. As shown above, the peak negative pressure at the focus in this study was 8.6 MPa (Figs. 34) and was, therefore, above the cavitation threshold of the tissue phantom. In an effort to simplify the display of the cavitation signals in Fig. 5b, time-domain traces measured by the PCD were broken into 100-μs segments, and the peak value of each segment is shown. The background noise level was 20 mV. At an output of 2-MPa peak negative pressure, the signal was only slightly above the noise level of the detection system and was, therefore, interpreted as not having cavitation activity present. Separate exposures at a peak negative pressure of 3.7 MPa created two distinct curves. The lower one was only slightly higher than the curve for the 2-MPa negative pressure exposure, and again the interpretation was that no cavitation occurred. Increasing the applied pressure had little effect on the amplitude of the detected signal without cavitation. However, when cavitation was present as in the upper curve for the 3.7-MPa negative pressure exposure, the signal level from time zero is significantly elevated. Exposure to the conditions described in Fig. 4 and used in the MR experiments here produced the upper curve labeled 8.6 MPa. An elevated signal due to cavitation is seen immediately at 0 s after HIFU was turned on. The signal is significantly increased when boiling starts at 7 s and is, therefore, distinguishable from the cavitation signal.
Figure 5.
(a) Percent of times in seven 5-s exposures that cavitation was detected versus peak negative pressure of the HIFU exposure. Cavitation was detected with a 20-MHz PCD high-pass filtered at 15 MHz. Peak negative pressures larger than 8 MPa were used in this work; therefore, cavitation was present in all experiments. (b) Peak-detected representation of time-domain trace recorded by the PCD for three HIFU exposure levels. At the lowest exposure (2-MPa negative pressure), the signal was at the noise level, which was 20 mV. An increase to 3.7-MPa negative pressure caused little change in one case and significant increase in signal amplitude in the other. The large increase in signal was attributed to broadband emissions from cavitation. Under the exposure used in the MR experiments (8.6-MPa negative pressure), the elevated signal due to cavitation was observed immediately after HIFU was turned on, and the signal further increased at 7 s when boiling occurred.
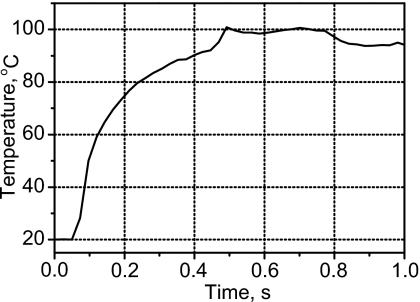
The results of temperature measurements with a thermocouple at the focus under the HIFU exposure conditions stated above are shown in Fig. 6. At the instant a boiling bubble appeared, 100 °C was recorded. However, clearly the measurement tool, the thermocouple, affected the measurement: boiling occurred on the thermocouple, and boiling occurred in 7 s without the thermocouple present and in 0.5 s with the thermocouple. Thermocouples are known to create additional heating, near the thermocouple surface, from the viscous damping of the ultrasound-induced motion of the tissue phantom relative to the thermocouple.39, 40 This heating can be reduced by placing the thermocouple at a pressure null instead of at the focus; however, it is evident from Fig. 4d that in this case the peak temperature could not be revealed since the linear and nonlinear simulations show the same temperature at the null but significantly different peak temperatures. Viscous heating of the thermocouple is likely responsible for the accelerated heating measured at the focus in the presence of the thermocouple (Fig. 6); nevertheless, when boiling inception was observed by high-speed camera, which visually appeared similar with and without the thermocouple present, the temperature was 100 °C.
Figure 6.
Temperature measured by a thermocouple at the focus. At the point boiling was visually observed in simultaneous high-speed camera images, 100 °C was measured, and the temperature rise suddenly plateaued. However, the presence of the thermocouple accelerated heating, and therefore, boiling occurred at 0.5 s with the thermocouple present compared to 7 s without it.
MRI measurements of HIFU heating in tissue phantom
The following data were all collected in the MRI system from a single exposure of a single sample. The results were repeated in five other samples. The standard deviation in the time to boil between different samples was 0.2 s and was attributed to differences in the sample length, initial temperature, and gas content, as well as variations in the distribution of bubble nuclei.
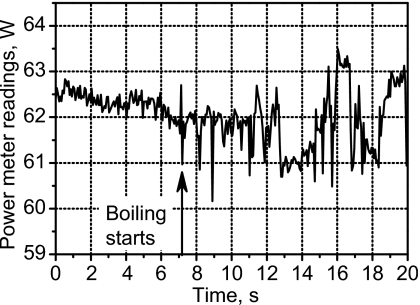
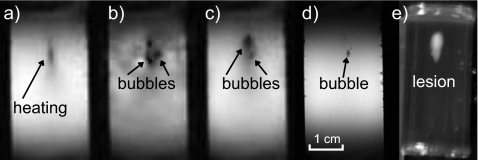
Power fluctuation was detected by the power meter, suggesting the presence of boiling, after 7.1 s of HIFU heating (Fig. 7). The power fluctuation continued to the end of HIFU exposure. Evidence of boiling was also observed in the amplitude MR images beginning from 7 s (Fig. 8). During HIFU exposure, before boiling [Fig. 8a], a dark region was seen at the transducer focus. We speculate that this dark region was due to heating, which shifted the resonance frequency away from the bandwidth of the rf excitation pulses and altered the T1 and T2 relaxation times. The first image frame obtained within the time interval of 6.5–7.8 s, following the observed fluctuation in the power meter, contains what looks like bubbles. There is at least one mm-sized, circular, dark region in the image. The dark region indicates a loss of MR signal and would be expected if air or water vapor were present. There is also white and dark mottled “ghosting” around the circular cores. This motion artifact would be expected if the bubbles were oscillating and displacing nearby protons. Figure 8c, taken 14.3 s after the start of HIFU exposure, shows a dark region of heated tissue containing a bubble. The motion artifact is not seen in this image, possibly because bubble collapses may become less violent over time. For several minutes following treatment, the slowly dissolving bubble or bubbles persisted in the gel sample and were visible to the naked eye and in the MR images. We believe that the reason for bubble persistence is that the samples were incompletely degassed and outgassing into the initially vapor-filled bubbles took place. Figure 8d shows a high-resolution image taken 2 min after HIFU exposure when the sample had cooled. Evidence of a bubble is seen within a few voxels of the hottest voxel in the sound field.
Figure 7.
Indication of boiling after 7-s exposure by fluctuation of the electrical power delivered to the transducer in the MRI experiment.
Figure 8.
MR magnitude images of the tissue-mimicking phantom during and after HIFU exposure. The transducer was located above the top of the images, and the sample was exposed for 20 s. (a) The image taken 5.2 s after the start of the exposure shows evidence of heating in the focal region, but boiling had not yet occurred. No evidence of cavitation is observed in the image. (b) After 7.8 s, the image shows large boiling bubbles surrounded by motion artifact. (c) After 14.3 s, motion artifacts are less evident as bubble motion may have become less violent. (d) Even 2 minutes after HIFU exposure, a high-resolution image shows the residual bubble at the HIFU focus. The bubble position corresponded to the distal end of the region of thermally denatured protein (the lesion) photographed in (e). The lesion had grown and enlarged in the direction of the transducer as has been reported to be caused by the presence of boiling (Ref. 15).
The lesion—the region of thermally denatured protein—is not observed in the MR images in Figs. 8a, 8b, 8c, 8d, which is typical with the non-contrast gradient-echo sequence magnitude imaging method employed here.5 But the final lesion shape, shown in the photograph in Fig. 8e, indicates that boiling occurred. The lesion continued to be exposed to HIFU for 13 s following the start of boiling, and therefore the lesion grew toward the transducer and broadened on its proximal side arguably because of backscattering from the boiling bubble.15
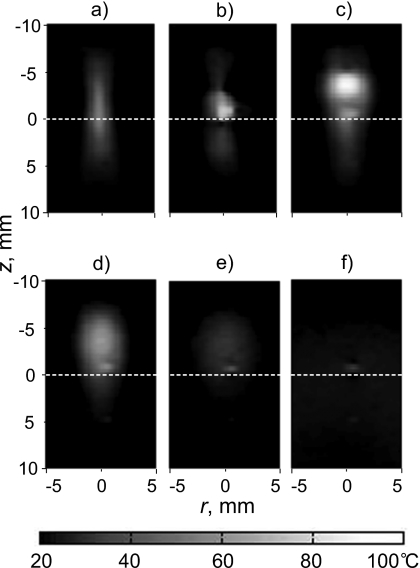
The MRI temperature map in Fig. 9 shows the heated region migrating and broadening in the direction of the transducer. Figure 9a shows the MR temperature map acquired just before boiling started. The heated region was nearly symmetric about the focus. However, after boiling started, the hot spot migrated and broadened in the direction of the transducer, as seen in Figs. 9b, 9c. Following treatment, the region cooled [Figs. 9d, 9e, 9f], and all that remained was evidence of the bubble (that could also be seen in Fig. 8) at the focus. This bubble appears as a region of slightly elevated temperature on the MR temperature map; however, it had undoubtedly cooled to the ambient temperature. The phase difference that appeared as elevated temperature was likely due to the difference in magnetic susceptibilities of the gel and the gas in the bubble.37 Both this susceptibility artifact and the motion artifact discussed above mean that MR temperature measurements contain errors once bubbles form and these errors persist as long as the bubbles last.
Figure 9.
Two-dimensional temperature distributions measured by MR thermometry: (a) 6.4 s, (b) 7.7 s, and (c) 12.8 s after HIFU was turned on and (d) 3.4 s, (e) 20.3 s, and (f) 40 s after HIFU was turned off. Before boiling (a), the region grew nearly symmetrically about the focus. No temperature field distortion was observed even though cavitation was present. After boiling occurred at 7.1 s, the heated region migrated upward toward the HIFU source and broadened.
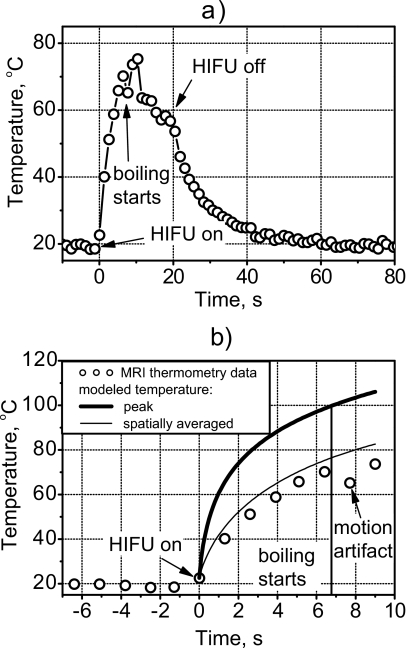
Boiling started at 7.1 s of exposure as was indicated by fluctuation in the power to the source and the appearance of what look like bubbles in the MR magnitude image; however, immediately before boiling the MR-measured temperature did not reach 100 °C. Figure 10a depicts the temperature versus time of the voxel that corresponded to the focus of the transducer. This voxel had the highest temperature in the field at each time point before boiling. Time t=0 corresponded to the beginning of the HIFU exposure. For the first 6.5 s, the temperature rose smoothly to 73 °C, which was repeated to within 5 °C in the replicate samples. At 7 s, the bubble appeared in the location of this voxel, and the temperature readings became erratic. The erratic fluctuation was greatest during HIFU exposure when bubble-induced motion artifacts were present. Some of the temperature fluctuation may also have been due to the moving bubbles deflecting the ultrasound and causing local cooling and heating.17, 41 This part of the time-temperature curve varied from sample to sample in a random manner. After 20 s, the voxel began to cool and returned to ambient temperature in about the time expected from calculations. Note that there was no residual artificial elevation in temperature reading for this particular voxel. Although the initial bubble did form in the voxel of interest, its violent and rapid growth moved the bubble off the voxel. In other data sets, the bubble remained in the voxel of interest, and the temperature readings returned to about 10 °C above ambient because of the magnetic susceptibility difference between gas and gel.
Figure 10.
MR-measured temperature at the focus of the transducer over the course of the treatment (a) and comparison of measurement and calculation in the pre-boiling part of the curve (b). MRI generally tracked the heating during and the cooling following HIFU. However, because of the presence of boiling bubbles during HIFU exposure from 7 to 20 s, temperature readings were erratic. Immediately before boiling (7 s), the calculated peak temperature was 100 °C. The temperature measured with MRI in the focal voxel and the calculated temperature averaged over the voxel volume was only 73 °C.
Comparison of MRI measurements and modeling
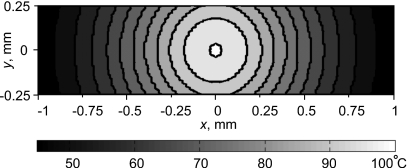
Unlike the measured temperature of the voxel, the calculated peak temperature did reach 100 °C at 7 s. The thick line in Fig. 10b shows the calculated temperature rise using the approach outlined in Sec. 2. The circles are the MR-measured data points from Fig. 10a. However, the temperature field was calculated on a fine grid, and it was necessary to account for the spatial averaging taking place over the finite volume of the MRI voxel (Fig. 4). Figure 11 shows the calculated focal temperature field at 7 s within the voxel cross-section transverse to the acoustic axis. The calculated temperature field was converted to phase using the calibration curve. Then, all phase values within the volume of a voxel were averaged. Finally, the average value was converted back to temperature and indicated the value recorded from the voxel by the MR system. In this manner, the thin line in Fig. 10b was obtained, and agreement with measurement is excellent. Indeed, since the spatial temperature distribution close to the focus is very narrow, after averaging it over the size of one voxel the temperature becomes 27 °C lower.
Figure 11.
Temperature distribution after 7-s exposure calculated within a single voxel in the plane perpendicular to the acoustic axis at the spatial peak of temperature. The measured MRI temperature was the temperature averaged over the voxel volume and not the peak temperature.
Thus, when spatial averaging was taken into account, the measured maximum of 73 °C corresponded directly to the calculated 100 °C peak temperature. The measured data are shifted slightly to the right of the calculated line, but it is accurate to add a 1.3-s long error bar to the left of the measurement, corresponding to the MR image acquisition time.
DISCUSSION AND CONCLUSIONS
In this paper, MR was used as an imaging technique to observe HIFU-induced boiling in a tissue phantom and simultaneously to monitor the temperature as boiling was approached. Standard techniques for MR thermometry were used, but the experiment was designed such that the MR temporal and spatial resolution was better than likely to be achieved clinically. The MR measurements were performed under well-controlled experimental conditions. Homogeneous phantoms with repeatable acoustic and thermal properties were used, the pressure and temperature fields produced by the HIFU source were characterized, the cavitation threshold in the phantom was measured, and MRI temperature measurements were calibrated prior to the experiment. In other words, the timing and appearance of boiling and of cavitation were well established in advance of testing MR magnitude imaging and thermometry.
Boiling was detected in the MR magnitude images after 7 s of HIFU exposure as circular dark regions surrounded by mottled ghosting indicative of a motion artifact. MRI-detected initiation of boiling correlated with simultaneous observation of fluctuation in the power to the HIFU transducer due to reflections from the bubble and a temperature of 100 °C in numerical simulations. The dark regions in the MR images were about the size of visually observed boiling bubbles (∼1-mm diameter), and the motion artifact was thought to be due to bubble motion in the HIFU field. The artifact went away when HIFU exposure was ceased, but a dark spot indicating the presence of the bubble remained.
Although cavitation was present from the beginning of HIFU exposure, cavitation, unlike boiling, was not readily observable in either the power meter reading or the MR magnitude image. The MR image showed darkening in the focal region that grew with time prior to the bubble appearance, but this effect was consistent with the formation of a growing heated region shifting the resonance in the region from the imaging frequency and not with cavitation that is arguably more diffuse and sporadic and less likely to grow symmetrically over time. We speculate that cavitation activity was not observed in the MR imaging because the micrometer-sized cavitation bubbles were much smaller than the millimeter-sized boiling bubbles. In addition, there was no evidence that the cavitation caused additional heating in the samples. Cavitation was present in experiments but not included in the model, yet calculations showed 100 °C at the precise time when boiling bubbles were observed by camera and by artifacts in the MR images. Note that by 100 °C we mean that the temperature was within a few degrees of 100 °C. Boiling may occur at 100 °C or within a few degrees of superheat because of stochastic delays in obtaining a nucleus.31 In our experiments, the time to boil varied ∼4% from sample to sample. In addition, the physical properties of the phantom used in simulations are also known to about this resolution. Thermocouple measurements showed a temperature of 100 °C when boiling started.
Although several independent measures detected either boiling or 100 °C at the same time, the MRI thermometry measurements showed only 73 °C when boiling occurred. If a MR phase versus temperature curve had not been measured and a common linear relationship used instead (Fig. 2), temperatures determined by MR thermometry would have been even lower. MRI alone, therefore, underestimated the peak temperature. However, the results of MR thermometry agree very well with simulations when the modeled temperature distribution was averaged over the volume of the MRI voxel. Spatial averaging was, therefore, shown to be an important factor in this MRI experiment, even though the size of the voxel was much smaller than the voxel size used in clinical MRI systems.1 Conversely, the transducer, the frequency, focal dimensions, and heating volumes fall within the ranges reported for HIFU clinical work.12 If only MR thermometry were employed, it would be easy to misinterpret boiling as cavitation because the MRI showed a temperature significantly lower than 100 °C. The temperatures measured by MRI before boiling occurred were underestimated by about 30% due to spatial averaging, which implies that MR thermometry would not have yielded reliable estimations of the thermal dose. Higher frequency, longer focal lengths, and higher amplitudes would shrink the focal width and exacerbate the problem, whereas slower heating allows more time for heat diffusion and tissue motion, which creates other problems, to broaden the heated region.
A deeper look at the spatial and temporal resolutions, particularly, the relation between MR image acquisition time and temperature increase rate, reveals further challenges. We acquired 64 lines of k-space at a rate of one line every 20 ms. During the 1.3-s acquisition period the temperature—and therefore the resonant frequency—in some voxels changed substantially, by as much as 20 °C at the focal point. We then used a Fourier transform, which assumes stable resonant frequencies throughout the k-space acquisition, to convert to image space and determine the resonant frequency shift in each image voxel.42, 43 Although it is potentially flawed, this same general approach is typically implemented to monitor HIFU procedures using state of the art clinical MR systems. While modern clinical magnets, using parallel imaging techniques combined with rapid acquisition schemes, could provide better temporal resolution than we achieved, it would be very challenging to acquire images of human anatomy with sub-millimeter spatial resolution and acquisition times short enough to adequately reduce resonant frequency changes as k-space is filled.
It is important to distinguish boiling from cavitation in clinical research, as detection of boiling could be a useful surrogate for a temperature measurement. Its appearance indicates that the temperature has risen close to 100 °C. Anand and Kaczkowski22 and Khokhlova et al.44 proposed to use the measured time to boil, combined with calculations, to obtain in situ pressures and in situ heat rates, which enable these authors to control more precisely clinical HIFU exposure. Further, it is also important to know when boiling occurs or preferably when it will occur because once boiling begins, the treatment is dramatically and irreversibly changed as evidenced by the distortion of the lesion shown in Fig. 8. Undetected boiling will result in lesions that are larger in size and possibly in the wrong location. The clinical significance of this work is that MRI-based temperature measurement alone may be insufficient to monitor and control therapy when treatment temperatures reach 100 °C.
Another point of clinical concern is that boiling can occur in HIFU much more quickly than might be expected. The relationship between focal heating and either focal pressure or drive power is highly nonlinear, especially when output levels are sufficient to cause shock waves. The HIFU heating rate used in our experiments was relatively slow in order to accommodate the long MR image acquisition time. The transducer was excited by 63 W of electrical power, which resulted in a focal pressure waveform that was distorted but not yet shocked, and boiling occurred in 7 s. However, if the power is increased, the heating rate increases significantly. In our previous experiments, an identical transducer (2.158-MHz, 42-mm aperture and 44.4-mm radius of curvature) was driven up to 300 W, shock waves formed at the focus, and boiling was obtained in under 3 ms in a similar tissue phantom.16 This time is much shorter than the 1.3-s MR slice acquisition time used in the current study.
These results—HIFU initiation of boiling is unlikely to register 100 °C on MR thermometry and high power can result in millisecond boiling—lead us to a new interpretation of the paper by Sokka et al.,10 which is often cited as thein vivo evidence for cavitation-enhanced heating by HIFU. Except for the HIFU power, the study reported here was very similar to the one reported by Sokka et al. MRI acquisition time in that work was 4.4 s, and the voxel size was 0.8×1.2×3 mm3—larger than in our case. In addition, the authors averaged nine voxels to obtain one temperature reading, which further reduced the spatial resolution. The HIFU source was larger but more focused than the one used in our work (aperture 10 cm and radius of curvature 8 cm), with about the same frequency, 1.7 MHz. The tissue path was 1–2 cm as was ours in phantom. Sokka et al. compared two exposures that each had the same total energy delivered to the source: the first was a continuous excitation with electrical power of 28 W for 20 s, and the second contained a 300-W, 0.5-s long burst followed by continuous excitation with electrical power of 21 W for 19.5 s. The authors found that the MR-measured temperature was higher for the second type of treatment, particularly because of greater temperature rise during the initial high-amplitude burst, and the resulting lesions were larger and had migrated toward the source. Bubble activity was detected only in the exposure that included the initial high-amplitude pulse and was attributed to cavitation, not boiling, presumably on the argument that 100 °C was not measured by MRI. The conclusions were, “…cavitation can be reliably used to create significantly larger lesions (three times larger lesions than with conventional focused ultrasound) in vivo.” In light of our results, an alternative interpretation can be proposed. Heating from the incident HIFU waves, which were arguably shocked or at least significantly distorted, accounted for the enhanced temperature rise during the first 0.5 s of exposure, and the detected bubble activity was boiling, not cavitation. A temperature of 100 °C was not detected just before boiling started because the heated region was smaller than the volume of the MR voxels averaged to measure temperature. Furthermore, after boiling started within 0.5 s of the high-amplitude burst exposure, the presence of bubbles distorted MR temperature readings. By this interpretation, the paper of Sokka et al. provides evidence of nonlinearly enhanced or shock-wave-enhanced heating and boiling in vivo, not cavitation-enhanced heating in vivo. Since MR-based temperature measurements are currently used to calculate ablation volumes in MR-guided HIFU systems, it is important that the respective roles of cavitation and boiling be more clearly understood.
ACKNOWLEDGMENTS
We thank our collaborators at the Center for Industrial and Medical Ultrasound specifically Mr. Aaron Midkiff (Department of Electrical Engineering, University of Washington UW) and Mr. Fran Olson (Applied Physics Laboratory, UW) for design of the experimental apparatus. We also thank the reviewers for questions that helped us improve this manuscript. We gratefully acknowledge funding support from NSBRI Grant No. SMS00402∕SMST01601, and NIH Grant Nos. DK43881, EB005250, and EB643.
References
- Jolesz F. A., Hynynen K., McDannold N., and Tempany C., “MR imaging-controlled focused ultrasound ablation: A noninvasive image-guided surgery,” Magn. Reson. Imaging Clin. N. Am. 13, 545–560 (2005). [DOI] [PubMed] [Google Scholar]
- Wu F., Wang Z. B., Chen W. Z., Wang W., Gui Y., Zhang M., Zheng G., Zhou Y., Xu G., Li M., Zhang C., Ye H., and Feng R., “Extracorporeal high intensity focused ultrasound ablation in the treatment of 1038 patients with solid carcinomas in China: An overview,” Ultrason. Sonochem. 10.1016/j.ultsonch.2004.01.011 11, 149–154 (2004). [DOI] [PubMed] [Google Scholar]
- Illing R. O., Kennedy J. E., Wu F., ter Haar G. R., Protheroe A. S., Friend P. J., Gleeson F. V., Cranston D. W., Phillips R. R., and Middleton M. R., “The safety and feasibility of extracorporeal high-intensity focused ultrasound (HIFU) for the treatment of liver and kidney tumours in a Western population,” Br. J. Cancer 10.1038/sj.bjc.6602803 93, 890–895 (2005). [DOI] [PMC free article] [PubMed] [Google Scholar]
- Chaussy C. and Thuroff S., “High-intensity focused ultrasound in prostate cancer: Results after 3 years,” Mol. Urol. 4, 179–182 (2000). [PubMed] [Google Scholar]
- McDannold N., “Quantitative MRI-based temperature mapping based on the proton resonant frequency shift: Review of validation studies,” Int. J. Hyperthermia 10.1080/02656730500096073 21, 533–546 (2005). [DOI] [PubMed] [Google Scholar]
- Sapareto S. and Dewey W., “Thermal dose determination in cancer therapy,” Int. J. Radiat. Oncol., Biol., Phys. 10, 787–800 (1984). [DOI] [PubMed] [Google Scholar]
- Gorny K. R., Hangiandreou N. J., Hesley G. K., Gostout B. S., McGee K. P., and Felmlee J. P., “MR guided focused ultrasound: Technical acceptance measures for a clinical system,” Phys. Med. Biol. 10.1088/0031-9155/51/12/011 51, 3155–3173 (2006). [DOI] [PubMed] [Google Scholar]
- Jolesz F. A. and McDannold N., “Current status and future potential of MRI-guided focused ultrasound surgery,” J. Magn. Reson. Imaging 27, 391–399 (2008). [DOI] [PubMed] [Google Scholar]
- Holt R. G. and Roy R. A., “Measurements of bubble-enhanced heating from focused, MHz-frequency ultrasound in a tissue-mimicking material,” Ultrasound Med. Biol. 10.1016/S0301-5629(01)00438-0 27, 1399–1412 (2001). [DOI] [PubMed] [Google Scholar]
- Sokka S. D., King R., and Hynynen K., “MRI-guided gas bubble enhanced ultrasound heating in in vivo rabbit thigh,” Phys. Med. Biol. 10.1088/0031-9155/48/2/306 48, 223–241 (2003). [DOI] [PubMed] [Google Scholar]
- Melodelima D., Chapelon J. Y., Theillère Y., and Cathignol D., “Combination of thermal and cavitation effects to generate deep lesions with an endocavitary applicator using a plane transducer: Ex vivo studies,” Ultrasound Med. Biol. 10.1016/j.ultrasmedbio.2003.09.005 30, 103–111 (2004). [DOI] [PubMed] [Google Scholar]
- Bailey M. R., Khokhlova V. A., Sapozhnikov O. A., Kargl S. G., and Crum L. A., “Physical mechanisms of the therapeutic effect of ultrasound,” Acoust. Phys. 10.1134/1.1591291 49, 369–388 (2003). [DOI] [Google Scholar]
- Hynynen K., “Demonstration of enhanced temperature elevation due to nonlinear propagation of focussed ultrasound in dog’s thigh in vivo,” Ultrasound Med. Biol. 10.1016/0301-5629(87)90078-0 13, 85–91 (1987). [DOI] [PubMed] [Google Scholar]
- Dalecki D., Carstensen E. L., and Parker K. J., “Absorption. of finite amplitude focused ultrasound,” J. Acoust. Soc. Am. 10.1121/1.400976 89, 2435–2447 (1991). [DOI] [PubMed] [Google Scholar]
- Khokhlova V. A., Bailey M. R., Reed J. A., Cunitz B. W., Kaczkowski P. J., and Crum L. A., “The relative role of nonlinear ultrasound propagation and cavitation in acceleration of HIFU therapy,” J. Acoust. Soc. Am. 10.1121/1.2161440 119, 1834–1848 (2006). [DOI] [PubMed] [Google Scholar]
- Canney M. S., Bailey M. R., Khokhlova V. A., and Crum L. A., “Millisecond initiation of boiling by high-intensity focused ultrasound in tissue-mimicking phantoms,” J. Acoust. Soc. Am. 120, 3110 (2006). [Google Scholar]
- Coussios C. C. and Roy R. A., “Applications of acoustics and cavitation to noninvasive therapy and drug delivery,” Annu. Rev. Fluid Mech. 10.1146/annurev.fluid.40.111406.102116 40, 395–420 (2008). [DOI] [Google Scholar]
- Takegami K., Kaneko Y., Watanabe T., Watanabe S., Maruyama T., Matsumoto Y., and Nagawa H., “Heating and coagulation volume obtained with high-intensity focused ultrasound therapy: Comparison of perflutren protein-type A microspheres and MRX-133 in rabbits,” Radiology 237, 132–136 (2005). [DOI] [PubMed] [Google Scholar]
- Thomas C., Farny C., Coussios C., Roy R., and Holt R., “Dynamics and control of cavitation during high-intensity focused ultrasound application,” ARLO 10.1121/1.1901744 6, 182–187 (2005). [DOI] [Google Scholar]
- Crum L. A. and Fowlkes J. B., “Acoustic cavitation generated by microsecond pulses of ultrasound,” Nature (London) 10.1038/319052a0 319, 52–54 (1986). [DOI] [Google Scholar]
- Mast T. D., Salgaonkar V. A., Karunakaran C., Besse J. A., Datta S., and Holland C. K., “Acoustic emissions during 3.1 MHz ultrasound ablation in vitro,” Ultrasound Med. Biol. 34, 1434–1448 (2008). [DOI] [PMC free article] [PubMed] [Google Scholar]
- Anand A. and Kaczkowski P. J., “Monitoring formation of high intensity focused ultrasound (HIFU) induced lesions using backscattered ultrasound,” ARLO 10.1121/1.1652131 5, 88–94 (2004). [DOI] [Google Scholar]
- Watkin N. A., Rivens I. H., and ter Haar G. R., “The intensity dependence of the site of maximal energy deposition in focused ultrasound surgery,” Ultrasound Med. Biol. 10.1016/0301-5629(95)02062-4 22, 483–491 (1996). [DOI] [PubMed] [Google Scholar]
- Bailey M. R., Couret L. N., Sapozhnikov O. A., Khokhlova V. A., ter Haar G., Vaezy S., Shi X., Martin R., and Crum L. A., “Use of overpressure to assess the role of bubbles in focused ultrasound lesion shape in vitro,” Ultrasound Med. Biol. 27, 696–708 (2000). [DOI] [PubMed] [Google Scholar]
- Vaezy S., Shi X., Martin R. W., Chi E., Nelson P. I., Bailey M. R., and Crum L. A., “Real-time visualization of focused ultrasound therapy,” Ultrasound Med. Biol. 10.1016/S0301-5629(00)00279-9 27, 33–42 (2001). [DOI] [PubMed] [Google Scholar]
- Xu Z., Fowlkes J. B., Rothman E. D., Levin A. M., and Cain C. A., “Controlled ultrasound tissue erosion: The role of dynamic interaction between insonation and microbubble activity,” J. Acoust. Soc. Am. 10.1121/1.1828551 117, 424–435 (2005). [DOI] [PMC free article] [PubMed] [Google Scholar]
- Lele P. P., “Effects of ultrasound on “solid” mammalian tissues and tumors in vivo,” Ultrasound: Medical Applications, Biological Effects and Hazard Potential (Plenum, New York, 1986), pp. 275–306. [Google Scholar]
- Canney M. S., Khokhlova V. A., Bailey M. R., Sapozhnikov O. A., and Crum L. A., “Acoustic characterization of high intensity focused ultrasound (HIFU) fields: A measurement and modeling approach,” J. Acoust. Soc. Am. 10.1121/1.2967836 124, 2406–2420 (2008). [DOI] [PMC free article] [PubMed] [Google Scholar]
- Lafon C., Zderic V., Noble M. L., Yuen J. C., Kaczkowski P. J., Sapozhnikov O. A., Chavrier F., Crum L. A., and Vaezy S., “Gel phantom for use in high-intensity focused ultrasound dosimetry,” Ultrasound Med. Biol. 10.1016/j.ultrasmedbio.2005.06.004 31, 1383–1389 (2005). [DOI] [PubMed] [Google Scholar]
- Crum L. A. and Law W., “The relative roles of thermal and nonthermal effects in the use of high intensity focused ultrasound for the treatment of benign prostatic hyperplasia,” Proceedings of the 15th International Congress on Acoustics, Trondheim, Norway, 1995.
- Canney M. S., Bailey M. R., Khokhlova V. A., Kreider W., and Crum L. A., “Observations of cavitation and boiling in a tissue phantom due to high intensity focused ultrasound,” J. Acoust. Soc. Am. 122, 3079 (2007). [Google Scholar]
- Marro K., Lee D., Khokhlova T., and Bailey M., “Nonlinear frequency shifts during HIFU-induced boiling at 4.7 T,” The 48th Experimental NMR Conference, Daytona Beach, FL, April 23–27, 2007.
- Ishihara Y., Calderon A., Watanabe H., Okamoto K., Suzuki Y., Kuroda K., and Suzuki Y., “A precise and fast temperature mapping using water proton chemical shift,” Magn. Reson. Med. 10.1002/mrm.1910340606 34, 814–823 (1995). [DOI] [PubMed] [Google Scholar]
- Wu T., Kendell K. R., Felmlee J. P., Lewis B. D., and Ehman R. L., “Reliability of water proton chemical shift temperature calibration for focused ultrasound ablation therapy,” Med. Phys. 10.1118/1.598864 27, 221–224 (2000). [DOI] [PubMed] [Google Scholar]
- Philo J. S. and Fairbank W. M., “Temperature dependence of the diamagnetism of water,” J. Chem. Phys. 10.1063/1.439734 72, 4429–4433 (1980). [DOI] [Google Scholar]
- Day E. P., “Equation for the magnetic susceptibility of water,” J. Chem. Phys. 10.1063/1.439735 72, 4434–4436 (1980). [DOI] [Google Scholar]
- Hindman J. C., “Proton resonance shift of water in the gas and liquid states,” J. Chem. Phys. 10.1063/1.1726676 44, 4582–4592 (1966). [DOI] [Google Scholar]
- Cini R. and Torrini M., “Temperature dependence of the magnetic susceptibility of water,” J. Chem. Phys. 10.1063/1.1670491 49, 2826–2830 (1968). [DOI] [Google Scholar]
- Fry W. J. and Fry R. B., “Determination of absolute sound levels and acoustic absorption coefficients by thermocouple probes—Theory,” J. Acoust. Soc. Am. 10.1121/1.1907332 26, 294–310 (1954). [DOI] [Google Scholar]
- Clarke R. L. and ter Haar G. R., “Temperature rise recorded during lesion formation by high intensity focused ultrasound,” Ultrasound Med. Biol. 10.1016/S0301-5629(96)00198-6 23, 299–306 (1997). [DOI] [PubMed] [Google Scholar]
- Coussios C. C., Farny C. H., ter Haar G. R., and Roy R. A., “Role of acoustic cavitation in the delivery and monitoring of cancer treatment by high-intensity focused ultrasound (HIFU),” Int. J. Hyperthermia 10.1080/02656730701194131 23, 105–20 (2007). [DOI] [PubMed] [Google Scholar]
- T., Callaghan, Principles of Nuclear Magnetic Resonance Microscopy (Clarendon, Oxford, 1991). [Google Scholar]
- Liang Z. -P. and Lauterbur P. C., Principles of Magnetic Resonance Imaging: A Signal Processing Perspective, IEEE Press Series in Biomedical Engineering (IEEE, New York, 2000). [Google Scholar]
- Khokhlova V. A., Bailey M. R., Reed J., Canney M. S., Kaczkowski P. J., and Crum L. A., “Nonlinear mechanisms of lesion formation by high intensity focused ultrasound,” AIP Conf. Proc. 10.1063/1.2205449 829, 117–121 (2006). [DOI] [Google Scholar]


