Abstract
The larger coverage afforded by wider z-axis beams in multidetector CT (MDCT) creates larger cone angles and greater beam divergence, which results in substantial surface dose variation for helical and contiguous axial scans. This study evaluates the variation of absorbed radiation dose in both cylindrical and anthropomorphic phantoms when performing helical or contiguous axial scans. The approach used here was to perform Monte Carlo simulations of a 64 slice MDCT. Simulations were performed with different radiation profiles (simulated beam widths) for a given collimation setting (nominal beam width) and for different pitch values and tube start angles. The magnitude of variation at the surface was evaluated under four different conditions: (a) a homogeneous CTDI phantom with different combinations of pitch and simulated beam widths, (b) a heterogeneous anthropomorphic phantom with one measured beam collimation and various pitch values, (c) a homogeneous CTDI phantom with fixed beam collimation and pitch, but with different tube start angles, and (d) pitch values that should minimize variations of surface dose—evaluated for both homogeneous and heterogeneous phantoms. For the CTDI phantom simulations, peripheral dose patterns showed variation with percent ripple as high as 65% when pitch is 1.5 and simulated beam width is equal to the nominal collimation. For the anterior surface dose on an anthropomorphic phantom, the percent ripple was as high as 40% when the pitch is 1.5 and simulated beam width is equal to the measured beam width. Low pitch values were shown to cause beam overlaps which created new peaks. Different x-ray tube start angles create shifts of the peripheral dose profiles. The start angle simulations showed that for a given table position, the surface dose could vary dramatically with minimum values that were 40% of the peak when all conditions are held constant except for the start angle. The last group of simulations showed that an “ideal” pitch value can be determined which reduces surface dose variations, but this pitch value must take into account the measured beam width. These results reveal the complexity of estimating surface dose and demonstrate a range of dose variability at surface positions for both homogeneous cylindrical and heterogeneous anthropomorphic phantoms. These findings have potential implications for small-sized dosimeter measurements in phantoms, such as with TLDs or small Farmer chambers.
Keywords: CT, radiation dose
INTRODUCTION
Estimating patient dose, and especially organ dose from multidetector CT (MDCT), continues to be of interest to the imaging community due to the continued growth in CT utilization. Currently, the standard method of measuring CT radiation output, the CT dose index (CTDI), requires the use of a standardized homogeneous cylindrical phantom, known as a CTDI phantom, a 100 mm long pencil ionization chamber, and a single axial scan to obtain values used to compute CTDI100, CTDIw, and several other dose descriptors.1, 2, 3, 4, 5 To account for parameters that are related to a specific imaging protocol, especially for helical acquisitions, CTDIvol was introduced.6
Due to the larger beam collimations of MDCT systems and cone-beam CT systems, revisions of this methodology have been suggested and are under consideration for wider adoption by the medical physics community. For example, Dixon and co-worker7, 8 investigated the limitations of CTDI100 in MDCT and proposed a new method to perform calculations to estimate typical clinical CT doses, as opposed to CT scanner radiation output, with the use of a small volume detector and a helical scan.
Small detectors have also been used with anthropomorphic phantoms to obtain measurements that provide estimates of radiation dose to specific organs. Hurwitz et al.9 estimated radiation dose to the female breast from 16-slice MDCT helical examinations using metal-oxide-semiconductor field-effect transistors (MOSFETs) in an anthropomorphic phantom. In separate efforts, Hurwitz et al.10 and Jaffe et al.11 developed methods to determine fetal radiation doses resulting from 16-slice MDCT using direct measurements of radiation-absorbed dose in an anthropomorphic phantom designed to simulate a gravid woman. More recently, Deak et al.12 estimated typical doses by calculating the energy deposition in a CTDI and anthropomorphic phantom using a collection of TLDs.
DeMarco et al.13 developed a Monte Carlo-based method to estimate radiation dose from MDCT using cylindrical and physical anthropomorphic phantoms. As part of their model verification, physical measurements were made using a collection of 20 MOSFET detectors placed nearly contiguously on the surface of the thorax of the anthropomorphic phantom. In a separate effort, DeMarco et al.14 used Monte Carlo simulation methods applied to cylindrical and physical anthropomorphic phantoms, where a film dosimeter was placed on the surface of CTDI phantoms to observe and measure the magnitude of the surface dose variation in MDCT. Both studies found that the larger cone angles from MDCT systems yield greater beam divergence and resulted in surface dose variations, with the peak value twice as high as the valley; these variations were observed for both helical and contiguous axial scans.
These surface dose variations have potential implications for investigators who perform surface dose measurements using small detectors on either homogeneous (e.g., CTDI) or heterogeneous (e.g., anthropomorphic) phantoms. The purpose of this paper is to more completely evaluate the variability of absorbed radiation dose in both cylindrical and anthropomorphic phantoms at surface and central (or depth) positions when performing helical or contiguous axial scans. Variability will be assessed using computational models of both types of phantoms for a variety of z-axis beam profile (or simulated beam collimation) and pitch conditions. Although previous work has demonstrated that there is some variability at the surface of phantoms, this work will serve to further investigate and quantify this variability and the factors that influence it.
METHODS AND MATERIALS
Scanner model
In this study, a 64-slice CT scanner system (Sensation 64, Siemens Medical Solutions, Forcheim, Germany) was modeled for all simulations using Monte Carlo-based methods. The models were based on previous work15 and take into account the x-ray source spectra, beam filtration (including bowtie filter), and scanner geometry (focal spot to isocenter distance, fan angle, etc.) as provided by the manufacturer. For this scanner, the widest available beam collimation is 24×1.2 mm (nominal beam width of 28.8 mm). The actual radiation profile was measured using optically stimulated luminescences (OSLs) (CT Dosimeter, Landauer, Inc. Glenwood, Illinois) that were exposed in air at isocenter during a single axial scan using the 24×1.2 mm nominal collimation. The OSL dosimeter was then sent to Landauer for reading. From the normalized radiation dose profile that resulted (a table of relative dose values as a function of z-axis location), the full width at half maximum (FWHM) of the dose profile was calculated to be 34.1 mm. This value was used as the measured beam width in the remainder of this study.
Phantoms
The cylindrical homogeneous phantoms used for CTDI measurements are well defined by U.S. and international regulatory agencies.1 The polymethyl methacrylate (PMMA) phantom, PMMA rods, and CTDI ion chamber were modeled, as described previously.16 For all simulations in this manuscript, the 32 cm diameter body CTDI phantom model was used.
A voxelized model of a heterogeneous anthropomorphic phantom, the ATOM family adult male (CIRS, Norfolk VA), was also used in the simulations. This physical phantom is comprised of the head and torso that represents a standard man who would have a height of 173 cm and a weight of 73 kg. The voxelized model of the phantom is comprised of three different materials: bone, soft tissue, and lungs. The model also includes the air around the phantom. The information about the density and composition of each simulated tissue type used in the Monte Carlo simulations was provided by the phantom manufacturer (Table 1). The voxelized phantom was created using an approach developed previously.14, 17 In this approach, spinal cord, spinal disk, and soft tissues are consolidated into one equivalent material. At the level of the chest, the lateral width of the phantom is 32 cm, and the anterior-posterior (AP) thickness of the phantom is 22 cm. At the level of the neck, the phantom is approximately circular with a diameter of 14 cm.
Table 1.
Description of anthropomorphic phantom materials—adult male (ATOM, CIRS, Norfolk, VA) (http:∕/www.cirsinc.com∕pdfs∕700cp.pdf).
| Materials | Physical density (g cm−3) | Zeff | Electron density (cm−1) |
|---|---|---|---|
| Bones | 1.60 | 11.5 | 5.03×10²³ |
| Soft Tissue | 1.055 | 7.15 | 3.43×10²³ |
| Lungs | 0.21 | 7.10 | 0.681×10²³ |
Monte Carlo method
Monte Carlo simulations were performed to estimate dose distributions along the z-axis at both surface and central positions for each phantom. By defining the tally points at various locations, the radiation dose can be assessed anywhere in the model using the Monte Carlo method.
To perform the set of experiments described below, we utilized MCNP eXtended v2.5.c (MCNPX) code, a Monte Carlo particle transport package developed at Los Alamos National Laboratories,18, 19 to create a source model that can be used to simulate the CT x-ray source and its movement relative to the phantom for various helical or axial scan protocols. The MCNPX package provides a conventional combinatorial geometry system which uses planes and cylinders to define the CTDI phantom. It also provides lattice-based (voxel-based) geometry which was used for the anthropomorphic phantom. The mesh tally feature was used extensively in this study in order to efficiently tally the dose distribution in a high-resolution Cartesian-coordinate mesh structure. Mesh tallies are composed of a 3D array of voxels. A set of longitudinal mesh tallies was used to measure a 1D dose distribution for the CTDI phantom simulation, and a set of rectangular mesh tallies was used to measure a 2D dose distribution for anthropomorphic phantom simulation.
CT source modeling
MCNPX does not offer the ability to directly model sources as sophisticated as an MDCT source performing an axial or a helical scan. Therefore modifications to the standard MCNPX source code were performed to allow the implementation of the CT scanner and its operation for various scan protocols.16 For each emitted photon, MCNPX requires its energy, its spatial coordinate, the direction, and the weight factor to be specified. The source energy spectrum for 120 kVp was obtained from the manufacturer and implemented in the MCNPX code as a look up table from which the energy of each emitted photon could be sampled. The source model assumes that all the photons are emitted from a single point at the location of the x-ray tube focal spot. The spatial coordinates of these photons also depend on the specific scanning protocol and the source path described for each simulation; for example, contiguous axial scans or helical scans with different pitch values. The direction of each photon was uniformly sampled based on the fan beam angle provided by the manufacture. Filter information, such as the bowtie filter, was also provided by the manufacturer and was utilized to calculate weight factors based on attenuation coefficients. As in previous work, this approach achieved agreement with measured CTDI100 to within 5% in both 32 and 16 cm CTDI phantoms for all kVps.13
Simulation experiments under different beam width, pitch, and phantom conditions
Peripheral and center dose profile for the CTDI body phantom
The purpose of these experiments was to investigate the nature and magnitude of the dose variation at surface and center locations of the CTDI body phantom under a variety of pitch and simulated beam width conditions. Pitch 0.75, pitch 1.0, and pitch 1.5 for helical scans, as well as contiguous axial scans were simulated for CT scan range over the full length of the CTDI body phantom (from −7.5 to 7.5 cm) using 120 kVp, 100 mAs, 24×1.2 mm wide detector configuration (28.8 mm nominal beam width). For each condition, both surface and center radiation profiles were obtained from the simulation results.
To investigate the effect of radiation beam width, three different beam widths were simulated for each experiment: (1) the nominal beam width of 28.8 mm, which would be an ideal beam width; (2) the measured radiation beam width of 34.1 mm, which is a realistic condition; and (3) a 41 mm beam width, which is 20% greater than the measured beam width and represents an extremely exaggerated condition.
For each simulation, one-dimensional mesh tallies were obtained in the (simulated) ion chamber at a peripheral position 1 cm below the surface and at the central location of the phantom, corresponding to the locations of physical measurements. Thus, the distance to isocenter was 15 cm for the peripheral location of the 32 cm phantom. The voxel size for each element in the mesh tally was 4×4×1 mm3, with a resolution of 1 mm along the z-axis.
For each condition, the resulting z-axis profiles were determined from the mesh tally and converted to absolute dose normalized to tube current (in mGy∕mAs). From these profiles, the magnitude of variation was estimated using percent ripple, which was calculated based on the difference from values at the peak to those in the valley.
Surface and center dose profiles in an anthropomorphic phantom
For the anthropomorphic phantom, we simulated helical scan pitch values of 0.75, 1.0, and 1.5, as well as contiguous axial scans. The simulated scans started at the superior edge of the phantom and continued until the inferior edge of the phantom, which covered the whole phantom completely. Tube voltage of 120 kVp and tube-current-time-product of 100 mAs were used as with CTDI phantom, but instead of various beam width settings, only the measured beam width of 34.1 mm was utilized for the anthropomorphic phantom. Since mAs was held constant, mean dose decreased as pitch was increased and vice versa.
To obtain the surface dose profile along the sagittal plane at the center of the phantom, two steps were performed. First, since MCNPX does not allow specifying mesh tallies along a nonstraight line (e.g., the phantom surface locations along the sagittal plane), a set of rectangular mesh tally elements was used on the whole sagittal plane at the center of the phantom. Each mesh tally element has an x∕y size of 2.968×2.968 mm and with a length of 2.5 mm along the z-axis. The positions and sizes of mesh tallies were carefully selected so that only one material was included in each mesh tally. This two-dimensional mesh tally gave a dose distribution map of the central sagittal plane of the phantom, including all the air voxels. Second, surface coordinates of the voxelized phantom were extracted along the interface between the air and the tissue and surface dose profiles were generated. As before, the resulting profiles were determined for each condition from the mesh tally and converted to absolute dose normalized to tube current (in mGy∕mA s). From these profiles, the magnitude of variation was estimated based on the percent ripple.
The effect of tube starting angle
Because each simulation demonstrated a periodic behavior, the effect of source phase angle (or start angle of x-ray tube at the time the x-ray beam switches on) was investigated. In all previously described experiments, a tube starting angle of 0° (corresponding to 12 o’clock in the gantry) was used. To further explore possible sources of variation due to start angle, the x-ray tube start angles were changed to be 90°, 180°, and 270° for a clockwise rotation. Since the angular position of the x-ray tube at a specific table location would be different for various tube starting angles, the dose profile will shift according to different tube angular positions when x-ray is turned on. These experiments were performed with pitch=1.5 and the measured beam width (34.1 mm).
Varying pitch to obtain a smooth surface dose profile
The effectiveness of minimizing surface dose variation by adjusting pitch values was investigated. Previous published work proposed that a smooth surface dose can be produced by using a pitch value of
| (1) |
where S is the source to isocenter distance and R is the distance from isocenter to the point of surface dose measurement.7 If the measured beam width is taken into account, then this pitch value would be adjusted to be
| (2) |
Here, A is the measured beam width and N is the nominal beam width. This is similar to the approach of Vrieze et al.20 who did this work with measurements. This pitch can be called the completely smoothed profile pitch (CSPP). For the Siemens Sensation 64 CT scanner, S=57 cm. For the 32 cm CTDI phantom, phantom radius R=15 cm (measurement is at 1 cm below surface for CTDI body phantom); for the 24×1.2 nominal collimation, N=28.8 mm and A=34.1 mm. The pitch value using the ideal approach for a CTDI body phantom is 0.74, while the CSPP value, where the measured beam width is taken into account, is 0.87.
Therefore, two separate experiments were performed to obtain the surface dose profiles for the CTDI phantom using the measured beam width (34.1 mm), but different pitch values of 0.74 and 0.87.
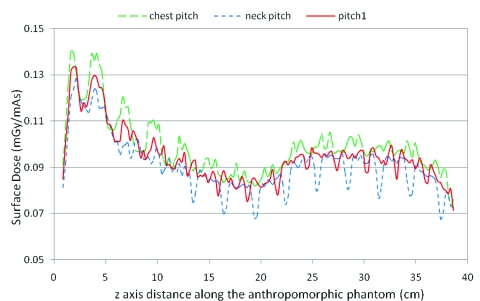
Similar experiments were also performed on the anthropomorphic phantom. However, R is not uniform along the z-direction in this case. R at the neck region (from isocenter to the anterior surface of the neck) is approximately 7 cm, and R at the chest region (from isocenter to the anterior surface of the chest) is about 11 cm. Therefore, two CSPP values, 1.04 and 0.96, were calculated separately for these two radii using Eq. 2 with measured beam width taken into account. They are referred to as neck pitch and chest pitch, respectively. In addition, one more pitch value was evaluated, which was the midpoint of these two pitch values (1.0), to investigate if one pitch could smooth the dose variation for both neck and chest regions. Simulations were performed using the measured beam width (34.1 mm) and these three pitch values. Again, the surface dose profiles were determined for each condition from the mesh tally and converted to absolute dose normalized to tube current (in mGy∕mAs). The percent ripple was calculated from these profiles.
Evaluation of peripheral dose curve on CTDI phantom using a virtual Farmer chamber
To investigate the peripheral dose variation behavior in practical measurements, an additional peripheral dose distribution was generated using a virtual dosimeter with size larger than the size used in simulation (1 mm). The size of the dosimeter will determine the pattern of the surface dose variation because of the integration that it performs along the z-direction. A 24 mm long virtual Farmer chamber, which is a typical size, was chosen to evaluate the effect of dosimeter size. The dose distribution curve for this dosimeter was obtained by convolving the 1 mm resolution peripheral dose distribution with a 24 mm long region. This will be illustrated by simulating an acquisition with pitch 1.5.
Varying pitch to obtain a uniform dosimeter output based on the dosimeter length
Since the general shape of surface dose variation has a periodic distribution, if the length of the dosimeter roughly equals the period observed in the dose variation curve, the dosimeter reading will be the average dose variation over one complete cycle. Because the period of the dose variation curve is basically the table feed per rotation, (i.e., the product of nominal beam width and pitch), a specific pitch value can be determined to obtain that average value; this pitch is the detector length divided by the nominal beam width and can be called the functionally smoothed profile pitch (FSPP). For scans using this pitch, although the surface dose profile itself still has variations, the period of this variation matches the size of the dosimeter so that the average dose is measured, regardless of where this detector is located along the z-axis. FSPP is a function of detector length in the z-direction and nominal beam width. For a 24 mm long Farmer chamber and the nominal beam width used here (28.8 mm), the FSPP pitch would be 0.83. To demonstrate this, an acquisition was simulated with pitch 0.83 for the CTDI phantom and surface dose profile was obtained as before; it should be noted that the actual beam width of 34.1 mm was used for this simulation. The dose distribution curve using this pitch value for the virtual dosimeter was obtained by the same convolution method described above.
Measurements on the scanner for confirmation of the simulations
To confirm that the peripheral dose profile would have the same behavior as in the simulations, OSLs were used for a contiguous axial scan on Siemens Sensation 64 MDCT with nominal beam width of 28.8 mm. 32 cm CTDI phantom was used and OSLs were put in a specific holder which can fit in the peripheral cavity at 12 o’clock of the phantom. OSL results were obtained similar to the methods described in Sec. 2B.
RESULTS
The MCNPX run time for the CTDI body phantom geometry was approximately 2 h for 100×106 source photons using an AMD Athlon 64 Processor running at 2.00 GHz. Simulations took approximately 48 h for the anthropomorphic model for 400×106 source photons. The number of histories used for the simulations where the pitch value was varied to smooth the surface dose variation was set to be 800×106 for better statistics. The relative errors of the Monte Carlo simulations were within 3% for CTDI phantom and within 2% for anthropomorphic phantom for most voxels in the mesh tally. A few mesh tally voxels (less than 1%) had relative errors as high as 6%. This may due to the limited number of entrance photons for that specific mesh tally voxel in the simulation. Overall, these statistics were considered acceptable.
Peripheral and center dose profile for the CTDI body phantom
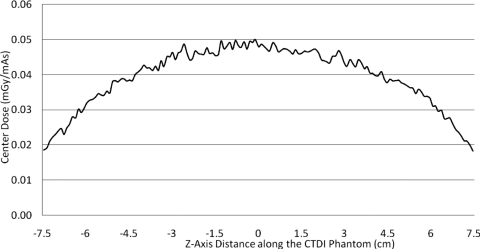
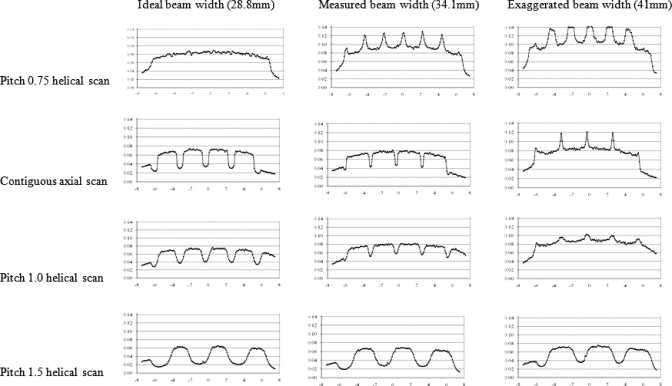
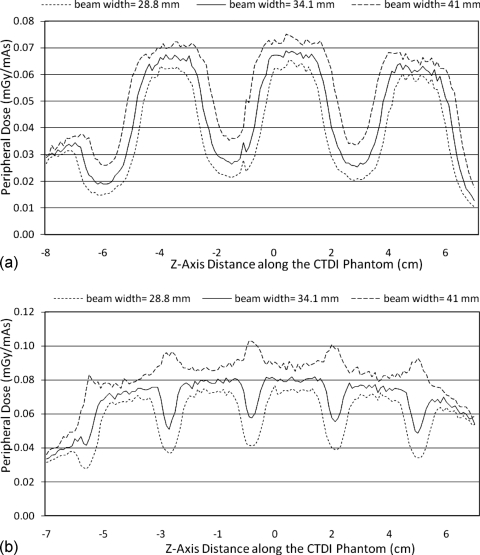
For the CTDI phantom, the central dose profile for pitch=1 is shown in Fig. 1, which is a representative of all the center dose profiles because they have similar uniform distributions. This is because of the smoothing effect of scattered radiation within the phantom. The results of the peripheral dose profiles for all combinations of pitch and simulated radiation beam width are shown in Fig. 2. This figure demonstrates that although radiation dose profiles at the center position of a CTDI phantom are relatively constant, the increased beam divergence with wider beams results in peripheral dose variations, generating pronounced peaks and valleys instead of uniform distributions. Even for the contiguous axial scan (second row), there are dramatic peaks and valleys in the peripheral dose distribution. For the case where the simulated beam width is equal to the nominal beam width, the percent ripple can be as high as 50%. For the case where the simulated beam width is equal to the measured beam width, although the valleys are not as deep or as wide, the percent ripple is still nearly 50%. The contiguous axial scans (second row of Fig. 2) also show that when the radiation beam width is increased (for this same nominal collimation), not only do the valleys fill in but also new peaks are created at the locations where the valleys used to be and reach values nearly 50% higher than the previous peaks.
Figure 1.
Center dose profile for 32 cm CTDI phantom, pitch 1.0 helical scan, measured beam width 34.1 mm. All central profiles were similar due to the smoothing effect of the large scatter contribution at the center of a large phantom.
Figure 2.
Peripheral CTDI dose profiles for all radiation profile widths and pitch values used in this study.
Figure 2 also demonstrates that pitch 1.0 helical scans show similar behavior to the contiguous axial scans, although the valleys are shallower and wider than the axial scans. Additionally, the new peaks created by the exaggerated beam width case are not as high (only increasing approximately 20%). The pitch 1.5 helical scans show wider and deeper valleys (as expected), with the percent ripple being as high as 70%. The results from an overlapping pitch (pitch=0.75) provide a smooth peripheral dose profile in the case where the simulated beam width is equal to the nominal beam width (ideal case), but when the simulated beam width is equal to the measured beam width (34.1 mm), then peaks are created that can be 40% higher than the previous peak values.
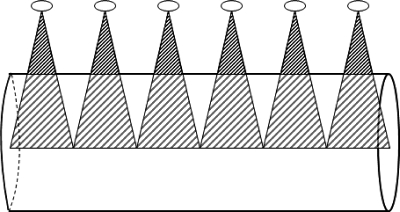
Figure 3 is a schematic figure to demonstrate the role of beam divergence even for a contiguous axial scan. This figure shows that for a contiguous axial scan with a radiation beam width at isocenter equal to the nominal beam collimation (e.g., Fig. 2, second row, first column), the central region is contiguously covered by the primary beam but the surface of the CTDI phantom is not.
Figure 3.
Lateral view of cylindrical phantom and divergent x-ray beam to illustrate the effect of cone angle. An ideal beam width is assumed (FWHM=nominal beam collimation) for the condition of a contiguous series of axial scans. The surface is not completely covered by the primary entrance beam. The small ellipses represent tube positions.
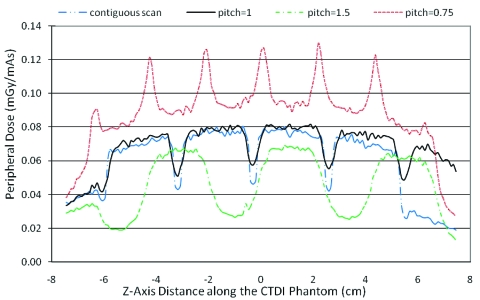
Figure 4 demonstrates the effects of varying only the pitch using measured beam width (34.1 mm) condition. A helical scan of pitch 1 shows that the percent ripple is 30%. For a contiguous axial scan the percent ripple increases to 45%. For extended pitch 1.5, it can be as high as 62%. For pitch 0.75, the edges of the subsequent cone beams overlap and a new peak is created which results in a 40% increase.
Figure 4.
Peripheral dose profile on 32 cm CTDI phantom for different pitch values (a contiguous axial scan and helical scans with pitch values of 0.75, 1, and 1.5) for a constant beam width (here using actual measured beam width of 34.1 mm).
The effect of different radiation beam widths is shown in Fig. 5 for a given nominal beam width. This is best illustrated for pitch 1.5 helical scans where no overlap of the primary beam exists. As the beam width increases, there is more exposure (both primary beam and secondary scatter), and hence the height of both peaks and valleys increases. Also, as the beam width increases, the valleys between every two beams are filled in due to the decreasing distance between the edges of the beams. Thus, amplitude variations (from peak to valley) for larger beam widths are less dramatic than for narrower beam widths. For example, the percent ripple is as high as 70% for a beam width of 28.8 mm and decreases to 53% for a beam width of 41 mm. The peripheral dose distribution at various beam widths for pitch 1.0 is shown in Fig. 5b. This figure demonstrates that with wider radiation beams widths, complete filling in of the valleys can occur and result in new peaks being formed where the edges of the radiation beam overlap in adjacent rotations, even for pitch 1.
Figure 5.
(a) Peripheral dose profiles on 32 cm CTDI phantom for three different radiation beam widths using the same nominal (28.8 mm) collimation and the same helical pitch (1.5). (b) Same as (a) but with pitch 1.0. As beam width increases, new peaks occur where there is overlap of primary beams.
Surface and center dose profile on anthropomorphic phantom
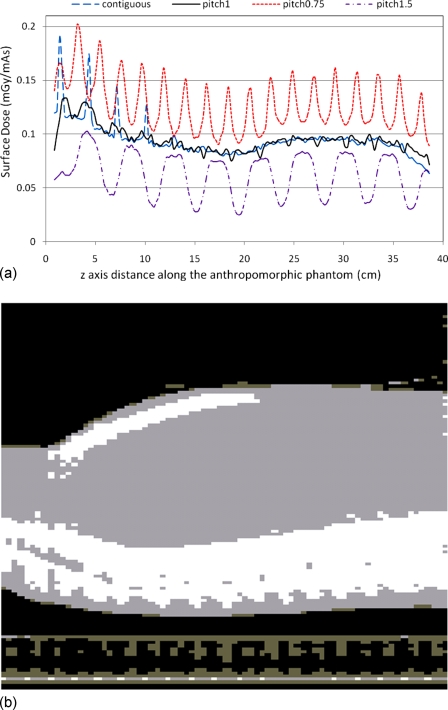
The radiation dose profiles at the anterior surface position of the anthropomorphic phantom were examined for both helical and contiguous axial scans. These simulations gave similar results to CTDI phantoms in terms of surface dose variation. Figure 6a shows the anterior skin dose profile for helical pitch 0.75, pitch 1.0, and pitch 1.5 as well as contiguous axial scan with the measured beam width of 34.1 mm. The surface dose (skin) is higher close to the neck region where the AP phantom thickness is around 14 cm, and it decreases at thoracic and abdominal locations where the thickness is about 22 cm. Figure 6b is a sagittal view of the anthropomorphic phantom for reference. Helical scans of pitch 1.0 provide a more uniform dose profile through the chest and abdomen regions, where the percent ripple is 5%. For pitch 1.5, the percent ripple can be as high as 40%. For pitch 0.75, a peak is created which results in a 37% increase in surface dose.
Figure 6.
(a) Surface dose profile for anthropomorphic phantom at pitch 0.75, pitch 1, and pitch 1.5, as well as a contiguous axial scan. (b) The bottom illustration shows the central sagittal plane of the phantom. The anterior-posterior thicknesses of the neck and thoracic regions are approximately 14 and 22 cm, respectively.
The effect of tube starting angle
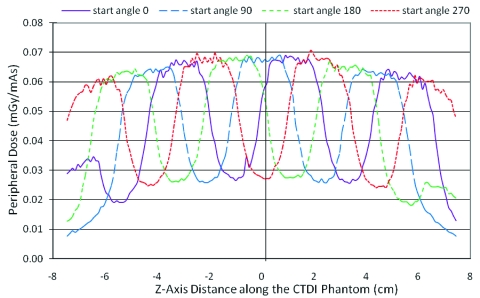
Figure 7 shows the peripheral dose profiles at various tube start angles. This effect is best illustrated for a pitch 1.5 helical scan. As expected, different tube start angles create a phase shift in the peripheral dose profile, resulting in dramatic variation in dose at a given z-axis location. For a given location (z-axis position), the peripheral dose can vary by more than a factor of 2 depending on the tube start angles. For example, at the center location (0 cm), the peripheral dose values range from 0.027 to 0.068 mGy∕mAs depending on the tube start angle. Only the dose profiles for pitch 1.5 and measured beam width of 34.1 mm are presented here, but the other simulation results were similar.
Figure 7.
Peripheral dose profile on 32 cm CTDI phantom for different start tube start angles using a constant pitch 1.5 and measured beam width (34.1 mm).
These surface dose variations would have significant implications for measurement of standard dose indices such as CTDIw. Though the current definition of CTDI is that it is measured with a single axial scan, there are active discussions to perform these standard measurements with helical protocols. In the above example, the CTDI value measured at the center position from a helical scan would be 0.035 mGy∕mAs. Adapting the current definition of CTDIw(=(1∕3)×CTDIcenter+(2∕3)×CTDIperiphery) to these measurements, this would lead to CTDIw values which would range from 0.036 mGy∕mAs (when measured at the valley) to 0.055 mGy∕mAs (when measured at the peak), which leads to a difference of as high as 50% between measurements. Note that this difference would be only due to differences in start angle (or essentially table position of the dosimeter). As will be shown in Secs. 3D, 3E, 3F below, there are strategies to reduce these variations using different pitch values and taking into account the length of the dosimeter.
Varying pitch to obtain a smooth surface dose profile
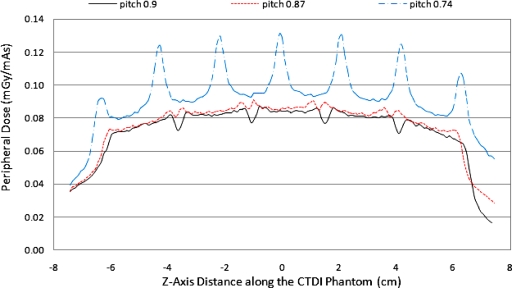
The effectiveness of CSPP for the CTDI phantom is shown in Fig. 8, which shows that, with the measured beam width taken into account, the peripheral dose variation can be minimized. For this specific collimation setting, the CSPP value is 0.87. However, if the measured radiation beam width is not taken into account during the pitch calculation (pitch=0.74), then the peaks and valleys are still substantial. As discussed earlier, a pitch value that is too low causes beam overlap of primary radiation and creates new peaks. So it is important to take the measured beam width into account to arrive at a pitch value [described in Eq. 2] that minimizes peripheral dose variation. However, such an exact pitch value is not necessarily achievable in practice using commercial CT scanners. Figure 8 also shows the peripheral dose profile for CTDI body phantom at the closest available pitch value 0.9 (compared to 0.87). The difference between peaks and valleys is not trivial, with variations reaching 20%. This demonstrates that even when CSPP is selected based on the measured radiation profile, practical limitations may prevent a smooth surface profile from being obtained, and it may not be possible to obtain a completely smoothed profile when using a single small detector due to these variations.
Figure 8.
Peripheral dose profile in CTDI body phantom for measured beam width of 34.1 mm, pitch 0.87, pitch 0.74, and pitch 0.9 helical scans. Pitch 0.87 is the desired pitch value predicted to produce the most uniform dose profile. Knowledge of the FWHM of the actual beam width is required to determine this value, as in Eq. 2. Pitch 0.74 is the calculated pitch value to smooth peripheral dose variations when the measured beam width is not taken into account [i.e., the pitch calculated from Eq. 1]. Pitch 0.9 is the pitch value available on this scanner that is closest to the desired pitch value.
The results from simulated scans using CSPP for the anthropomorphic phantom are shown in Fig. 9, where neck pitch (1.04), chest pitch (0.96), and average pitch (1.0) were used. This shows that for the neck pitch value, the variation at the neck region can be reduced to about 9% (valley is 91% of the peak) but the variation at the chest region when using the neck pitch is still as large as 20%. It also shows that for the chest pitch value, the variation at the chest region is reduced below 8% but at the neck region the variation can still be as high as 16%. Choosing a midpoint pitch is a compromise rather than minimizing variations at both regions; resulting in variations that are nearly 20% in both the chest and neck regions. Therefore, for an anthropomorphic phantom where the distance between the surface and the isocenter is not constant, there is no CSPP value which can perfectly smooth the surface dose curve. In addition, the heterogeneous nature of anthropomorphic phantoms also contributes to surface dose variation and cannot be controlled by the choice of pitch values.
Figure 9.
Anterior surface dose profile on anthropomorphic phantom at chest pitch (0.96) to smooth the dose profile along the chest, neck pitch (1.04) to smooth the dose profile along the neck, as well as average pitch (1.0).
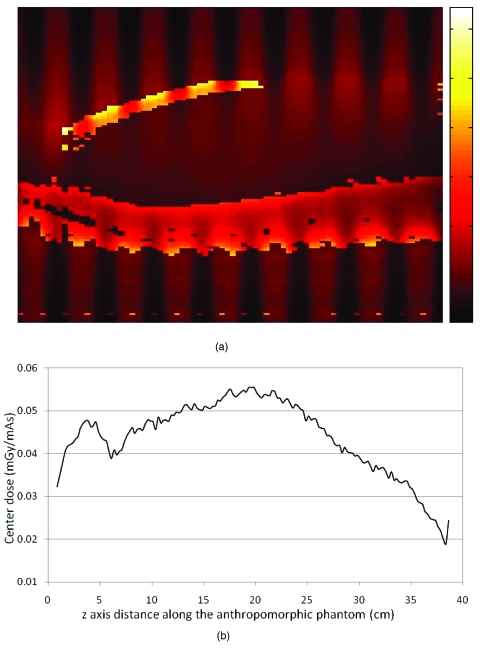
These results show that the anthropomorphic phantom creates more complex patterns of surface dose than does the CTDI body phantom because of the heterogeneous composition and shape of the anthropomorphic phantom. Figure 10a shows the 2D dose distribution of the central sagittal plane for pitch 1.5 helical scan, with the same orientation in Fig. 6b. This figure was generated using a temperature color map and indicates that the absorbed dose in the simulated bone materials (sternum and spine) is very high because of the higher energy absorption coefficient. It also illustrates the heterogeneous nature of the dose distribution within the anthropomorphic phantom on the central sagittal plane. The periodic variation is clearly observed in this figure and is most obvious at the peripheral positions (e.g., the anterior surface of the chest). Therefore, even the center dose profile [taken at depth as shown in Fig. 10b] is not as uniform along the z-direction as in the cylindrical CTDI phantom (Fig. 1).
Figure 10.
(a) The 2D dose distribution is displayed on the central sagittal plane of the anthropomorphic phantom, shown in Fig. 6b, for a pitch 1.5 helical scan. This is a temperature color map scale dose distribution, where white represents high dose and black represents low dose. (b) The z-axis dose profile obtained at approximately the central depth of the phantom within this plane.
Peripheral dose curve in CTDI phantom using a virtual Farmer chamber
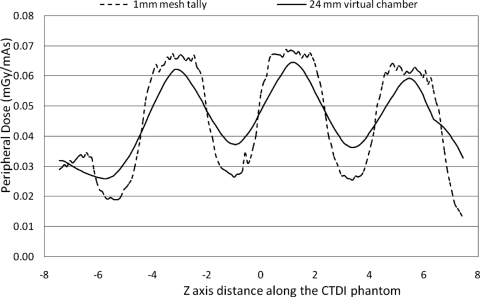
In all of the results shown above for CTDI phantom, the voxel size along the z-axis direction was 1 mm, providing a good representation of the dose as measured using small dosimeters such as TLDs or MOSFETs. However, when the dosimeter size is larger, the surface dose profile is altered due to the integration along the z-axis. This is illustrated in Fig. 11, which shows the peripheral dose distribution for a 32 cm CTDI phantom that would be obtained using both 1 mm voxel tallies and a 24 mm long virtual dosimeter (e.g., Farmer chamber) for a scan performed with the measured beam width (34.1 mm) and pitch of 1.5. The curve for the 24 mm virtual dosimeter was obtained by convolving the original surface dose distribution with a 24 mm long square function centered at each point along the z-axis. This illustrates that the integration effect of the Farmer chamber slightly averages out the dose variation. However, there are still substantial dose variations for pitch of 1.5; the percent ripple is as high as 58%.
Figure 11.
The comparison of peripheral dose distribution from 1 mm mesh tally and from a virtual 24 mm long (z-direction) Farmer chamber using a scan of a 32 cm CTDI phantom, measured beam width of 34.1 mm and pitch value of 1.5.
Varying pitch to obtain a uniform dosimeter output based on the dosimeter length
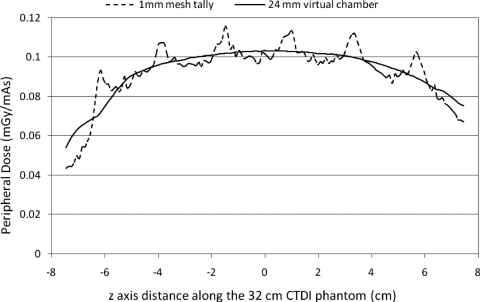
Figure 12 shows the simulated surface dose profile using FSPP value 0.83 for 1 mm mesh tallies. It also shows the output of the 24 mm virtual Farmer chamber. The results show that with this pitch, the surface dose profile measured with a 24 mm virtual dosimeter is very smooth. Simulations were also performed for pitch values close to FSPP and it was shown that the variation in the output of the chamber is within 5% when the pitch value is within FSPP ±0.17 (0.66–1.0). So FSPP is not as sensitive as CSPP in terms of the effectiveness to smooth the surface dose variation. Unlike CSPP, a pitch value that is close to FSPP could also generate an output profile without too much variation.
Figure 12.
Surface dose profiles from the 1 mm voxel dose tallies and from the virtual 24 mm Farmer chamber for a pitch value of 0.83, which was the FSPP pitch value used to average out variations for the 24 mm long dosimeter.
Measurements on the scanner for confirmation of the simulations
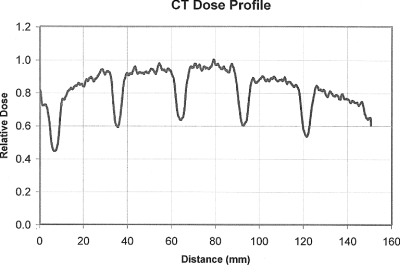
The peripheral dose distribution at 12 o’clock position of a 32 cm CTDI phantom from OSL measurements for a contiguous axial scan with 28.8 mm nominal beam width is shown in Fig. 13. The shape of this dose profile is very similar to the simulated one (Fig. 2, row 2, column 2) in that both show peaks and valleys of approximately the same amplitude, width, and frequency. They are not identical possibly because an air filled ion chamber was modeled in the simulation rather than the OSL. These results are similar to those obtained in a previous publication,13 where good agreement was achieved for the peripheral dose profiles between simulations and measurements using MOSFETs.
Figure 13.
Peripheral dose profile on a 32 cm CTDI phantom from OSL measurements for a contiguous axial scan with 28.8 mm nominal beam width. Variation is clearly demonstrated as that in simulations.
DISCUSSION AND CONCLUSION
In this work, we have used Monte Carlo techniques to simulate the radiation dose distributions from a MDCT scanner. These profiles demonstrate a range of dose variability at peripheral positions, for both a homogeneous cylindrical phantom and a heterogeneous anthropomorphic phantom. These variations can have a significant impact on standard dosimetry measurements (including those proposed) when helical scans are used with small dosimeters. For CTDI measurements using a helical scan and small (24 mm long chamber), results from Sec. 3C demonstrated differences in CTDIw values of up to 50% between measurements where only the tube start angle (an uncontrolled variable) was varied.
Peripheral dose profiles for the body CTDI phantom varied with pitch and beam width. In general, for both contiguous axial and helical scans, the entrance radiation dose was not always uniform along the z-direction. Depending on the positions of the x-ray tube, some points along the surface at a given z-axis location are exposed to entrance, exit, and scattered radiation, while points on the same surface at other z-axis locations are exposed only to exit and scattered radiation. The difference between the maximum and the minimum values of a surface dose profile depended on several factors but was essentially determined by how uniformly the surface was irradiated by the primary entrance beams.
Generally, the variation in the surface dose distribution becomes larger when the pitch is higher, the simulated beam width is narrower, or the point of interest is more distal from isocenter. However, there are also conditions that can result in a uniform surface dose distribution such as that caused by a wider beam width, shown by the 41 mm beam width with pitch 1 scan in Fig. 2; or as caused by a lower pitch value, as the 28.8 mm beam width with pitch 0.75 scan in Fig. 2. There are also conditions in which wider beam widths and lower pitch values result in overlap of subsequent beams which then result in higher peak values as shown first in Fig. 2 and specifically illustrated in Fig. 4 (constant beam width and varying pitch values) and Fig. 6 (constant pitch, varying beam widths). These newly formed overlap regions can have doses as much as 40% higher than in areas where the primary radiation is not overlapped at the phantom surface.
The tube start angle is significant when determining the dose at a certain surface point because of the phase shift effect. In clinical applications using commercial CT scanners, however, tube start angle is typically unknown and not under the user’s control. As shown in Fig. 7, the dose at a certain point can vary by a factor of more than 2 across different tube start angles. This can be a large source of error when determining surface dose on a patient or an anthropomorphic phantom, especially when the surface is farther from isocenter and especially when single measurements are made. Because the tube start angle is not under the user’s control, it is generally not possible to reproduce multiple scans using the exact same start angle. Even if repeat measurements are made, there is no assurance that the range of possible start angles (and therefore the range of surface doses) has been adequately represented.
In all, for a homogeneous CTDI body phantom, the “frequency” of the peripheral dose distribution decreases as the nominal beam collimation and pitch increase. The “phase” depends on the tube start angle. The “amplitude” increases with distance from isocenter. The shape of the distribution depends on the simulated beam width and pitch. These factors together determine the pattern of the surface dose variation. The results from this study also reveal the complexity of estimating surface dose in a complex heterogeneous anthropomorphic phantom or even in simple geometries such as a CTDI phantom. The limitation of this study is that only 32 cm PMMA phantom and only one set of collimation (28.8 mm) were investigated. Therefore the results shown in this study are likely to be one of the worst case scenarios. However, since larger cone-beam angle and higher pitch values may be used for fast CT scanning, and since very wide nominal beam width (>40 mm) MDCT scan systems are being introduced, careful consideration should be made before the determination of surface dose.
Despite these significant variations, there may be several approaches to obtain reasonably accurate and reproducible surface dose measurements from helical scans. One appropriate approach when small (approximately 1 mm along the z-axis) dosimeters are used is to increase the sampling frequency, which requires a large number of small detectors placed close enough to each other along the z-axis direction to adequately sample both the peaks and the valleys of the surface profile. A second approach is to manipulate pitch to be CSPP values so that the resulting surface dose will be more uniform. Dixon7 proposed a method to minimize the surface dose variation by using a pitch value less than or equal to the value described in Eq. 1. Equation 1 was modified in this study to use the measured beam widths rather than nominal beam width, resulting in Eq. 2. Scanning with this CSPP value created a nearly smooth surface dose distribution. However, in practice this approach may be limited; the exact pitch value desired may not be available on a commercial scanner. In addition, for an anthropomorphic phantom, a single pitch value will not produce a constant surface dose value because the thickness of the phantom is not uniform and the materials are heterogeneous.
These findings have potential implications for point dose measurements in cylindrical or anthropomorphic phantoms, such as TLDs, MOSFETs, or small Farmer chamber measurements, including those being proposed as new dose metrics (such as those being developed by AAPM Task Group 111). Depending on the size and type of the dosimeter, the pattern of the surface dose distribution variation can be affected by both dosimeter size and spacing. Furthermore, if the dosimeter has such a length in the z-direction that the sample length equals the period of the surface dose distribution curve (or an integer multiple of the period), the output of the dosimeter is still uniform. This can be expressed using the following:
| (3) |
where N is the nominal beam width and i is an integer number starting with 1. Therefore, a pitch value can be chosen that will result in a smooth surface dose profile,
| (4) |
Figure 12 showed the dosimeter output for this desired pitch value when i is 1 (FSPP). Although the actual distribution of surface dose was not uniform, FSPP created a sampling interval where the 24 mm long virtual dosimeter was able to integrate over one full period of the dose distribution. The detector output is uniform and it represents an average of the surface dose.
This can be a third method to reduce surface dose variations in terms of practical measurements. In addition, since the pitch is not required to be the exact FSPP value to generate relatively smooth chamber output profile, this method has less limitation from the availability of the pitch on commercial scanners. However, this method is limited by the fact that FSPP is related to the dosimeter length in the z-direction and the nominal collimation used. For example, if a 3 mm TLD and 28.8 mm nominal beam width are used, the FSPP is 0.1, which is too small to be practical.
The second and third approaches proposed above involve the adjustment of pitch, which could reduce the variability of surface dose. In practical measurement, the dose from scans using other pitches can be obtained based on the ratio of pitch values because the average dose is inversely proportional to pitch values.
This work is not only relevant to measuring doses in homogeneous and heterogeneous (anthropomorphic) phantoms but it may have relevance for investigations involving estimating organ dose, especially for radiation sensitive organs at or near the surface such as the breast, thyroid, and lens of eye. Future work includes the investigation of the effects of surface dose variations from larger cone angles and helical scans on individual organ doses using voxelized patient models, such as the GSF models.21
ACKNOWLEDGMENT
Support for this work was provided by a Grant from the National Institute of Biomedical Imaging and Bioengineering (NIBIB) PHS No. R01EB004898.
References
- McNitt-Gray M. F., “AAPM/RSNA Physics tutorial for residents: Topics in CT: Radiation dose in CT,” Radiographics 22, 1541–1553 (2002). [DOI] [PubMed] [Google Scholar]
- Shope T., Gagne R., and Johnson G., “A method for describing the doses delivered by transmission x-ray computed tomography,” Med. Phys. 10.1118/1.594995 8, 488–495 (1981). [DOI] [PubMed] [Google Scholar]
- Department of Health and Human Services, Food and Drug Administration,“21 CFR Part 1020: Diagnostic x-ray systems and their major components,” amendments to performance standard—FDA. Final rule,” 1984. [PubMed]
- IEC 60601–2-44, “Medical electrical equipment, Part 2–44: Particular requirements for the safety of X-ray equipment for computed tomography,” 2002.
- American Association of Physicists in Medicine, “The measurement, reporting, and management of radiation dose in CT,” Report No. 96 (2008).
- Menzel H., Schibilla H. and T. D, “European guidelines on quality criteria for computed tomography,” European Commission, Luxembourg, 2000. [DOI] [PubMed]
- Dixon R. L., “A new look at CT dose measurement: Beyond CTDI,” Med. Phys. 10.1118/1.1576952 30, 1272–1280 (2003). [DOI] [PubMed] [Google Scholar]
- Dixon R. L. and Ballard A. C., “Experimental validation of a versatile system of CT dosimetry using a conventional ion chamber: Beyond CTDI100,” Med. Phys. 10.1118/1.2757084 34, 3399–3413 (2007). [DOI] [PubMed] [Google Scholar]
- Hurwitz L. M., Yoshizumi T. T., Reiman R. E., Paulson E. K., Frush D. P., Nguyen G. T., Toncheva G. I., and Goodman P. C., “Radiation dose to the female breast from 16-MDCT body protocols,” AJR, Am. J. Roentgenol. 186, 1718–1722 (2006). [DOI] [PubMed] [Google Scholar]
- Hurwitz L. M., Yoshizumi T., Reiman R. E., Goodman P. C., Paulson E. K., Frush D. P., Toncheva G., Nguyen G., and Barnes L., “Radiation dose to the fetus from body MDCT during early gestation,” AJR, Am. J. Roentgenol. 186, 871–876 (2006). [DOI] [PubMed] [Google Scholar]
- Jaffe T. A., Yoshizumi T. T., Toncheva G. I., Nguyen G., Hurwitz L. M., and Nelson R. C., “Early first-trimester fetal radiation dose estimation in 16-MDCT without and with automated tube current modulation,” AJR, Am. J. Roentgenol. 190, 860–864 (2008). [DOI] [PubMed] [Google Scholar]
- Deak P., van Straten M., Shrimpton P. C., Zankl M., and Kalender W. A., “Validation of a Monte Carlo tool for patient-specific dose simulations in multi-slice computed tomography,” Eur. Radiol. 18, 759–772 (2008). [DOI] [PubMed] [Google Scholar]
- DeMarco J. J., Cagnon C. H., Cody D. D., Stevens D. M., McCollough C. H., Daniel J. O., and McNitt-Gray M. F., “A Monte Carlo based method to estimate radiation dose from multidetector CT (MDCT): Cylindrical and anthropomorphic phantoms,” Phys. Med. Biol. 10.1088/0031-9155/50/17/005 50, 3989–4004 (2005). [DOI] [PubMed] [Google Scholar]
- DeMarco J. J., Cagnon C. H., Cody D. D., Stevens D. M., McCollough C. H., O’Daniel J., and McNitt-Gray M. F., Estimating Surface Radiation Dose from Multidetector CT: Cylindrical Phantoms, Anthropomorphic Phantoms and Monte Carlo Simulations (SPIE, MI, 2005), Vol. 5745, pp. 102–112. [DOI] [PubMed] [Google Scholar]
- DeMarco J. J., Cagnon C. H., Cody D. D., Stevens D. M., McCollough C. H., Zankl M., Angel E., and McNitt-Gray M. F., “Estimating radiation doses from multidetector CT using Monte Carlo simulations: Effects of different size voxelized patient models on magnitudes of organ and effective dose,” Phys. Med. Biol. 10.1088/0031-9155/52/9/017 52, 2583–2597 (2007). [DOI] [PubMed] [Google Scholar]
- Jarry G., DeMarco J. J., Beifuss U., Cagnon C. H., and McNitt-Gray M. F., “A Monte Carlo-based method to estimate radiation dose from spiral CT: From phantom testing to patient-specific models,” Phys. Med. Biol. 10.1088/0031-9155/48/16/306 48, 2645–2663 (2003). [DOI] [PubMed] [Google Scholar]
- DeMarco J., Solberg T., and Smathers J., “A CT-based Monte Carlo simulation tool for dosimetry planning and analysis,” Med. Phys. 10.1118/1.598167 25, 1–11 (1998). [DOI] [PubMed] [Google Scholar]
- Waters L. S., “mcnpx User’s Manual, Version 2.4.0,” Los Alamos National Laboratory Report No. LA-CP-02–408 (2002).
- Waters L. S., “MCNPX, Version 2.5.C,” Los Alamos National Laboratory Report No. LA-UR-03–2202 (2003).
- Vrieze T., Bauhs J., and McCollough C., “Use of spiral scan acquisitions for CT dose measurements: Selection of optimal pitch values to ensure reproducible results,” Radiological Society of North America RSNA, Chicago, IL, 2007), p. 245. [Google Scholar]
- Petoussi-Henss N., Zankl M., Fill U., and Regulla D., “The GSF family of voxel phantoms,” Phys. Med. Biol. 10.1088/0031-9155/47/1/307 47, 89–106 (2002). [DOI] [PubMed] [Google Scholar]


