Abstract
Charge coupled devices (CCDs) are being increasingly used in radiation therapy for dosimetric purposes. However, CCDs are sensitive to stray radiation. This effect induces transient noise. Radiation-induced noise strongly alters the image and therefore limits its quantitative analysis. The purpose of this work is to characterize the radiation-induced noise and to develop filtration algorithms to restore image quality. Two models of CCD were used for measurements close to a medical linac. The structure of the transient noise was first characterized. Then, four methods of noise filtration were compared: median filtering of a time series of identical images, uniform median filtering of single images, an adaptive filter with switching mechanism, and a modified version of the adaptive switch filter. The intensity distribution of noisy pixels was similar in both cameras. However, the spatial distribution of the noise was different: The average noise cluster size was 1.2±0.6 and 3.2±2.7 pixels for the U2000 and the Luca, respectively. The median of a time series of images resulted in the best filtration and minimal image distortion. For applications where time series is impractical, the adaptive switch filter must be used to reduce image distortion. Our modified version of the switch filter can be used in order to handle nonisolated groups of noisy pixels.
Keywords: plastic scintillators, CCD cameras, dosimetry, denoising
INTRODUCTION
Charge coupled devices (CCDs) are increasingly used in radiation therapy applications.1, 2, 3, 4 Their advantages include high resolution, good sensitivity, short acquisition times, and a large field of view. With the proper lenses, CCDs can be used to sample a large area for use with liquid scintillation materials3 or plastic scintillation sheets2, 4 or to read thousands of miniature detectors placed in an array.1, 5, 6, 7
One disadvantage of a CCD, however, is that stray radiation can induce transient noise on its surface or within its electronics. Extracting dosimetric information from CCD images requires accurate quantitative analysis of images. If the CCD camera is inside of a medical linac vault, transient noise produced by stray radiation may limit accurate quantitative analysis. Radiation-induced transient noise usually appears as sharp spikes or impulses affecting one or a small cluster of pixels.
One obvious solution to this problem is to take the CCD camera outside the radiation vault, but unfortunately it is often impractical or impossible to do so. When using a CCD for acquiring a 2D image such as in the work of Petric et al.4 or Kirov et al.3 the camera must be close to the scintillator. While mirrors can be used to prevent the camera from being within the path of the primary radiation beam, it is impossible to have the camera outside the radiation vault. When using CCD to image arrays of miniature scintillation detectors1 the camera can, in theory, be taken outside the radiation vault. However, as we move toward larger arrays this solution becomes less and less viable from practical and economical viewpoints. Having to route the output of all scintillation detectors outside the radiation vault may pose some problems. For example, a bundle of 50 optical fibers each of 1 mm in diameter and surrounded with 1-mm-thick jackets can be several centimeters thick and have limited bending capability. Moreover, optic cables can be damaged more easily than cables carrying electrical current. Longer optical fiber bundles have a greater chance accidentally damaged. Optical fibers with a 1 mm diameter and jacketed to prevent contamination from external light source can be as high as 6.5 $∕m for plastic fibers and even more expensive for silica fibers with better light transmission properties. Depending on the design of the radiation vault, 15–20 m of optical fibers can be necessary to connect each detector to the CCD outside the vault. For a relatively small array of 50 scintillation detectors, this means that the cost for optical fiber alone could reach $6500, which is of the same order as the cost of a CCD camera.
Using lead or other heavy material for shielding can mitigate the impact of stray radiation on CCD cameras. However, it is nearly impossible to completely remove all radiation- induced noise. Complete shielding would surround the camera and could greatly limit its field of view. Moreover, a full shielding would be heavy, cumbersome, and limit the portability of the device.
It is well known that algorithms based on the nonlinear median operation can be used to remove impulse noise from an image.8, 9, 10 Numerous median-based filters of varying complexity and intended purpose exist. However, to the best of our knowledge, no study has looked at the performance of such filters in the context of images obtained by CCD cameras subject to scatter radiation from a medical linac. One study looked at removing noise in cameras used in neutron radiography with a filter based on the Laplacian of Gaussian (LoG) operation.11 The LoG approach can be successfully used in neutron radiography because this imaging modality does not usually contain sharp edges, which is not the case in applications outside neutron radiography. The LoG operation is sensitive to sharp edges and could register them as noises. It is important to study noise in CCD cameras from a medical physics perspective because the end points are different than in other fields, such as space applications. The frequency and amplitude of radiation-induced noise alter the image and with it our ability to extract accurate dosimetric information. Similar reasoning can be applied to filtration algorithms. It is important to find a method of filtration that is suitable for dosimetric applications.
In this paper, we characterize and evaluate the effect of transient noise on images produced by two different CCD cameras, and compare the relative performance of different methods used to filter the resulting noise. The purpose of those filtration methods is to restore image quality to a level sufficient for quantitative analysis of the image. The permanent impact of radiation on a CCD device is outside the scope of this work.
METHODS AND MATERIALS
CCD cameras and experimental setup
Two interline CCD cameras were used in this experiment: the Luca EM (Andor Technology, Windsor, CT) and the U2000 (Apogee Instruments, Roseville, CA). The cameras were chosen for their characteristics (thermoelectric cooling, good dynamic range, and light sensitivity) and affordability (less than $10 000). The Luca produces 14 bit images with dimensions of 658×496 pixels, while the U2000 produces 16 bit images with dimensions of 1600×1200 pixels. The Luca CCD is equipped with the option of electron multiplying. Electron multiplication is achieved through impact ionization in a special gain register placed at the end of the normal serial register.
Noise characterization
Each camera was placed into a radiation vault containing a Varian 2100EX linear accelerator (Varian Medical Systems, Palo Alto, CA) and positioned on a cart placed parallel to the treatment table on the right side at a distance of 2 m from the gantry isocenter.
Images were acquired in four different conditions: (1) with no light and no radiation, (2) with no light and with radiation, (3) with light and with no radiation, and (4) with light and with radiation. In images acquired with no light, the camera was shielded from ambient light by capping the lens and covering the entire camera with an opaque black felt cloth. All images were acquired with a 100 ms acquisition rate. For images with radiation, the linear accelerator was run in 6 MV photon mode at a dose rate of 400 monitor units (MU)∕min. (One monitor unit corresponds to a dose of 1 cGy in water at a depth of 1.5 cm for a field size of 10×10 cm2 at a SSD of 100 cm.) Thermoluminescent dosimeters have been used to estimate the dose received by the camera at this point to approximately 0.2 cGy∕min. For the Luca, acquisition was repeated 20 times for each imaging condition with and without electron multiplying. For the U2000, acquisitions were repeated only ten times because of the larger number of pixels per image. In all cases, the camera was not explicitly shielded from radiation.
The images were imported into IMAGEJ (NIH, Bethesda, MD).12 Histograms of all dark images were created based on pixel intensity. The images acquired under irradiation were characterized for both the number of pixels affected by the irradiation and the intensity distribution of the noise.
Although the permanent effects of radiation exposure to the CCD camera are outside the scope of this paper, it is nonetheless important to ensure that the performance of the cameras is stable throughout the entire study. We have therefore verified that the noise distribution on each camera did not change and that no pixel was permanently affected or damaged by radiation.
Noise filtration
Four different filtering methods were used to remove unwanted noise in image X acquired under irradiation to produce filtered image Y: (1) Temporal median filtering, in which the median value for each pixel is calculated for three consecutive images acquired at times t1, t2, and t3 to produce a new image comprising these median values:
| (1) |
This guarantees that pixel values falling far outside the norm (in this case, transient noise from stray radiation) would be eliminated from the data set. This filter only works, however, in cases in which three or more consecutive images can be obtained under the same conditions. (2) Spatial median filtering, in which the value of each pixel of the original image is replaced by the median value computed over a (2N+1)×(2N+1) square window, WN, to form the filtered image Y:
| (2) |
N values of 1, 2, and 3 were used. Spatial median filtering can result in a loss of spatial resolution when there is a steep gradient in pixel values; therefore, it would be ideal to use as small a value of N as possible. However, if the noise covers a significant portion of the window, the noise will not be filtered out. Thus, there must be a trade-off between spatial resolution and desired degree of noise removal. (3) Switch-median filtering,8 which is an adaptive filter that first identifies pixels that are potential outliers and then replaces only those detected outliers with a filtered value. The median filter is used to generate an image that is subtracted from the original to form a difference image D. This new image is then used to identify outliers. In the difference image, non-noisy pixels have values close to zero and noisy pixels have much higher values. Values above a detection threshold T are replaced by the median of pixels within the window WN, while those within the detection threshold are considered noise free. The filtered image can therefore be expressed as
| (3) |
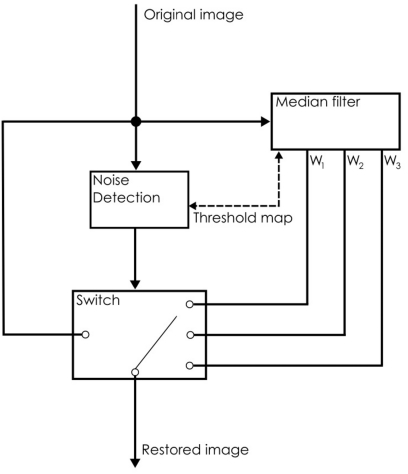
Determining the correct detection threshold value to discriminate between noisy and non-noisy pixels is a key parameter in the success of the noise-filtering algorithm. In our case, the threshold was set to three times the standard deviation of the pixels measured in a radiation free environment. Since very few pixels are replaced, this adaptive filter promises to preserve spatial resolution. (4) Finally, modified switch median filter, which we have developed in an effort to preserve spatial resolution within the images while completely removing the transient noise induced by stray radiation even in the region exposed to bright light. Two modifications to the original switch median filter were implemented. The first modification was to use an algorithm to decide the size of the median window (WN) to use on every noisy pixel. Once the noise detection has been made by using Eq. 3, a binary image containing all pixels for which Di,j is superior to T is produced. A particle analysis algorithm is then run on that image to detect the size (in pixels) of each cluster of noise. The algorithm then replaces each noisy pixel by the median value computed over a window WN according to the size of the noisy cluster. Clusters of sizes 1–4 pixels were filtered using W1; clusters of sizes 5–12 pixels were filtered using W2 window, and more than 12 pixels were filtered using W3. The second modification to the original switch filter is to use a variable threshold that is function of the image brightness. When analyzing the transient radiation noise in dark images, the statistical variation of the non-noisy pixels is low and a small value of T can be used without risk of falsely identifying noisy pixels. However, in an image exposed to light and radiation, the statistical uncertainty of non-noisy pixels can be higher in bright regions and a larger T value must be used to avoid false-positive noise detection. We have characterized the relationship between image brightness and statistical variations for both CCDs. Then, for every noisy image, we established a threshold map of pixels by estimating the standard deviation from the brightness of the median image used for noise detection. The median image was used to measure image brightness because it can be considered noise free, which is obviously not the case of the original image. The modified switch filter is illustrated in Fig. 1. All filtering methods were implemented within IMAGEJ.
Figure 1.
Modified version of the adaptive switch filter originally developed by Sun and Neuvo (Ref. 8).
RESULTS
Noise characterization
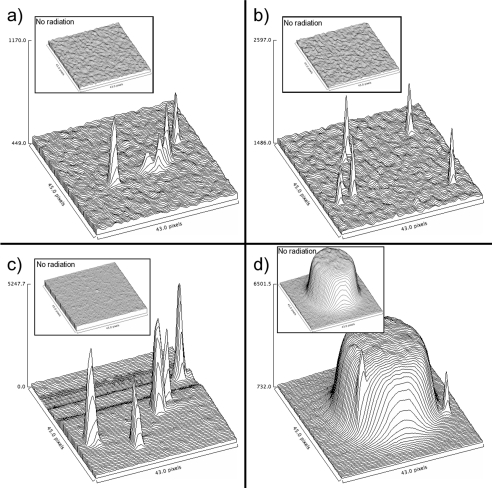
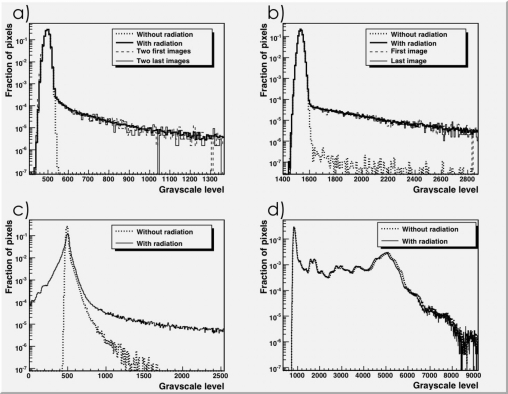
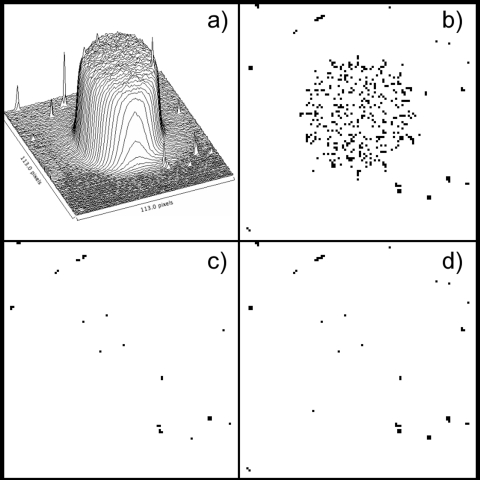
Figure 2 shows sample surface plots of images acquired with and without the presence of stray radiation. Four experimental conditions were used: (1) image acquired with the Luca kept in the dark without electron multiplying [Fig. 2a]; (2) image acquired with the U2000 kept in the dark [Fig. 2b]; (3) image acquired with the Luca kept in the dark with electron multiplying activated [Fig. 2c]; and (4) image acquired with the Luca without electron multiplying in the presence of a low level of ambient light and imaging geometric shapes, such as circles and squares [Fig. 2d]. Figure 3 shows histograms of the intensity values of all the pixels in the images acquired in the same four experimental setups. Figure 2 is not intended to be a complete characterization of radiation-induced noise. Instead, its purpose is to illustrate some key features of the noise observed in each experimental setup. Those features are:
-
(1)
The tendency of the noise in the images acquired with the Luca to appear in clusters, while appearing more frequently in single isolated pixels in the U2000 images.
-
(2)
The higher value of noisy pixels when electron multiplying is used.
-
(3)
The bandlike structures appearing in the background when electron multiplying is used.
-
(4)
The superposition of noise in an image acquired in ambient light.
Both the normal Luca and U2000 dark images showed a quasi-Gaussian distribution in noise typical of CCD cameras [Figs. 3a, 3b]. However, when electron multiplying was turned on within the Luca camera, the dark image no longer followed a Gaussian distribution. Under irradiation, both the Luca and U2000 images showed the same relative shape in the peak, with an increase in the higher pixel values. The structure of the noise differed quite significantly depending on the camera (Fig. 3 and Table 1), which tended to be limited to single pixels with the U2000 (Table 1), while with the Luca, the noise tended to be clustered within a given area, with an average of 3 pixels involved.
Figure 2.
(a)–(c) Dark images acquired with a CCD with and without the presence of stray radiation. (a) Luca, (b) U2000 in normal mode, and (c) Luca in EM mode. Note the structure of the noise due to stray radiation differs depending on camera type and mode of acquisition. (d) Images acquired of an object in ambient light with the Luca in normal mode.
Figure 3.
(a)–(c) Histograms of the dark images acquired with and without the presence of stray radiation. For all dark image acquisitions, the lens cover was placed on the lens and the entire CCD was covered with opaque black felt. The CCD was placed approximately 2 m from the gantry isocenter and the linac was run at a dose rate of 400 MU∕min. (a) Luca in normal mode, (b) U2000, and (c) Luca in electron-multiplying (EM) mode. (d) Histograms of the images exposed to light acquired with the U2000 CCD in normal mode under the same conditions as in (a)–(c) except the CCD was unshielded from ambient light.
Table 1.
Characterization of noise within the dark images due to stray radiation.
| U2000 | Luca | Luca, EM mode | |
|---|---|---|---|
| Noisy pixel probability (%) | 0.19 | 0.27 | 0.39 |
| Noise cluster probability (%) | 0.16 | 0.08 | 0.09 |
| Mean noise cluster size (pixels) | 1.2 | 3.2 | 4.4 |
| Median noise cluster size (pixels) | 1 | 2 | 4 |
| Standard deviation (pixels) | 0.6 | 2.7 | 3.5 |
| Maximum noise cluster size (pixels) | 20 | 47 | 52 |
The noise characteristics of both cameras did not exhibit any changes. This is shown in Figs. 3a, 3b. Noise histograms of the first and last images acquired during irradiation are shown alongside the noise histogram of the whole image series. No variation is seen between the first and last image. The noise distribution was found to be constant throughout this study. In addition, to ascertain that the noise was definitely transient (i.e., no pixel was permanently affected or damaged by radiation), we used a simple method by looking at the maximum pixel value before and after the irradiation. For both cameras, no significant changes in the maximum pixel value before and after irradiation were seen. The Apogee maximum pixel values were 9217 before radiation and 9249 immediately after irradiation. The Luca maximum pixel values were 538 before radiation and 534 immediately after irradiation.
With electron multiplying [Fig. 3c], the Luca images acquired in the presence of stray radiation showed an increase in both lower and higher pixel values, in contradiction with the common hypothesis that radiation noise on a CCD camera is additive in nature. The electron-multiplying amplification also affects noisy pixels. Consequently, the noisy pixels were of higher value than when electron multiplying was not used. Moreover, saturated pixels were seen when electron multiplying was used. Saturated pixels represent 0.09% of all pixels in Fig. 3c, but cannot be seen because the abscissa was truncated for better clarity. No saturated pixels were seen when the electron multiplying is turned off. Stray radiation tended to produce bands of noise due to the internal normalization mechanism of the device, in which the mean pixel value is determined for each line of pixels. The percentage of noisy pixels (Table 1) was also slightly greater with electron multiplying turned on.
Finally, the bright image acquired with the U2000 in ambient light [Fig. 2d] showed a more complex distribution of intensity levels. Because of this complex distribution of intensity levels it is more difficult to differentiate the noisy pixels from the non-noisy pixels by examination of the histograms compared to the case where a dark image was exposed to radiation.
Noise filtering
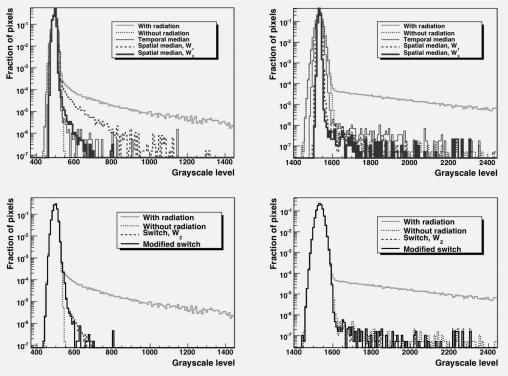
Figure 4 shows the relative fraction of each intensity level in the images acquired in the presence of stray radiation following application of the different filtering methods. Images filtered with both temporal and spatial median filtering [Figs. 4a, 4b] led to a decrease in the high-intensity (i.e., noisy) pixel values. A decrease in the low-intensity peak width relative to the normal dark image was also observed. The standard deviations of the pixel intensity distribution acquired with the Luca [Fig. 4a] were 10.9 and 36.4 gray scale levels for the dark and the irradiated images, respectively. The use of the temporal median filter on the irradiated image reduced the standard deviation to 8.6 gray scale levels. When we applied the spatial median filter on the irradiated image, the standard deviation decreased to 8.4 and 7.3 gray scale levels for the W1 and the W2 median windows, respectively. The standard deviation of filtered images was smaller than the standard deviation of the nonirradiated image, which is consistent with the narrower low-intensity peak seen in Fig. 4b. Overall, both the temporal and W2 spatial median filters produced similar images. The W1 spatial median filter, however, failed to remove all the noise. This is due to the nature of the noise, in which stray radiation on the electronics tends to produce noisy clusters rather than isolated pixels.
Figure 4.
(a), (b) Comparison of histograms following application of the temporal, W1 spatial, and W2 spatial median filter windows to the dark image acquired in the presence of stray radiation. (a) Luca images and (b) U2000 images, (c), (d) Comparison of histograms following application of the W2 switch and modified switch median filter kernels to the dark image acquired in the presence of stray radiation. (c) Luca images and (d) U2000 images.
The three filtering methods led to somewhat similar results for the U2000 images [Fig. 4b]. On the images acquired with the U2000, the standard deviations of the pixel intensity distribution were 16.2 and 95.4 gray scale levels for the dark and the irradiated images, respectively. The standard deviation of the filtered images decreased to 12.5, 7.9, and 6.6, respectively, for the temporal median filter and W1 and W2 spatial median filters.
The spatial and temporal filters affect every pixel of the image. Because of this, images filtered with these techniques are being smoothed. This explains the narrower low-intensity peak in Figs. 4a, 4b. The switch filter uses the same filtration methods as the spatial median filter (i.e., it replaces original pixels with a median value computed over a given window WN). Therefore its efficiency at removing noise is not expected to be better than the spatial median filter. The advantage of the switch filter over the spatial median filter is its capacity to replace only noisy pixels. This explains why there is no loss in peak width in the low intensity region [Figs. 4c, 4d]. The switch filter causes no unnecessary smoothing of the image. The utility of the modified switch median filter is demonstrated in Table 2, which shows that nearly all replacements in the U2000 images were performed with the W1 switch median filter, while a greater number of replacements were made with the W2 and W3 filters on the Luca images.
Table 2.
Evaluation of noisy pixel replacement by modified switch median filter kernel. For the images acquired with the Luca CCD with an image size of 496×658 pixels and 0.27% noisy pixels, approximately 50 pixels were replaced by the 7×7 median values.
| U2000 | Luca | |
|---|---|---|
| % replaced by W1 | 97.4 | 57.0 |
| % replaced by W2 | 2.6 | 37.0 |
| % replaced by W3 | 0.0 | 6.0 |
Using a fixed threshold value to discriminate between noisy and non-noisy pixels led to an increase of false positive or a decrease of true positive, respectively, for a threshold based on either dark or bright pixels. This is illustrated in Fig. 5. The fixed threshold was therefore replaced with a threshold map (Fig. 1). This threshold map was established from the relationship between the mean value of a group of pixels exposed to a uniform amount of light (without radiation) and the standard deviation of that group of pixels. Applying this variable threshold on an image acquired in the presence of ambient light and radiation, 0.4% of the pixels were registered as noise. This value is close to the true fraction of noisy pixels, which is 0.3% according to Table 1. Using a single detection threshold of an intensity level covering 3σ of the range observed in the dark regions, 5% of the pixels were registered as noise. With a detection threshold covering 3σ of the range of the bright regions, 0.07% of the pixels were registered as noise.
Figure 5.
Impact of the threshold selection in the use of a switch filter. (a) The original image. (b) Noise detection with the threshold set to three times the standard deviation of the low-intensity pixels in the periphery of the image. (c) Noise detection with the threshold set to three times the standard deviation of the high-intensity pixels at the center of the image. (d) Noise detection with a variable threshold that is a function of the image brightness.
Application of noise filtration to clinical cases
Thus far, we have presented the performance of each noise filtration scheme from a general perspective. However, because the intended use of these filtration schemes is to restore image quality for quantitative analysis (i.e., dose measurements), it is important to illustrate how the filters perform in a clinical situation. We therefore present three cases to show how the various filtration methods successfully remove noise in clinical applications. Stray radiation can affect an image in a near endless number of ways and for this reason these three cases are not meant as a proof but only as further illustration of the general behavior of each filtration schemes. All cases presented in this section are for images acquired with the Luca CCD, which was chosen because of its higher susceptibility to form noise clusters, therefore making it a more stringent test of the filtration schemes. Each case was selected because it showed a high level of noise.
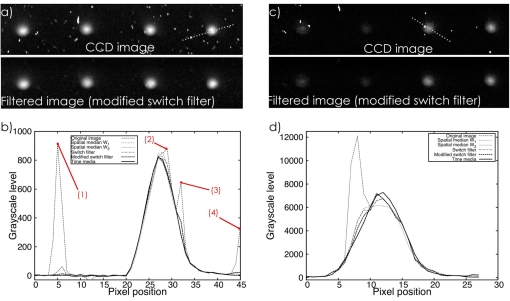
For the first clinical case, an array of four miniature scintillation detectors was imaged. More details on scintillation detector arrays and how they are used can be found in our previous work.1, 13 The camera was placed 2 m from the isocenter. Images were acquired over a 5 s period. No electron multiplying was used and the spot intensities produced by the detectors on the CCD images were usually less than 1000 gray scale levels. Figure 6a shows two versions of the same image: the original CCD image containing the four light spots produced by the miniature scintillation detectors and the image filtered by the modified switch filter. Integrating the value of all pixels within a region of interest covering each light spot gives the total amount of light produced by each single miniature scintillation detector. In order to illustrate better the effect of each noise filter we show the profile of the fourth light spot in Fig. 6b. Figure 6b also shows the same profile after using each of the filtration methods. As previously noted, the temporal median filter is the best filtration method. The four other filters successfully remove noise clusters 3 and 4. However, the W1 spatial median filter and the switch filter fail to completely remove noise clusters 1 and 2. In this particular case, measuring the integral value of the light spots (as required in dose measurement) without applying any correction results in an overestimation of 10% in the total light output of the plastic scintillator relative to the light output value obtained after using the temporal median filter. Using the W1 spatial median filter, the switch filter, or the modified switch filter the light output value is underestimated by less than 2% compared to the temporal median filter. The light output value of the spot filtered with the W2 spatial median filter results in an underestimation of 10%, which makes the filter unsuitable for clinical use.
Figure 6.
Application of noise filtration schemes for two clinical cases. The Luca CCD was used to measure the light spot produced by miniature scintillation detectors. (a) Image obtained from the CCD camera with and without filtration of a miniature scintillation detector light spot on an image acquired without electron multiplying over a 5 s period. (b) Profile of the fourth light spot shown in (a). (c) Image obtained from the CCD camera with and without filtration of a miniature scintillation detector light spot on an image acquired with electron multiplying over a 500 ms period. (d) Profile of the third light spot shown in (c).
In the second clinical case, similar dose detectors were used, but the integration time was reduced to 500 ms and electron multiplying was used. As with the first clinical case, Fig. 6c shows the raw CCD image containing the four light spots produced by the scintillation detectors and the image after the use of the modified switch filter. A profile of the third light spot is shown in Fig. 6d. This light spot was chosen because a bright noise cluster affects it. The temporal median filter and the modified switch filter produce the best filtration of the noise cluster. However, even if the temporal median filter produces a good profile, it also affects the image in regions where no noise is seen. For example, the right part of the profile has higher values than the original image even though this part of the profile is noise free. This occurs because the temporal median filter is using data from other images to produce the filtered image. In this specific case, we could argue that the modified switch filter produces the optimal results because it exactly matches the original image in the absence of noise.
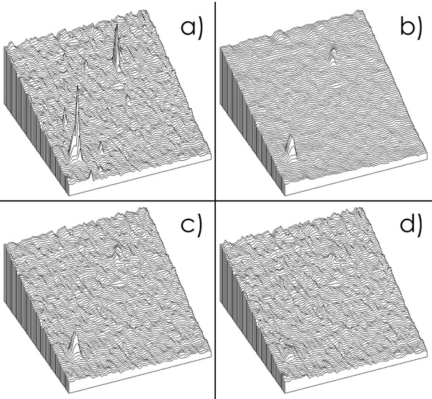
Finally, the third clinical case was obtained by taking two-dimensional images of a volume of liquid scintillator irradiated with a 7 MeV electron beam. In this case the integration time was 100 ms, and electron multiplying was not used. We present this case to illustrate that noise filtration schemes can be used in other areas than miniature scintillation detectors. Figure 7a shows the original image; Fig. 7b shows the image after the spatial median filter (W1) is applied. While this filter reduces the amplitude of the noise it also smooths the image. Figure 7c shows the image after the switch filter is applied. This filter removes most of the noise but, because it is limited to a single window size, it cannot completely remove the largest noise cluster. Moreover, a close inspection of Fig. 7c reveals that some smoothing occurs in the non-noisy parts of the image; this is due to the use of a single threshold in the noise detection. Figure 7d shows the image after the modified switch filter is applied. It can be seen that the modified switch filter offers the best performance both for noise filtration and for preservation of the original image value in regions not affected by noise.
Figure 7.
Application of noise filtration schemes on a two-dimensional image of a volume of liquid scintillator irradiated with a 7 MeV electron beam. The acquisition time was 100 ms. A region of 70×70 pixels is shown.
DISCUSSION
The noise produced in two different CCD cameras had similar spectra, but there was a difference in the spatial distribution of the noisy pixels. In one of the cameras the pixels affected by scattered radiation were isolated noisy pixels, while in the other camera the noisy pixels tended to appear in small clusters. Differences in noise could be explained by differences in pixel size, differences in the thickness of the silicon in the CCD chip, or by differences in the wiring of each pixel. The Luca camera has a pixel surface about twice the size of the U2000 camera (10×10 vs 7.4×7.4 μm2), which could explain in part the highest probability of the Luca producing noisy pixels. However, a thorough explanation of the noise difference between the two models would require in depth knowledge of their respective architecture.
Different types of filters were tested on the images produced by each camera. Optimal results were obtained by using a temporal median filter. While this type of filter is simple and easily implemented, it requires a time series of identical, or nearly identical images, which may not be practical in many situations where time-varying images are acquired. When a temporal median filter is impractical, a spatial median filter can be used. We have filtered images by computing the median of each pixel over a window, WN. This uniform spatial median filtering is not as efficient as temporal filtering. It can provide adequate removal of impulse noise, but noise-free information is distorted by the median operation, especially if a large median window is used. To circumvent this alteration of non-noisy pixels, we have used adaptive filtering based on the switch filter developed by Sun and Neuvo,8 which affects only noisy pixels, leaving most of the image unaltered. The switch filter worked properly when the noise appeared as isolated pixels, but could not remove all noise when it appeared as clusters of pixels.
The removal of noisy clusters and the need for adequate definition of the threshold, T, requiring discrimination between noisy and normal pixels are two of the shortcomings of switch-based adaptive filters. Several variations of this filter exist in the literature using techniques such as weighed median9 or fuzzy logic,10 but none of these filters has been specifically designed to remove transient noise produced by stray radiation from a linac. We have modified the switching mechanism of the original adaptive switch filter to improve its performance when dealing with radiation-induced noise. Different models of CCD cameras can be affected by noise in different ways. This difference was seen when we characterized the noise in the U2000 and Luca cameras. The modified switch filter we have developed has been shown to be sufficiently versatile and could be used to filter noise produced by any of the two models of CCDs tested as well as other CCD cameras frequently used in radiotherapy.
CONCLUSION
CCDs have found many applications in radiation therapy. They are especially valuable for quantitative assessment of visible light such as that produced by scintillators. However, CCDs are subject to radiation-induced noise. For a pixel affected by this transient noise, its amplitude can be orders of magnitude higher than the actual information it would contain in the absence of noise. Therefore, only a few of those noisy pixels in a region of interest can affect the results by several percent. For this reason, radiation noise must be filtered out before any quantitative analysis can be performed on the image. In this work, we have characterized radiation-induced noise and compared the efficiency of four types of noise filters. We conclude that if a time series of images can be acquired, then the temporal median filter should be used. However, in many situations, it is not possible to obtain a time series of nearly identical images. For these cases, we have found that the modified version of the adaptive switch filter8 should be used to remove transient radiation-induced noise effectively for both isolated and clustered noise pixels while leaving intact all non-noisy pixels. Both the temporal median filter and the modified switch filter have been shown to restore image quality to a level sufficient for extracting quantitative information for dosimtetric applications. Those filters could also be used in other, qualitative applications of CCD cameras such as patient monitoring.
ACKNOWLEDGMENTS
This research was supported by the National Cancer Institute (NCI) Grant No. 1R01CA120198-01A2. L.A. was supported in part by the Odyssey program and the Houston Endowment, Inc. Award for Scientific Achievement at The University of Texas M. D. Anderson Cancer Center.
References
- Archambault L., Beddar A. S., Gingras L., Lacroix F. D., Roy R., and Beaulieu L., “Water-equivalent dosimeter array for small-field external beam radiotherapy,” Med. Phys. 10.1118/1.2719363 34, 1583–1592 (2007). [DOI] [PubMed] [Google Scholar]
- Boon S. N., van Luijk P., Schippers J. M., Meertens H., Denis J. M., Vynckier S., Medin J., and Grusell E., “Fast 2D phantom dosimetry for scanning proton beams,” Med. Phys. 10.1118/1.598221 25, 464–475 (1998). [DOI] [PubMed] [Google Scholar]
- Kirov A. S., Piao J. Z., Mathur N. K., Miller T. R., Devic S., Trichter S., Zaider M., Soares C. G., and LoSasso T., “The three-dimensional scintillation dosimetry method: Test for a 106Ru eye plaque applicator,” Phys. Med. Biol. 10.1088/0031-9155/50/13/007 50, 3063–3081 (2005). [DOI] [PubMed] [Google Scholar]
- Petric M. P., Robar J. L., and Clark B. G., “Development and characterization of a tissue equivalent plastic scintillator based dosimetry system,” Med. Phys. 10.1118/1.2140118 33, 96–105 (2006). [DOI] [PubMed] [Google Scholar]
- Beddar A. S., Mackie T. R., and Attix F. H., “Water-equivalent plastic scintillation detectors for high-energy beam dosimetry. II. Properties and measurements,” Phys. Med. Biol. 10.1088/0031-9155/37/10/007 37, 1901–1913 (1992). [DOI] [PubMed] [Google Scholar]
- Beddar A. S., “Plastic scintillation dosimetry and its application in radiotherapy,” Radiat. Meas. 41, S124–S133 (2007). [Google Scholar]
- Archambault L., Arsenault J., Gingras L., Beddar A. S., Roy R., and Beaulieu L., “Plastic scintillation dosimetry: Optimal selection of scintillating fibers and scintillators,” Med. Phys. 10.1118/1.1943807 32, 2271–2278 (2005). [DOI] [PubMed] [Google Scholar]
- Sun T. and Neuvo Y., “Detail-preserving median based filters in image processing,” Pattern Recogn. Lett. 10.1016/0167-8655(94)90082-5 15, 341–347 (1994). [DOI] [Google Scholar]
- Chen T. and Hong Ren W., “Adaptive impulse detection using center-weighted median filters,” IEEE Signal Process. Lett. 10.1109/97.889633 8, 1–3 (2001). [DOI] [Google Scholar]
- How-Lung E. and Kai-Kuang M., “Noise adaptive soft-switching median filter,” IEEE Trans. Image Process. 10.1109/83.902289 10, 242–251 (2001). [DOI] [PubMed] [Google Scholar]
- Li H., Schillinger B., Calzada E., Yinong L., and Muehlbauer M., “An adaptive algorithm for gamma spots removal in CCD-based neutron radiography and tomography,” Nucl. Instrum. Methods Phys. Res. A 564, 405–413 (2006). [Google Scholar]
- Abramoff M. D., Magelhaes P. J., and Ram S. J., “Image processing with ImageJ,” Biophotonics Int. 11, 36–42 (2004). [Google Scholar]
- Lacroix F., Archambault L., Gingras L., Guillot M., Beddar S., and Beaulieu L., “Clinical prototype of a plastic water-equivalent scintillating fiber dosimeter array for QA applications,” Med. Phys. 10.1118/1.2953564 35, 3682–3690 (2008). [DOI] [PubMed] [Google Scholar]


