Abstract
The purpose of this work is to develop a novel feature-based registration strategy to automatically map the rectal contours from planning computed tomography (CT) (pCT) to cone beam CT (CBCT). The rectal contours were manually outlined on the pCT. A narrow band with the outlined contour as its interior surface was then constructed, so that we can exclude the volume inside the rectum in the registration process. The corresponding contour in the CBCT was found by using a feature-based registration algorithm, which consists of two steps: (1) automatically searching for control points in the pCT and CBCT based on the features of the surrounding tissue and matching the homologous control points using the scale invariance feature transformation; and (2) using the control points for a thin plate spline transformation to warp the narrow band and mapping the corresponding contours from pCT to CBCT. The proposed contour propagation technique is applied to digital phantoms and clinical cases and, in all cases, the contour mapping results are found to be clinically acceptable. For clinical cases, the method yielded satisfactory results even when there were significant rectal content changes between the pCT and CBCT scans. As a consequence, the accordance between the rectal volumes after deformable registration and the manually segmented rectum was found to be more than 90%. The proposed technique provides a powerful tool for adaptive radiotherapy of prostate, rectal, and gynecological cancers in the future.
Keywords: image guided radiation therapy (IGRT), image registration, deformable model, segmentation, scale invariance feature transformation (SIFT)
INTRODUCTION
Patients treated with radiotherapy for cancers such as prostate, rectal, and gynecological cancers experience large day-to-day changes in their rectal volumes due to motion, distention, and filling. Due to variations in the image content, an exact correspondence between two image sets acquired at different time points may not exist. Thus, any deformable model relying on the use of information contained in the entire image may not be adequate in dealing with these patients. The artifacts-induced disjoint between the images also makes the autopropagation of contours outlined in one set of images to another highly difficult with conventional strategies. With continued enthusiasm for adaptive radiotherapy, the ability to reliably and efficiently map the rectum outlined in the planning computed tomography (CT) (pCT) to the on-treatment cone beam CT (CBCT) images now becomes a bottleneck and needs to be resolved in order for many patients with cancer within the pelvis to benefit from the novel adaptive replanning strategy.1, 2
The issue of rectal motion and deformation in conformal radiation therapy is described in various publications. Lee et al. evaluated the CBCT as a tool to quantify the accuracy and precision of a simulated IMRT treatment delivery model for rectal cancer when rectal motion due to filling and deformation was taken into account.3 The mean deformation variation of 0.71 and 0.94 cm in the LAT and AP directions was reported. Foskey et al. shrank the rectal gas region to a virtual point in order to make the correspondence of the rectal volumes in two sets of images.4 Gao et al. used an automatic image intensity modification procedure to create artificial gas pockets in the pCT images.5 The major drawbacks of these types of approaches are the artificial introduction of image features within the rectal volume and the potentially inaccurate association of the artificial image features. As a consequence, the accordance between the rectal volumes after deformable registration and the manually segmented rectum was found to be less than 80%.
In this work, we propose to use the image information in the neighborhood outside the rectal wall as the driving force to guide the rectal contour propagation from the pCT to CBCT. Because the content in the region outside the rectal wall should be conserved, regardless of any changes in the rectal filling and distension, this strategy seems to be physically sensible. Coupled with a powerful feature-based deformable registration model, which identifies homologous tissue features shared by the pCT and CBCT images, the novel approach captures the key issues of the system and provides a natural solution to the above stated problem. Application of the proposed algorithm to a number of digital phantoms and clinical cases demonstrates that the technique is accurate and robust and may be useful for future adaptive therapy planning.
METHODS AND MATERIALS
Software platform
The proposed contour mapping algorithm was implemented using the Insight Toolkit6 and the Visualization Toolkit (VTK),7 which are open source cross-platform C++ software toolkits sponsored by the National Library of Medicine. They are freely available for research purposes (see Refs. 34, 35). ITK provides various basic algorithms to perform registration and segmentation for medical images. The programs contained in ITK are highly extendable, making it an ideal platform for development of image registration and processing techniques. VTK is primarily used for image visualization (including contours).
Narrow band construction
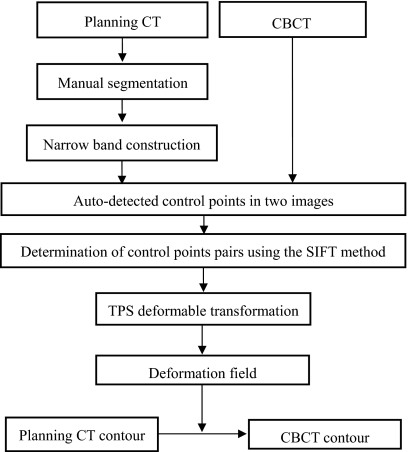
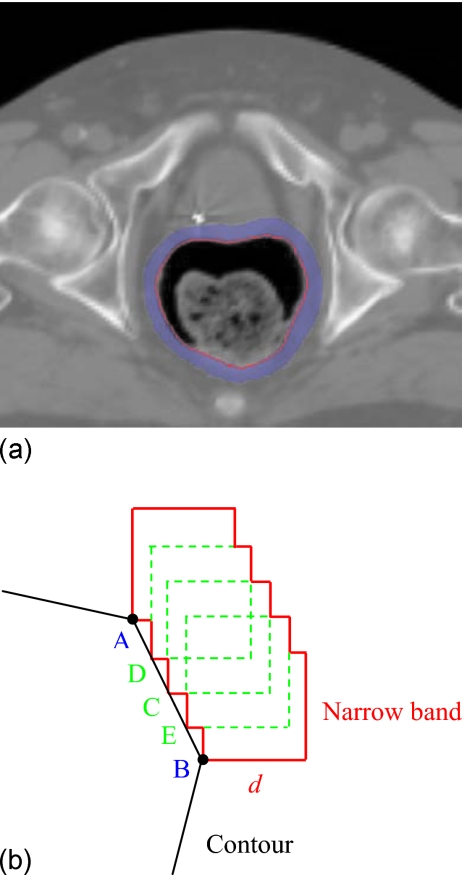
Inconsistency in rectal contents between two input image sets could severely reduce the performance of a deformable registration algorithm. Coregistering an empty rectum without bowel gas to a rectum filled with bowel gas using any deformable model could be problematic, for example. A natural strategy is to exclude the volume inside the rectal wall. In practice, the template rectal contour in the pCT image has been manually contoured as a part of the routine treatment planning process, thus making it a straightforward matter to exclude the volume inside the rectal wall. Figure 1 shows the proposed contour mapping process. After manual segmentation on the pCT, a narrow band as sketched in Fig. 2 is constructed with the manually segmented rectum representing the inner surface of the band. On an axial slice, the contour has a polygon shape and the vertices of the polygon form the basis for constructing the narrow band. The distance between the neighboring vertices on the contour is typically 2–10 mm depending on the shape of the contour. In generating the narrow band, we first create squares with side length of d for each vertex, as depicted by points A and B in Fig. 2b. In order to obtain a smooth band, between A and B three more squares, cornered at points C, D, and E, are inserted. Point C is chosen to be the middle point between A and B. Point D is the point between A and C, and point E is the point between B and C. More interpolated vertex points can be similarly introduced to obtain a smooth band. The principle of the narrow band diameter selection is to exclude most bony structures outside the narrow band, since the bony structures are rigid and heavily affect the control point selection. Meanwhile, the generated narrow band can capture sufficient information to drive the finding of its counterpart in the subsequent CBCT. In general, the size of the squares is therefore within 1 cm, so that the diameter of the narrow band is within 1.5 cm.
Figure 1.
Overall process of rectal contour propagation.
Figure 2.
A sketch of narrow band. (a) A narrow band image surrounding a manually segmented rectal contour and (b) a narrow band construction is illustrated for two vertex points A and B.
The narrow band in our approach is used as a compact representation of the rectal surface. As will be detailed in the next subsection, a feature-based deformable registration algorithm is employed to find the correspondence of the band in the CBCT images. Upon successful registration, the deformation field is utilized to propagate the pCT contour to the CBCT. Because only the image features outside the rectum are used, a narrow band shown in Fig. 2 permits us to take advantage of the regional information inside the narrow band yet avoiding the nuisance of rectum∕bladder filling.
Feature-based warping of the narrow band
As illustrated in Fig. 1, the process of contour mapping is to warp the narrow band constructed above in such a way that its best match in the CBCT images is found. Mathematically, this constitutes an optimization problem, in which a group of transformation parameters transform the points within the band in the pCT to their corresponding points in the CBCT. The input to the contour mapping software includes the narrow band and the CBCT images, which are described by the image intensity distributions Ia(x) and Ib(x), respectively.
To find the transformation matrix, T(x), that maps an arbitrary point in the band to the corresponding point in the CBCT images (or vice versa), a thin plate spline (TPS) deformable model is employed. But other models should also be applicable to model the deformation of the band. We automates the control point selection by using the scale invariance feature transformation (SIFT) tissue feature searching (see next subsection for details). Roughly, 300 control points are selected based on the prominent tissue features.
The detailed description of the TPS transformation can be found in Ref. 8. For two-dimensional (2D) images, a weighting vector W=(w1,w2,…,wn) and the coefficients a1,au,av are computed from a series of matrices which are constructed using n pairs of selected control points in the fixed image (xi,yi) and in the moving image (ui,vi), respectively. The function transforming a pixel coordinate in the moving image to a new coordinate in the fixed image is defined as
| (1) |
where pi is the control points coordinate in the fixed image and U is a basis function to measure the distance.
SIFT
The feature-based deformable registration is an essential part of the proposed contour mapping process. Here, we automate the control point selection by using the SIFT-based tissue feature searching. Because of the efficient use ofa priori system knowledge, the approach greatly enhances the robustness of the narrow band warping algorithm.
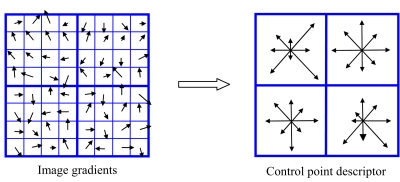
The SIFT method was introduced by Lowe to characterize the local tissue features. The method utilizes both image intensity and local gradient information to characterize the neighborhood property of a point.9 The algorithm includes scale-space extrema detection, control point localization, orientation assignment, and control point descriptor. In 2D cases, for example, the method uses the orientation histograms of the four quadrants surrounding a point (containing 64 pixels) to characterize the inherent tissue feature of the point (see Fig. 3). To obtain the histogram for a quadrant, as illustrated in Fig. 3, the gradient of each of the 16 pixels in a quadrant is computed. An eight-bin histogram, with first bin representing the number of pixels whose gradients fall between 0° and 45°, and so forth, is then constructed. For illustration, the histogram of each of the four quadrants is displayed schematically in the right panel of Fig. 3 as an eight-vector plot. In total, 32 vectors are calculated in 2D case. In extending the SIFT method from 2D to three dimensional (3D), total of 192 vectors are needed. These vectors represent the local feature and serve as a signature of the point. The SIFT descriptor is considered as one of the most effective descriptors currently available.10, 11
Figure 3.
A sketch of orientation histogram in SIFT method. The gradient of each of the 16 pixels in a quadrant is computed. An eight-bin histogram, with first bin representing the number of pixels whose gradients fall between 0° and 45°, and so forth, is then constructed. The histogram of each of the four quadrants is displayed schematically in the right panel as an eight-vector plot.
Theoretically, the SIFT descriptor can be computed for each voxel in an image. However, this is computationally expensive. The commonly used sampling strategy is to compute the descriptor every 2–3 voxels in x, y, and z directions. After the SIFT descriptors are computed in both input images, the points having the most similar SIFT descriptors in the two images are then identified. For a given point, indexed by n, in the pCT image, the least-squares difference of the SIFT descriptor of the point and that of a potential association point n′ in the CBCT, Sn,n′, is first computed according to
| (2) |
where I represents the image intensity. α indexes the bins of the SIFT histogram of a point and the summation over α runs from 1 to 32 for the 2D case, and 1 to 192 for the 3D case. Typically, about 1000 SIFT descriptors n,n′ are computed in the narrow band in the pCT and CBCT, respectively. It is unnecessary to determine Sn,n′ for all possible combinations n,n′, which may dramatically increase the calculation time. We use a specific search radius to control the number of Sn,n′ calculation. The mapping results are more accurate with larger search radius, however, the calculation time of SIFT mapping becomes longer. After Sn,n′ is computed, two points and that have the least histogram difference with point n are identified. If the ratio (for convenience, the ratio is referred to as the κ ratio hereafter) of these two values is less than 80%, the point that has the least S value is chosen tentatively as the correspondence of the point n, otherwise, no association is made for the point. The κ ratio varies between 0 and 1 and is an empirical measure of feature correspondence between two images. The lower the κ ratio, the “stronger” the association of the two feature points on pCT and CBCT. Because of the inherent difference in the textures of the involved organs, the determination of the κ ratio may be organ specific. Typically, it is determined by a tradeoff between the number of associated point pairs and the reliability of the associations. For a bone, the feature is clear and hundreds point pairs can be associated under a threshold of 50%. On the other hand, for the rectum, the feature is not as obvious as bone. If we still use this low κ ratio, the number of association pairs may be very limited. In this situation, a higher threshold, say 80%, is usually used to increase the number of associated point pairs.
To further increase the accuracy of feature point association, a bidirectional mapping strategy is developed based on the fact that if a point in the pCT is mapped correctly to the CBCT, it will be default to be mapped back to the original point in the pCT when an inverse map is applied to the corresponding point in the CBCT. Therefore, after the original association of feature points as described above, the mapped points in CBCT are inversely coregistered to the pCT. If the correspondence still exists, the associated point pair is labeled a match. Otherwise, they are considered as a mismatch and deleted from the list of correspondence points. Upon the association of the feature points, the associated points are employed as control points. The control point in pCT and CBCT corresponds each other, thus the numbers of control points in the two input images are the same. It was noticed that, when the CBCT region of interest (ROI) is expanded, the increase of feature point generation does not affect the control point association and final contour mapping. The coordinates of an arbitrary point on the contour in CBCT are obtained by interpolating the displacement vectors of the control points using TPS transformation after the control point association is established.
Evaluation of the models using digital phantom and existing patient data
The performance of the above model is evaluated by a number of 2D digital phantoms and archived clinical cases. In the digital phantom experiments, two deformations are introduced. A virtue of this approach is that the “ground truth” solutions exist and the transformation matrices are known, thus making the evaluation straightforward. The mathematical transformations used to deform the phantom are generated using a formula12
| (3) |
| (4) |
Here, θ=tan−1y∕x. Two parameters, m and b, are used to characterize a deformation. Generally, they describe the complexity and magnitude of a deformation, respectively. The contour outlined in the original image is then mapped to the deformed image. The accuracy of the contour mapping calculation is assessed by comparing directly with the deformable mapping from the known transformation matrix.
Contour propagation from pCT to CBCT is studied by using three prostate cancer patients and two rectal cancer cases. The pCT is acquired with a GE Discovery-ST CT scanner (GE Medical System, Milwaukee, WI) approximately two weeks prior to the initiation of the radiotherapy. The on-treatment CBCT images are acquired using the Varian Trilogy™ (Varian Medical Systems, Palo Alto, CA). Each slice of pCT or CBCT is discretized into 512×512 voxels. The images are transferred through DICOM to a high-performance personal computer with a Xeon (3.6 GHz) processor for image processing. The manually outlined contours in the pCT images are mapped to CBCT images using the proposed technique. For the cases studied here, the accordance between the rectal volumes after deformable registration and the manually segmented rectum is employed to assess the success of the proposed algorithm.
To quantitatively evaluate the result of contour propagation, the accordance value between the automapped contour and manually outlined contours were calculated. In general, suppose A and B are two contours, the accordance value r is defined as
| (5) |
here, V is the containing volume of A or B.
RESULTS
2D digital phantom experiment
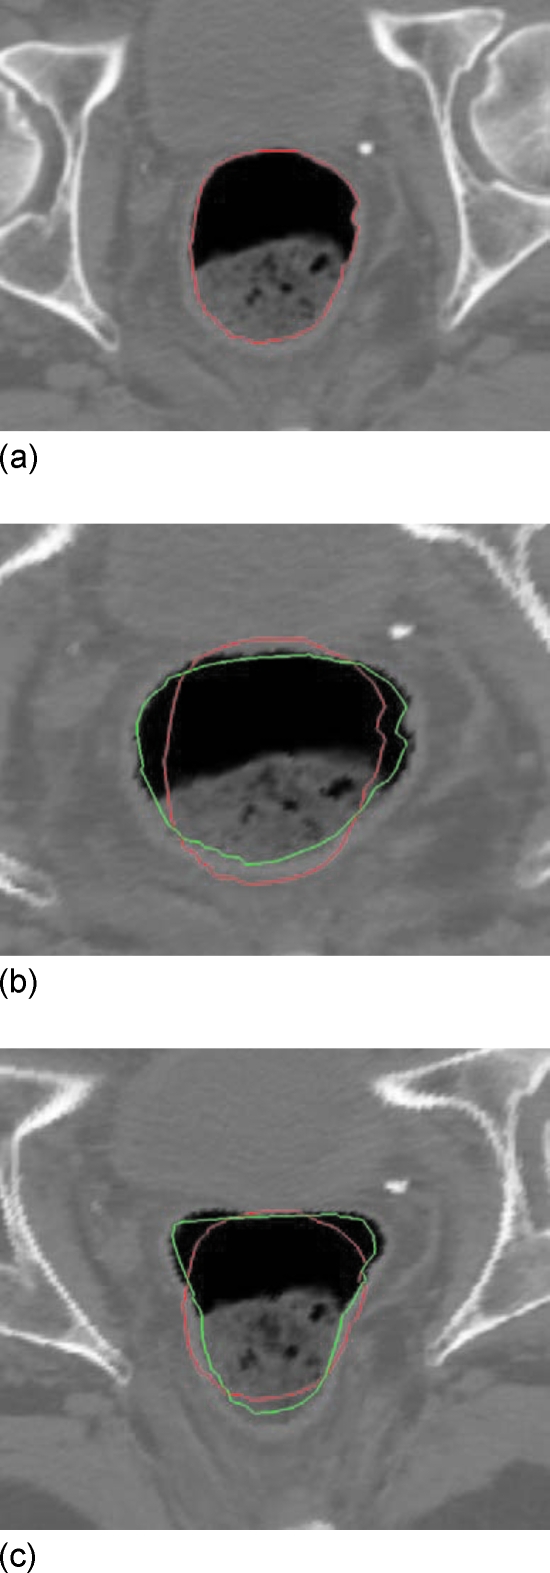
The proposed algorithm is first tested using a 2D digital phantom [Fig. 4a] with two intentionally introduced deformations of the image shown in Figs. 4b, 4c, respectively. The rectal contour is manually outlined and shown in Fig. 4a. The deformation shown in Figs. 4b, 4c are obtained by setting the parameters b and m in Eqs. 3, 4 to (b=2, m=2) and (b=2, m=3), respectively. The curves close to the interior surface of the rectum in Figs. 4b, 4c represent the automapped contour. For comparison, the original contour in Fig. 4a is also mapped rigidly to Figs. 4b, 4c. Overall, the mapped contours can capture the main features of the two dramatic deformations, and conform to the boundary of the rectum in both cases.
Figure 4.
Rectal contour propagation from the 2D pCT slice to two dramatically deformed images. (a) Original contour, (b) and; (c) its optimal mapping in the two deformed images.
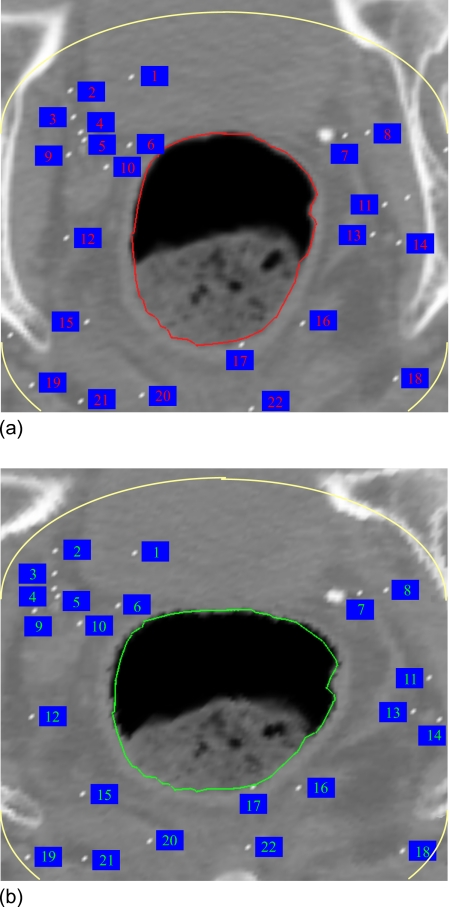
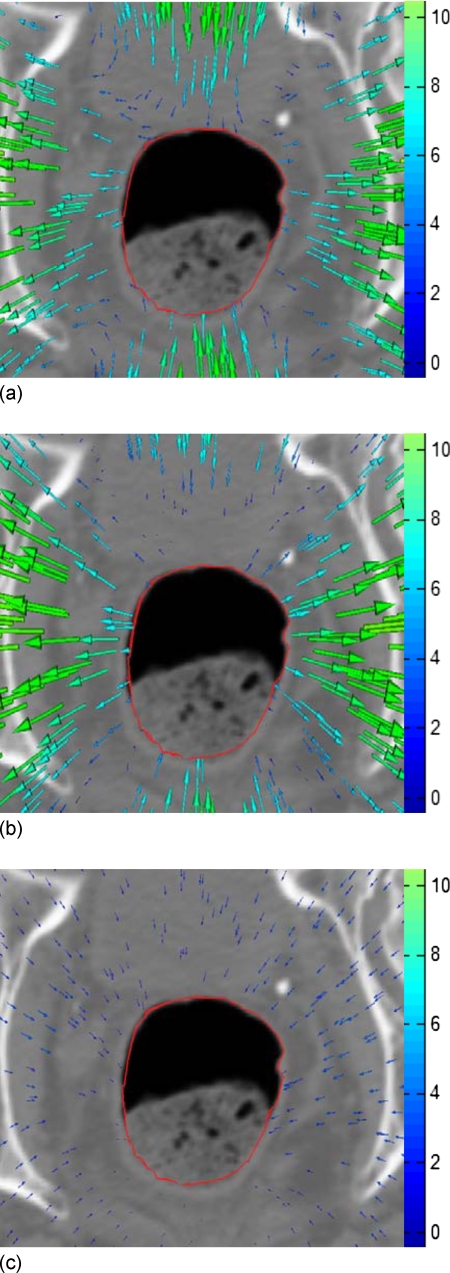
In obtaining the result shown in Fig. 4b, a total of 200 control points were identified by the bidirectional SIFT calculation as described in method. Note that the bony structure in the image has been excluded in this calculation by setting an intensity threshold of 300 CT number. In this way, any unphysical bony structure deformation is avoided. For clarity, a selection of the SIFT-identified control point associations are displayed in Fig. 5. The superior contour represents the superior surface of narrow band. The total number of control points identified here are far more than that commonly used in TPS calculation,13 allowing an improved deformable warping of the narrow band. We should notice that the control points 2, 3, 4, 5, and 9 in Fig. 5 are relatively far away from the rectum wall compared to control points 6 and 10. Since the TPS interpolation is used after SIFT mapping, every control point including points 2, 3, 4, 5, and 9 will affect the deformable warping and therefore the contour shape, although the weights of points 2, 3, 4, 5, and 9 are smaller than points 6 and 10. The displacement field derived by using TPS method is shown in Fig. 6a. For comparison, the known displacement field from Eqs. 3, 4 is plotted in Fig. 6b. The subtraction between the TPS-derived displacement field and the known field is shown in Fig. 6c. It is found that the average deviation of the SIFT-TPS displacement from the known solution is less than 1.2 mm.
Figure 5.
Control points in the 2D contour mapping.
Figure 6.
Displacement fields. (a) TPS-derived displacement field for the 2D digital phantom study; (b) intentionally introduced displacement field; and (c) subtraction of TPS derived and the known displacement fields.
Clinical case study
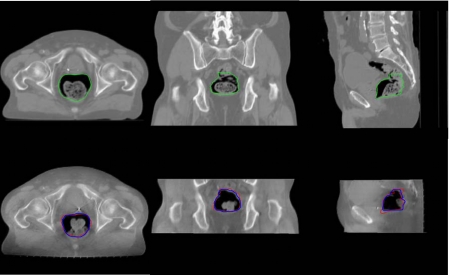
The contour propagation study from pCT to CBCT for the first prostate case is presented in Fig. 7. The top row shows the pCT image with manually outlined contours. The automapped contours overlaid on the CBCT are displayed in the bottom row. For comparison, the manually outlined contours on the CBCT are also plotted in the bottom row. As mentioned in Sec. 1, the propagation of rectum wall is often complicated by the fact that the physical one-to-one correspondence may not exist due to the addition or subtraction of some contents within the rectum. Figure 8 exemplifies this and shows that the rectal filling at the time of CBCT acquisition is quite different from that of pCT. As can be intuitively conceived, this image content change could severely reduce the performance of a conventional deformable registration.14 The narrow band approach described in this work circumvents the problem by excluding the rectal volume affected by the rectum∕bladder filling. Accuracy was evaluated by comparison with manually outlined contours on the CBCTs.15, 16, 17 It is clear that the mapped contours closely conform to the rectal wall change. The accordance between the rectal volume extended by the automapped contour and the manually segmented rectal volume was found to be more than 90%.
Figure 7.
3D contour mapping for the rectum of a man with prostate cancer. The top row is the three transactions in the planning CT image, the bottom row is corresponding transactions in the CBCT image. The left column is the axial plane, the middle column is the coronal plane, and the right column is the sagittal plane.
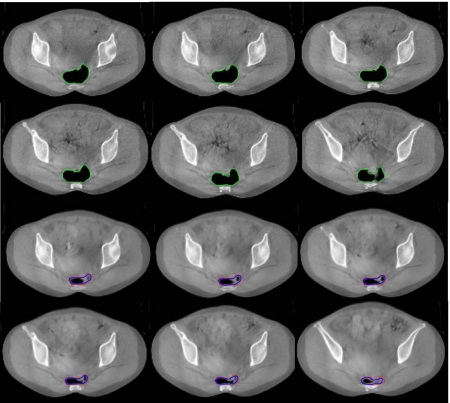
Figure 8.
Rectal contour mapping for a rectal cancer case. The first and second rows show six axial slices in the pCT image. The third and fourth rows are the corresponding slices in the CBCT image.
In practice, rectal volume motion and deformation can cause large uncertainties pertaining to the adequacy of actual dose delivered to the gross tumor volume as well as to the surrounding normal structures. This issue has been a major obstacle in the implementation of IMRT in rectal cancer. In Fig. 8 six axial pCT and CBCT images of a rectal cancer patient acquired in an interval of two weeks are shown. Large target volume motion and deformation are observed from Fig. 8. The rectal volume in the pCT is found to be three times more than that of the rectal volume in the CBCT and thus represents a challenging situation for any deformable model. The rectal contours are manually outlined in the pCT and mapped to the subsequent CBCT using the proposed method. The first and second rows of Fig. 8 show six axial slices of the pCT with manually outlined contours. The results of contour propagation from the pCT to the CBCT are shown in the third and fourth rows of Fig. 8. As the same as in Fig. 7 the manually outlined contours on the CBCT are also plotted. The accordance between the rectal volume extended by the automapped contours and the manually segmented rectal volume was found to be more than 95%. The rectal deformations in Fig. 8 are quite large and thus present challenges to any deformable model or contour mapping technique. It is impressive that a simple approach with a narrow band and SIFT descriptor can capture the main feature of the rectal contour and help to find the correspondence contours in the CBCT images.
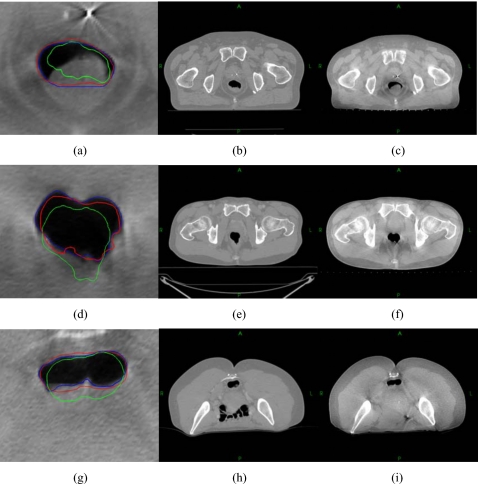
To further examine the performance of the proposed technique, the method was also applied to three additional patients (Fig. 9). The automapped contours are plotted together with the manually outlined contour on the CBCT. For comparison, the original contours on pCT are also mapped rigidly to the CBCT. The accordance values between the pCT and CBCT contours, as well as between the automapped and manually segmented CBCT contours for these three patients are listed in Table 1. In these cases, the accordance values are increased from around 75% to over 90% after contour mapping. The influence of the κ ratio on the contour propagation is illustrated by the data listed in Table 2, where the accordance values for a few different κ ratios for the three patients are shown. The accordance reached its peak value when the κ ratio is between 0.8 and 0.9 for all these three cases. When the κ ratio is lower than 0.8, the accordance decreases with the decrease of the κ ratio because less control points are selected. The accordance also decreases with the increase of the κ ratio for the κ ratio higher than 0.9. The accordance value is stable for κ ratios between 0.8 and 0.9. The data also indicate that the κ ratio is generally organ specific and is insensitive for different patients.
Figure 9.
Automatic contour propagation for three additional patients.
Table 1.
Accordance values between the pCT and CBCT contours, as well as between the auto-mapped and manually segmented CBCT contours for three patients.
| Patient 1 | Patient 2 | Patient 3 | |
|---|---|---|---|
| Accordance values between pCT and CBCT contours (%) | 73.7 | 76.5 | 76.3 |
| Accordance values between auto-mapped and manually segmented CBCT contours (%) | 93.3 | 91.3 | 91.4 |
Table 2.
Accordance values between the auto-mapped and manually segmented CBCT contours for different κ-ratios for three patients.
| κ ratio | 0.7 | 0.75 | 0.8 | 0.85 | 0.9 | 0.95 |
|---|---|---|---|---|---|---|
| Patient 1 (%) | 81.5 | 88.4 | 91.6 | 92.6 | 93.3 | 82.9 |
| Patient 2 (%) | 76.3 | 82.1 | 91.3 | 88.9 | 85.8 | 79.1 |
| Patient 3 (%) | 67.5 | 86.6 | 88.3 | 88.4 | 91.4 | 62.6 |
DISCUSSION
In this work, an effective feature-based rectal contour mapping algorithm has been described. An indispensable step toward online or offline adaptive replanning with consideration of the patient’s dose delivery history and on-treatment anatomy is the expedite organ segmentation of CBCT images. While this task is, in principle, achievable using deformable registration of the pCT and CBCT images, the accuracy of the registration and therefore the contour mapping, is often adversely affected by the presence of image contents in one image that do not have correspondence in the other image. The propagation of rectum wall is an example of this. For prostate, rectal, or gynecological cancer patients for example, the presence and absence of bowel gas can vary daily. Coregistering an empty rectum without bowel gas to a rectum filled with bowel gas (or vice versa) using any deformable model could be problematic and large errors could occur.
We describe a regional contour propagation algorithm taking into account possible organ deformation and anatomic changes. Because the narrow band contains only the image features outside the rectum, this method is not affected by the rectum filling changes. The use of SIFT descriptor enhances our ability to find the correspondence of the narrow band because of the effective utilization of image intensity and gradient information. In contrast to the conventional intensity-based image registration, which only uses intensity information of the voxels, the feature-based registration extracts information regarding image structure, including shape, texture, etc. Therefore, the feature-based image registration is generally more effective in correctly identifying corresponding voxels compared to the intensity-based image registration.
In this study, a bidirectional SIFT descriptor is employed to examine the reliability and robustness of the calculations. The bidirectional mapping further enhances the degree of success of a contour propagation algorithm. It is useful to note that the bidirectional mapping is a necessary (but not sufficient) test. In a rare but possible situation, the bidirectional mapping may not be able to find an error occurred in the contour mapping process.
Because the iterative procedure in the B-spline is not needed in our method, the calculation speed is at least ten times faster than B-spline registration. Typically the total calculation time of SIFT-TPS mapping with about 1000 SIFT descriptors is less than 2 min. Several parameters influence calculation time. For example, larger narrow-band will result in longer calculation times. The number of control points also affects calculation time quite nonlinearly as well. For most cases, 300 control points are enough for accurate contour mapping. Due to the tight clinical timeframes (especially for real-time adaptive schemes), 1 or 2 min calculation time allows the use of the contour mapping tool between acquiring the verification images and delivering the dose fraction for online corrections.18
In some cases, no corresponding feature is found by SIFT in a certain area close to the rectal wall. For instance, no control point was found in the upper part of Fig. 5. Since no large local deformation was in these regions, the result was all right. However, it would have lead to larger errors in case of large deformations plus low feature density, which may happen in smooth soft tissues. We will improve it in our future work.
One of the practical concerns is that the relatively low quality of CBCT images may influence the accuracy of image registration and thus the contour mapping. Paquin et al. quantitatively studied the influence of different types of noises on deformable registration and found that the accuracy of image registration does not depend on the global noise unless the noise reaches a certain threshold value.19 Murphy et al. also demonstrated that noise levels in cone-beam CTs that might reduce manual contouring accuracy do not reduce image registration and automatic contouring accuracy.20
Deformable model plays an important role in automated contour propagation. Numerous approaches have been developed for different applications. Most popular deformable registration methods for medical images include the thin plate splines (TPS),8 B-splines,21, 22 and finite element method (FEM).23 TPS is less sensitive to noise because of its global calculation nature.24 It relies on the use of homologous control points in the two input image sets to be coregistered. Control points are manually selected for many TPS applications.13, 25, 26 This may introduce interuser variability and is a major source of error. Malsch et al. presented an automatic block matching method,18 which is similar to the control volume based approach proposed by Schreibmann and Xing.27 Kim et al. presented an automated TPS, where an arbitrary set of control points is supplied initially and then is iteratively repositioned until the resulting warp optimizes some measure of registration.28, 29, 30 The convergence of the iterative calculation is slow because each control point influences the transformation in a global fashion. An alternative is to use B-splines. In contrast to TPS, which allows arbitrary configurations of the control points, B-spline requires a regular mesh of control points with uniform spacing. Unlike spline-based registration methods, FEM models the deforming image as an elastic body subject to external forces which drive the deformation and internal forces (stresses) which impose smoothness constraints.31, 32 FEM may fail to model highly localized deformations, since the deformation energy caused by stress increases proportionally with the strength of the deformation.33
CONCLUSION
Large interfractional patient setup uncertainty and anatomy changes have been reported in numerous studies and are widely recognized as one of the major limiting factors for maximum exploitation of modern radiation therapy techniques such as IMRT and IGRT. The advent of onboard volumetric imaging devices promises to improve the situation by providing valuable 3D (or even possibly four-dimensional) geometric data of the patient in the treatment position and allows for the adaptive modification of treatment plan during a course of treatment.
In this work, an effective feature-based rectal contour mapping algorithm has been described. The method yielded satisfactory mapping for both digital phantom and clinical cases. It is impressive that the algorithm is able to successfully map the contours from pCT to CBCT even for some very challenging cases in which the deformation and∕or image content change are dramatic. The two salient features of the described algorithm are: (1) the use of inherent tissue feature for control point selection as a priori knowledge for deformable registration; and (2) limiting the ROI to exclude the volume inside the rectum and focusing on the adjacent neighborhood of the rectal contour. The algorithm should be extendable for contour propagation of organs with similar features, such as the bladder and stomach.
ACKNOWLEDGMENTS
This work was supported in part by grants from the Department of Defense (W81XWH-06-1-0235 and W81XWH05-1-0041) and National Cancer Institute (1R01 CA98523 and CA104205).
References
- Xing L. et al. , “Overview of image-guided radiation therapy,” Med. Dosim. 31, 91–112 (2006). [DOI] [PubMed] [Google Scholar]
- de la Zerda A., Armbruster B., and Xing L., “Formulating adaptive radiation therapy (ART) treatment planning into a closed-loop control framework,” Phys. Med. Biol. 10.1088/0031-9155/52/14/008 52, 4137–4153 (2007). [DOI] [PubMed] [Google Scholar]
- Lee P. et al. , “Image-guided radiation therapy (RT) for rectal cancer using cone beam CT (CBCT),” Int. J. Radiat. Oncol., Biol., Phys. 66, S276 (2006). [Google Scholar]
- Foskey M. et al. , “Large deformation three-dimensional image registration in image-guided radiation therapy,” Phys. Med. Biol. 10.1088/0031-9155/50/24/008 50, 5869–5892 (2005). [DOI] [PubMed] [Google Scholar]
- Gao S. et al. , “A deformable image registration method to handle distended rectums in prostate cancer radiotherapy,” Med. Phys. 10.1118/1.2222077 33, 3304–3312 (2006). [DOI] [PubMed] [Google Scholar]
- Ibanez L., Schroeder W., and Ng L., “ITK Software Guide,” Kitware, Inc., 2003.
- Schroeder W., Martin K., and Lorensen B., The Visualization Toolkit: An Object-Oriented Approach To 3D Graphics, 3rd ed., 2003.
- Bookstein F. L., “Principal warps: Thin plate splines and the decomposition of deformations,” IEEE Trans. Pattern Anal. Mach. Intell. 10.1109/34.24792 11, 567–585 (1989). [DOI] [Google Scholar]
- Lowe D. G., “Object recognition from local scale-invariant features,” Proc. of the International Conference on Computer Vision, Corfu, 1999.
- Mikolajczyk K. and Schmid C., “A performance evaluation of local descriptors,” IEEE Trans. Pattern Anal. Mach. Intell. 10.1109/TPAMI.2005.188 27, 1615–1630 (2005). [DOI] [PubMed] [Google Scholar]
- Wu G., Qi F., and Shen D., “A general learning framework for non-rigid image registration,” MIAR, 2006, pp. 219–227.
- Lu W. et al. , “Fast free-form deformable registration via calculus of variations,” Phys. Med. Biol. 10.1088/0031-9155/49/14/003 49, 3067–3087 (2004). [DOI] [PubMed] [Google Scholar]
- Lian J. et al. , “Mapping of the prostate in endorectal coil-based MRI∕MRSI and CT: A deformable registration and validation study,” Med. Phys. 10.1118/1.1806292 31, 3087–3094 (2004). [DOI] [PubMed] [Google Scholar]
- Court L. E. and Dong L., “Automatic registration of the prostate for computed-tomography-guided radiotherapy,” Med. Phys. 10.1118/1.1608497 30, 2750–2757 (2003). [DOI] [PubMed] [Google Scholar]
- Schreibmann E., Chen G. T., and Xing L., “Image interpolation in 4D CT using a BSpline deformable registration model,” Int. J. Radiat. Oncol., Biol., Phys. 10.1016/j.ijrobp.2005.11.018 64, 1537–1550 (2006). [DOI] [PubMed] [Google Scholar]
- Lu W. et al. , “Automatic re-contouring in 4D radiotherapy,” Phys. Med. Biol. 10.1088/0031-9155/51/5/002 51, 1077–1099 (2006). [DOI] [PubMed] [Google Scholar]
- Zhang T. et al. , “Automatic delineation of on-line head-and-neck computed tomography images: toward on-line adaptive radiotherapy,” Int. J. Radiat. Oncol., Biol., Phys. 10.1016/j.ijrobp.2007.01.038 68, 522–530 (2007). [DOI] [PubMed] [Google Scholar]
- Malsch U. et al. , “An enhanced block matching algorithm for fast elastic registration in adaptive radiotherapy,” Phys. Med. Biol. 10.1088/0031-9155/51/19/005 51, 4789–4806 (2006). [DOI] [PubMed] [Google Scholar]
- Paquin D., Xing L., and Levy D., “Multiscale deformable registration of noisy medical images,” Math. Biosci. Eng. 5, 125–144 (2008). [DOI] [PubMed] [Google Scholar]
- Murphy M. J. et al. , “How does CT image noise affect 3D deformable image registration for image-guided radiotherapy planning?,” Med. Phys. 10.1118/1.2837292 35, 1145–1153 (2008). [DOI] [PubMed] [Google Scholar]
- Staring M., Klein S., and Pluim J. P. W., “A rigidity penalty term for nonrigid registration,” Med. Phys. 10.1118/1.2776236 34, 4098–4108 (2007). [DOI] [PubMed] [Google Scholar]
- Schreibmann E. et al. , “Image interpolation in 4D CT using a B spline deformable registration model,” Med. Phys. 32, 1924 (2005). [DOI] [PubMed] [Google Scholar]
- Alterovitz R. et al. , “Registration of MR prostate images with biomechanical modeling and nonlinear parameter estimation,” Med. Phys. 10.1118/1.2163391 33, 446–454 (2006). [DOI] [PubMed] [Google Scholar]
- Roberts S. and Stals L., “Discrete thin plate spline smoothing in 3D,” Annal. Chim. 45, C646–C659 (2004). [Google Scholar]
- Fei B., Kemper C., and Wilson D. L., “A comparative study of warping and rigid body registration for the prostate and pelvic MR volumes,” Comput. Med. Imaging Graph. 4, 267–281 (2003). [DOI] [PubMed] [Google Scholar]
- Coselmon M. M. et al. , “Mutual information based CT registration of the lung at exhale and inhale breathing states using thin-plate splines,” Med. Phys. 10.1118/1.1803671 31, 2942–2948 (2004). [DOI] [PubMed] [Google Scholar]
- Schreibmann E. and Xing L., “Image registration with auto-mapped control volumes,” Med. Phys. 10.1118/1.2184440 33, 1165–1179 (2006). [DOI] [PubMed] [Google Scholar]
- Kim B. et al. , “Mutual information for automated unwarping of rat brain autoradiographs,” Neuroimage 5, 31–40 (1997). [DOI] [PubMed] [Google Scholar]
- Meyer C. R. et al. , “Demonstration of accuracy and clinical versatility of mutual information for automatic multimodality image fusion using affine and thin-plate spline warped geometric deformations,” Med. Image Anal. 10.1016/S1361-8415(97)85010-4 1, 195–206 (1997). [DOI] [PubMed] [Google Scholar]
- Brock K. M. et al. , “Automated generation of a four-dimensional model of the liver using warping and mutual information,” Med. Phys. 10.1118/1.1576781 30, 1128–1133 (2003). [DOI] [PubMed] [Google Scholar]
- Xing L., Siebers J., and Keall P., “Computational challenges for image-guided radiation therapy: Framework and current research,” Semin. Radiat. Oncol. 17, 245–257 (2007). [DOI] [PubMed] [Google Scholar]
- Lester H. and Arridge S. R., “A survey of hierarchical non-linear medical image registration,” Pattern Recogn. 10.1016/S0031-3203(98)00095-8 32, 129–149 (1999). [DOI] [Google Scholar]
- Hajnal J. V., Hill D. L. G., and Hawkes D. J., Medical Image Registration. (CRC Press, Boca Raton, 1999). [Google Scholar]
- ITK, http://www.itk.org.
- VTK, http://public.kitware.com/VTK/.


