Abstract
Four dimensional (4D) computed tomography (CT) image sorting is currently a retrospective procedure. Mismatches in displacement and∕or phase of a patient’s respiratory signal, corresponding with two dimensional images taken at subsequent couch positions, become visible as artifacts in reconstructed 4D CT images. These artifacts appear as undefined or irregular boundaries in the 4D CT images and cause systematic errors in patient contouring and dose calculations. In addition, the substantially higher dose required for 4D CT, compared with 3D CT, is of concern. To minimize these problems, we developed a prospective respiratory displacement and velocity based cine 4D CT (PDV CT) method to trigger image acquisition if the displacement and velocity of the respiratory signal occurred within predetermined tolerances simultaneously. The use of velocity avoids real-time phase estimation. Real-time image acquisition ensures data sufficiency, while avoiding the need for redundant data. This may potentially result in a lower dose to the patient. PDV CT was compared with retrospective 4D CT acquisition methods, using respiratory signals of 24 lung cancer patients (103 sessions) under free breathing conditions. Image acquisition was simulated for each of these sessions from the respiratory signal. The root mean square (RMS) of differences between displacements and velocities of the respiratory signal corresponding to subsequent images was calculated in order to evaluate the image-sorting accuracy of each method. Patient dose reductions of 22 to 50% were achieved during image acquisition depending on the model parameters chosen. The mean RMS differences over all sessions and image bins show that PDV CT produces similar results to retrospective displacement sorting overall, although improvements of the RMS difference up to 20% were achieved depending on the model parameters chosen. Velocity RMS differences improved between 30 and 45% when compared with retrospective phase sorting. The efficiency in acquisition compared with retrospective phase sorting varied from ∼10% for displacement and velocity tolerances of 1 mm and 4 mm∕s, respectively, to 80 to 93% for 4 mm and 4 mm∕s. The lower variation in the displacement and velocity of the respiratory signal in each image bin indicates that PDV CT could be a valuable tool for reducing artifacts in 4D CT images and lowering patient dose, although the cost may be increased acquisition time.
Keywords: 4D CT, artifacts, phase sorting, displacement sorting
INTRODUCTION
Four dimensional (4D) computed tomography (CT) imaging is an important tool in radiation oncology. It enables tighter margins to be used during treatment planning and enhanced accuracy during treatment delivery for patients with tumor motion affected by respiration. The cornerstone of 4D radiotherapy is the acquisition of artifact-free 4D CT images. One method to acquire a 4D CT scan of a patient is to use the CT scanner in cine mode, i.e., the couch stops during data acquisition.1 The time stamps of the reconstructed axial two dimensional (2D) CT slices and the measured respiratory signal of the patient are retrospectively matched. The slices are then sorted either by phase or displacement of the respiratory signal into image bins. Next, the 2D slices are stacked to create a three dimensional (3D) image of the patient for each image bin. A 4D image is then reconstructed by viewing the 3D images in sequence for each image bin.2, 3, 4 It is also possible to acquire 4D CT images using a multislice helical method,5 i.e., the couch does not stop, but moves at a velocity low enough so that a sufficient number of slices can be acquired for the complete respiratory cycle.
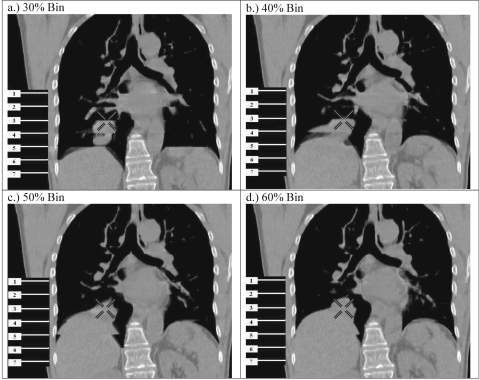
However, because of the variability of respiratory motion, mismatches in displacement and phase of the respiratory signal—corresponding with the 2D CT images—occur from respiratory cycle to cycle. Currently, only a finite number of axial images can be acquired for one couch stop over approximately one breathing cycle of a patient, because of hardware limitations of current CT scanners. This introduces temporal sampling errors (see Ehrhardt et al.6 for a detailed explanation). These mismatches in displacement or phase of a patient’s respiratory signal, which correspond with 2D images taken at subsequent couch positions, become visible as artifacts in reconstructed 4D CT images.7, 8 Artifacts appear as undefined or irregular boundaries in the 4D CT images, thereby limiting the efficacy and performance of deformable image registration algorithms used for 4D treatment planning. Artifacts also cause systematic errors in patient contouring and dose calculations, which increases the possibility of complications during or after treatment. Clinically significant artifacts appear in a large fraction of 4D CT scans based on retrospective phase sorting. Retrospective displacement sorting may show fewer artifacts than phase sorting; however, there is no guarantee that the data sufficiency condition is met, and gaps in the 4D CT image may be present.2, 4, 7, 8, 9, 10 In Fig. 1, examples of these artifacts are illustrated at the dome of the diaphragm in both lungs for retrospectively phase-sorted 4D CT images of a lung cancer patient during free breathing. The images are from phase bins corresponding to 30, 40, 50, and 60% (where the 0% bin represents end inhale and ∼50% end exhale) of the period of each corresponding respiratory cycle for the patient. Note that the tumor volume (below the cross-hairs in each of the four images) is altered drastically from phase to phase and that motion artifacts make it difficult to delineate the tumor accurately. Another concern is the substantially higher dose necessary for 4D CT, which increases by a factor of 10 approximately (depending on the average respiratory period for each patient), as compared with 3D CT.
Figure 1.
Examples of artifacts in retrospectively sorted phase-based 4D CT images for phase bins of (a) 30%, (b) 40%, (c) 50%, and (d) 60% (where the 0% bin represents end inhale and ∼50% end exhale) of the respiratory period of each respective cycle. Note that the tumor volume (below the cross-hairs) is altered drastically from phase to phase because of artifacts, to the point that it is almost impossible to tell if an artifact or a tumor is in the 40% phase bin. The numbered lines on each image represent the detector span for different couch positions (2 cm in this case). The cross-hairs provide a common reference point in each image.
Previous studies2, 4, 5, 6, 8, 10, 11, 12 showed that artifacts are caused by device-dependent limitations and∕or patient-dependent limitations. Device-dependent limitations include, for example, instances when the position of any anatomical structure changes faster than the rotation of the gantry, resulting in a structure that is not “frozen in time” during image acquisition; this poor temporal resolution will cause blurring artifacts, i.e., the edges of an anatomical structure become poorly defined. This problem can be solved by faster CT scanners. Another device-dependent limitation that causes artifacts is detector size. This can be corrected by increasing the size of the detector to allow the anatomy of a patient that is affected by respiratory motion to be scanned concurrently. Mismatches of the respiratory motion at subsequent couch positions would then become irrelevant.
Patient-dependent limitations include the variability of a patient’s respiratory signal from cycle to cycle. The effects of these variations on the number and magnitude of artifacts in 4D CT can be minimized with a varying degree of success by the following methods (also discussed by Keall et al.13): (1) use of different retrospective sorting methods: various authors2, 4, 7, 8, 9, 14, 15 have shown that the number and magnitude of artifacts can be substantially decreased if retrospective displacement sorting is used instead of retrospective phase sorting, e.g., negligible artifacts are found to occur for displacement mismatches <5 mm.7 However, retrospective displacement sorting may result in absent image slices if no matching displacements occurred for subsequent respiratory cycles during image sorting; (2) training patients with the use of audio or audiovisual biofeedback to enhance reproducibility of the respiratory motion;13, 16, 17 however, some patients cannot be trained successfully, and significant artifacts are still frequent; (3) restriction of breathing motion.13 Note, however, that this method may become uncomfortable for patients if it is repeated for extended periods of time during treatments; (4) sorting of images in sinogram space, which is equivalent to retrospective displacement or phase sorting without the implicit temporal error,5, 13 but with all the other disadvantages of retrospective methods; or (5) postprocessing images, e.g., deformable registration or interpolation,13 which is most effective if the true geometry of the anatomy is known or can be accurately inferred, which in turn is dependent on the magnitude and frequency of artifacts in the original images. A tumor may also be completely enclosed by an artifact.
To reduce artifacts in 4D CT images and dose to patients during scanning, we propose a prospective cine 4D CT image-sorting method, which uses both the displacement and the first temporal derivative (linear velocity) of the respiratory signal as variables for image acquisition (prospective displacement and velocity based CT method or PDV CT method). Images are acquired only if both variables are within predetermined tolerances from a calculated reference respiratory cycle. If the tolerances are sufficiently small, it can be inferred from the respiratory signals that 4D CT images will have either fewer and smaller artifacts than those produced by current retrospective phase-sorting methods, or artifacts similar to those seen when retrospective displacement sorting methods are used. Real-time phase estimation, which is dependent on the reproducibility of the respiratory signal, also has limitations9, 18 and is prone to significant phase errors if the predicted period of the respiratory cycle is not the same as the true period. Velocity can, however, be computed more accurately in real time. Real-time image sorting also allows for timely corrections to enhance the quality of the scan and eliminates time-consuming postprocessing. It also ensures adequate data acquisition to reconstruct 4D CT images at all image bins. This is not always true with the currently used retrospective sorting methods; no matter how well one sorts the data, one cannot correct for data that simply is not there, particularly at the extrema of tumor motion. It will also be shown that the PDV CT method may result in a lower dose to the patient during a 4D CT scan, because no redundant data acquisition is necessary. With PDV CT, image sorting of 2D CT images is essentially done in a five-dimensional (5D) parameter space, where displacement and the sign of the velocity (representing inhale or exhale) are used as temporal sorting parameters, replacing the use of either phase or displacement as a temporal parameter during retrospective sorting, and velocity as a separate parameter correlating to some additional parameter of the system, e.g., the airflow rate.12, 19 Similar methods have, to our knowledge, not yet been implemented for 4D CT, although Neicu et al.20, 21 described a similar real-time method for radiotherapy that is based on both phase and displacement of the respiratory signal and uses a calculated average tumor trajectory to compare against a real-time tumor position estimation. Low et al.12 have argued that purely phase-based models are fundamentally inappropriate to characterize breathing motion when patients have not undergone coaching. They also suggested a 5D approach to breathing modeling for radiotherapy, in which the last two dimensions consist of tidal volume and airflow in the lungs. Keall et al.11 first introduced the idea of prospective sorting for 4D CT images according to displacement and phase of the respiratory signal.
PDV CT has been simulated in real time, i.e., the respiratory signal was read point by point with no knowledge of future data. Although the beam on∕off control is simulated, we feel that PDV CT could be included in a 4D CT scanner. From an engineering perspective, this would require only minor changes to the software controlling the scanner. System latency is incorporated via a prediction algorithm in PDV CT. The principles on which PDV CT is based, as well as indirect testing methods evaluating its efficiency and accuracy compared with retrospective sorting methods, are presented here to test the robustness of the method. First, the respiratory signals of lung cancer patients are used as input to the respective sorting methods with the assumption that the internal tumor motion and the external respiratory signal have a reasonable correlation,13, 22, 23, 24 allowing the respiratory signal to be used as a surrogate for the internal motion. This assumption is used clinically for external signal-based respiratory gated treatments as well as Cyberknife synchrony treatments.24, 25, 26 Differences in the respiratory signal variables for subsequent cycles should then be an indication of the expected image quality.
METHOD
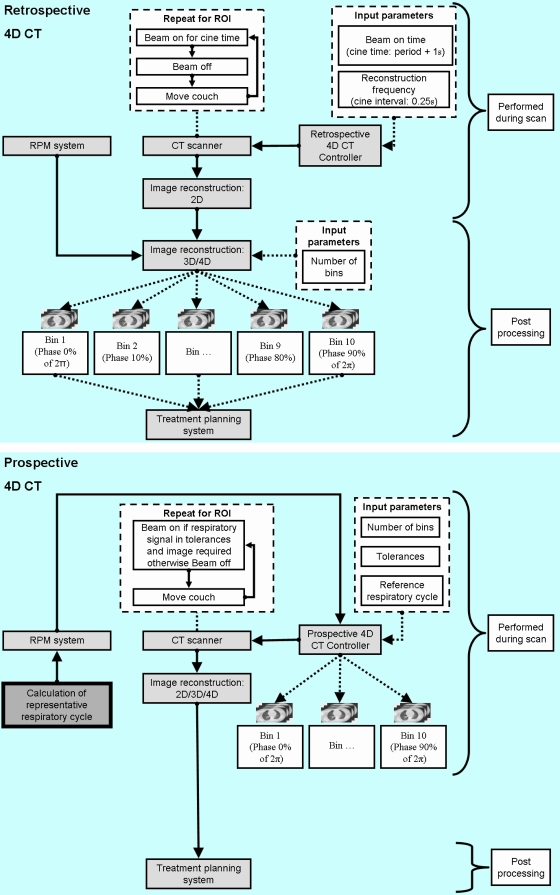
In Fig. 2, the current retrospective image-sorting methods are illustrated and compared with the proposed PDV CT method. Respiratory signals of 24 lung cancer patients (103 approximately four-minute sessions) under free breathing conditions were used to study and compare the efficiency of the respective 4D CT acquisition methods. These respiratory signals were acquired with a Varian real-time position management (RPM) system. Although no CT images were used for this work, image acquisition was simulated for each sorting method by using the respiratory signal and comparing the displacement and velocities of the respiratory signal for corresponding images. Scanner and sorting parameters similar to those currently used in clinical practice were utilized for these simulations. For 2D CT image simulation, data were acquired for a finite time (the time it takes the gantry to rotate through 180°+the fan angle; ∼0.39 s for a gantry rotation of 0.5 s) for each image. This results in 13 sequential displacements, phases, and velocities of the RPM signal (data points) corresponding to each image if the RPM acquires data at 30 Hz. Phase and velocity were calculated with an in-house method described in the next section.
Figure 2.
Left panel: the current retrospective 4D CT image-acquisition procedure. Right panel: PDV CT image acquisition using respiration input to the control in order to reduce motion artifacts.
Retrospective methods
For retrospective 4D CT methods, images were reconstructed every 0.25 s (the cine interval) for the average respiratory period +1 s (the cine time) for each session, e.g., 20 images for a 4 s respiratory period. The couch was assumed to move in 1.3 s to the next position where the process was repeated for the duration of the recorded respiratory signal for each session. The measured respiratory signal (xi,0) was first smoothed by applying a three-point running average recursively to calculate accurately the phase and velocity retrospectively, i.e., by applying
| (1) |
and then setting xi,j=yi,j∀i after each recursion (j). Here, interval is the total duration of the respiratory signal; in this case, yi=smoothed data, xi=raw data (or previously smoothed data); and k=number of recursions. For the retrospective models, k=15 was used to calculate the position of the maxima for phase calculations, and k=5 was used to calculate the velocity. These displacements, phases, and velocities of the respiratory signal were then linked to the simulated images. Next, the images were retrospectively sorted into 10 bins for each couch position by either using phase or displacement as a sorting parameter. The same bin positions as those calculated for PDV CT were used to ensure consistency (see Fig. 4).
Figure 4.
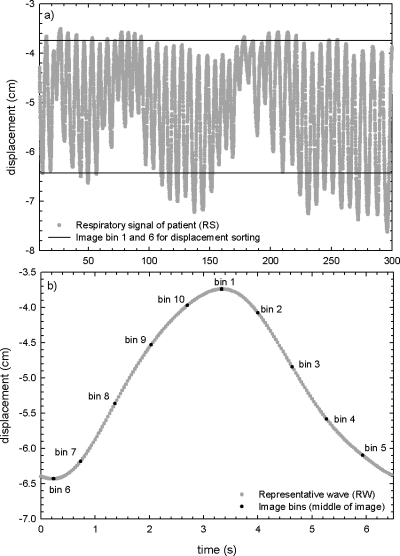
(a) An example of a respiratory signal (RS) measured for a patient. The upper bin (bin 1) and the lower bin (bin 6) as used for displacement sorting are also indicated. These bins correspond with the bins used for PDV CT for this patient. (b) The representative waveform (RW) for the patient as used in PDV CT. The bins where images would be acquired are indicated. The same bins were used for phase, displacement, and PDV CT sorting.
PDV CT method
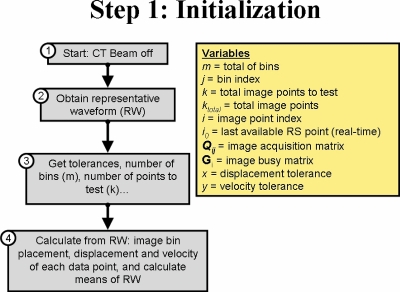
In Fig. 3, the initialization steps for PDV CT are illustrated. First, a representative waveform (RW) was calculated from samples of the respiratory signal (box 2, Fig. 3) by determining the weights of the five most significant Fourier components in a least-squares fit to the respiratory samples.27 For most sessions, 10 cycles of the respiratory signal were used to calculate RW, although up to 20 cycles were necessary if large variations occurred between cycles. This process is illustrated in Fig. 4, where an example of a measured respiratory signal for a patient is shown, as well as the calculated RW. It must be noted that the efficiency of this method depends to a large degree on the autocorrelation of RW with the real-time respiratory signal (RS), because RW will be used to determine in real time if RS is within tolerance, for both displacement and velocity.
Figure 3.
Initialization steps for PDV CT.
Next, the acquisition parameters for the patient were set, e.g., tolerances for displacement and velocity, number of image bins to acquire, percentage of points to test, smoothing parameters to use, etc., as well as scanner parameters, e.g., the gantry rotation time, the fan angle for the scanner, etc. (box 3, Fig. 3). These parameters were the same as those used with retrospective sorting methods, where applicable, to ensure consistency. From these inputs, the number of points needed for each image could be calculated (13 points in this case—see previous section). Bins were placed at equal time intervals starting at the maximum of RW (end inhale), as illustrated in Fig. 4. For this work, 10 bins were used. The bin closest to the minimum of RW (end exhale) was shifted, so that a bin was placed at each extremum. This process is illustrated in Fig. 4, where the image bins calculated from RW for the patient are shown, as well as the complete RS for the patient. The same image bins were used for each sorting method.
PDV CT was performed for displacement tolerances of 1, 2, and 4 mm and velocity tolerances of 2, 3, and 4 mm∕s, in order to test the efficiency for each combination. Typical ranges of motion for these parameters for this set of patients were 0.75–2.5 cm for displacement from end inhale to end exhale, depending on the location of the tumor, and 0.4–1.25 cm∕s for velocity. Velocity tolerances also scaled as the absolute second temporal derivative of RW, normalized to range from the value given above when the magnitude of the velocity is a maximum, and increased by a factor of 2.5 times higher when the velocity was zero, i.e., for bins placed at the extrema. Tolerances for each bin were, thus, calculated separately. This was done to enhance the efficiency of the method at the extrema. PDV CT was also tested for a parameter: “percentages of points tested” of 1, 40, 70, and 100%. This parameter ensured that only the specified percentage of image points must be within tolerance. Note that ∼0.39 s of continuous data is still acquired for each image; however, all the data are not tested against the tolerances.
Corresponding displacement and velocity of each bin for RW were calculated for each point necessary for an image (box 4, Fig. 3). Mean displacement and velocity were also calculated for the percentage of points that must be tested for each image, as well as the mean displacement and velocity for all the points necessary for an image. These means were used for different acquisition scenarios of PDV CT. Different acquisition scenarios can be used for PDV CT, depending on the efficiency requirements. A list of the respective scenarios with corresponding descriptions is given in Table 1. After initialization, image acquisition can start with the chosen parameters for the patient.
Table 1.
Description of the respective retrospective models used, as well as different scenarios for PDV CT. Key to legend for Figs. 678.
| Figure legend | Model description |
|---|---|
| Retrospective sorting methods | |
| Retrospective phase sorting | Images sorted according to phase retrospectively |
| Retrospective displacement sorting | Images sorted according to displacement retrospectively |
| Acquisition scenarios for PDV CT | |
| No prediction: Displacement∕velocity sorting | Only current respiratory signal data point tested against tolerances |
| Single-point prediction scenario: Displacement∕velocity sorting | Trigger image acquisition if it is predicted that all points will stay in tolerance and that an image triggered with the current respiratory point will be more optimal in accuracy than an image triggered with the next. During image acquisition: test current respiratory signal data point against corresponding point of reference bin |
| Mean prediction scenario: Displacement∕velocity sorting | Trigger image acquisition if it is predicted that all points will stay in tolerance and that an image triggered with the current respiratory point will be more optimal in accuracy than an image triggered with the next. During image acquisition: calculate mean from all the points needed for an image (consisting of respiratory signal data points already recorded for image and the predicted points still needed) and test it against mean of reference bin |
| Single-point prediction scenario: Displacement sorting only | Same as single-point prediction scenario above, but done only for displacement sorting, i.e., the velocity tolerance was arbitrarily large, although the sign is still used in order to differentiate between exhale and inhale. |
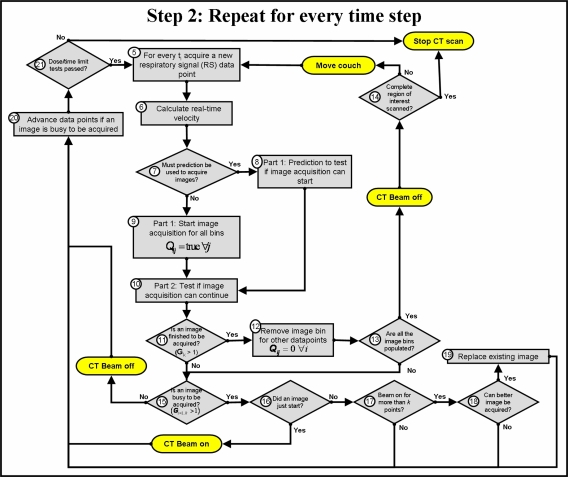
The steps in Fig. 5 are repeated for every time step (box 5, Fig. 5). RS is first smoothed to decrease noise on the signal, which includes system noise or high frequency variations. Smoothing is done by using Eq. 1, with the interval set to 100, i.e., x0 is the 100 most recent data points of the respiratory signal. If the noise is assumed to be Gaussian in nature, the smoothing process can be repeated until
| (2) |
with m=0.002 used in this work to ensure the most accurate velocity calculation. If m is too large, information may be lost because of oversmoothing, but if it is too small, the noise on the signal increases. The velocity of RS is calculated from this smoothed signal (box 6, Fig. 5). Prediction of the number of data points needed for image acquisition and one additional point from the most recent data point (box 8, Fig. 5) is done only if it was chosen as an option at the start of the scan. An in-house template-based linear adaptive prediction filter is used. The mean of the displacement and the velocity of the most recent point and the predicted points are calculated and compared with the mean of RW for each bin to determine if image acquisition can be completed, i.e., all the data points will stay within tolerance, if image acquisition was triggered at this point. Optimization is also done to test if an image triggered at the next data point will be a more optimal solution (box 8, Fig. 5). The prediction step ensures that an unnecessary dose is minimized. This algorithm can also be used to incorporate system latency by increasing the number of predicted points. If prediction is not performed, it is assumed that image acquisition can be triggered for each bin (box 9, Fig. 5), i.e., every new data point is treated as a first image point for each bin. Next, the current data point (or the mean of image points already acquired and the predicted points still needed for the percentage of image points that must be tested—mean prediction scenario) is tested against the tolerances for each corresponding image point of each bin where an image is being acquired (single-point prediction scenario) (box 10, Fig. 5). Data points are, thus, tested for all the reference bins simultaneously, and images will be acquired in random order for each bin and each couch position. It may also happen that the same set of data points of the respiratory signal will be used for images at two different bins, if all the criteria are met for image acquisition for each bin. Data are checked against RW as well as against the image data acquired for the same bin at the previous couch position. If the point is not within tolerance from the reference displacement and velocity, image acquisition for that point of the image corresponding with the bin for which it was tested is halted. If image acquisition is completed for a bin, i.e., the x-ray beam was on for enough time to reconstruct an image (∼0.39 s), the image points are saved (box 11, Fig. 5). All other stages of acquisition for the same image are also reset (box 12, Fig. 5), and all the image bins are tested to ensure that they are populated for the current couch position (box 13, Fig. 5). If this is the case, the x-ray beam is turned off, and the couch is moved to the next position, or the scan is stopped if the complete region of interest has already been scanned (box 14, Fig. 5). If this is not the case, it is necessary to determine if any images are presently being acquired (boxes 15 and 16, Fig. 5), and consequently the x-ray beam is turned on or kept on if images are busy to be acquired, or off if no images are busy to be acquired. To ensure that no excess dose is delivered to the patient if image acquisition is halted for a bin (i.e., it must be restarted at a later stage), safety tests are performed. If the safety tests fail, acquisition is continued regardless of whether displacement and velocity are outside the tolerance limits (box 21, Fig. 5). This may degrade the quality of the scan, but will enhance the efficiency and allow only prescribed doses. If the x-ray beam was on for more than the required time to acquire an image (boxes 17–19, Fig. 5), optimization can be performed for acquired images by substituting images if a more optimal image is found (i.e., smaller difference in displacement and velocity between current image and image at previous couch position). Adjustments to parameters are done if dose for a couch position exceeds limits or if the efficiency is too low (box 21, Fig. 5).
Figure 5.
Main algorithm for the real-time sorting method. The oval-shaped steps show where the algorithm would interact with the scanner in real time.
Comparison of the models
The root mean square (RMS) of the difference between the displacements and velocities, respectively, of the respiratory signal corresponding to subsequent images was calculated in order to evaluate the accuracy of each method. The number of couch positions that could be completed for each method was calculated as proxy for the time efficiency of the scan; for a couch position to be considered completed, it is necessary that images for all the bins have been acquired. The length of time for which the x-ray beam is turned on is calculated for each method as proxy for the dose that a patient will receive. This was also done for different model parameters, such as changes in the percentage of image points that must be tested, different methods for performing the sorting with PDV CT, and different displacement and velocity tolerances.
RESULTS AND DISCUSSION
The main goal in this work was to investigate whether PDV CT will give smaller differences in the displacement and velocity of the respiratory signal of a patient corresponding to images taken for the same image bin at subsequent couch positions, than those given by current retrospective sorting methods. Underlying our work was the assumption that the internal (in this case, the tumor motion or diaphragm motion, where image artifacts most frequently occur) and external (in this case, the respiratory signal) motions of a patient have a reasonable correlation, in order to allow the respiratory signal to be used as a surrogate for the tumor motion. This implies that the magnitudes of artifacts in 4D CT images will be correlated with the magnitudes of the differences in the displacement and velocity of the respiratory signal corresponding with the images. In our study, we also compared the efficiency of PDV CT with retrospective methods, and illustrate the effects of different parameters on the efficiency of PDV CT. These model parameters could be varied to enhance a certain aspect of PDV CT, e.g., if the dose must be decreased, the percentage of image points that must be tested can be decreased, because this will increase the possibility that an image is acquired with the current data.
In Fig. 2, the current retrospective processes are illustrated and compared with PDV CT. For retrospective methods, the respiratory signal is combined with the acquired 2D CT images during postprocessing. No accurate estimation of the expected magnitude of artifacts in the 4D CT images can be made during the scan, because image acquisition is separate from this process. This can result in delays of treatment if the scan must be repeated, because of unacceptably large artifacts. This is not the case with PDV CT, where the expected magnitude of the artifacts can be controlled by changing the magnitude of the tolerances for displacement and velocity of the respiratory signal. Adjustments can also be made while the patient is still on the couch if large variations in the respiratory motion of the patient occur. Postprocessing of retrospective methods can be lengthy if a clinically significant number of artifacts occurs in the 4D CT images of a patient. With PDV CT, this step is completely avoided. All the processing is done during the scan. The calculation of RW should not add more than three minutes to the scan, depending on the number of respiratory cycles needed.
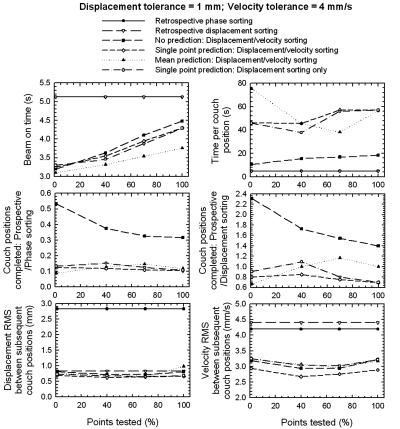
In Fig. 6, the efficiency of the model in acquisition time and beam-on time and its accuracy as a function of the percentage of image points tested are shown for different acquisition scenarios. Descriptions for these acquisition scenarios are given in Table 1. The displacement and velocity tolerances were kept constant at 1 mm and 4 mm∕s, respectively. From this figure, it is clear that the dose (beam-on time) can be substantially decreased when PDV CT is used. Compared with retrospective methods for all acquisition scenarios, PDV CT can reduce dose from as much as 40%, when only 1% of the image points are tested against the tolerances, to ∼12% for the no prediction scenario when all the image points are tested against the tolerances. The “no prediction” scenario for PDV CT produced the fastest scans of the PDV CT scenarios, although the time to acquire an image for each bin per couch position was markedly greater compared with the retrospective methods. This time increased by 14 s per couch position for the “no prediction” scenario, compared with the retrospective methods, to ∼54 s for the other PDV CT scenarios when 100% of the image points were tested against the tolerances. As expected, the beam-on time as well as the acquisition time increased linearly, as it became more difficult to acquire an image, i.e., as the percentage of points tested increased; on the other hand, this was not the case for the accuracy, where a minimum was observed if 40–60% of the points were tested. However, for the mean prediction scenario, where a mean was calculated for the image points to compare against a reference mean for each bin, the acquisition time per couch position did not follow this linear trend. The acquisition time per couch position increased by almost a factor of 2, when compared with the other prediction scenarios when 1% of the image points were tested against the tolerances; under this scenario, it was expected that there would be no difference between it and the scenario where each point was tested against the tolerances (single-point prediction scenario). This happened because an additional constraint was added to the single-point prediction scenario, i.e., each point that was not tested against the tolerances was not allowed to differ by more than four times the magnitude of the tolerances for each bin. This added constraint restricted the acquisition of border-line images that were allowed by the mean prediction scenario. These border-line images, acquired for the mean prediction scenario, made it more difficult to find subsequent images within tolerances, because the points tested had to be within tolerance of both RW as well as the respiratory displacement and velocity of the previously acquired image for each bin.
Figure 6.
Model efficiency in acquisition time, dose, and accuracy as a function of the percentage of image points tested. The results are shown for retrospective displacement and phase sorting, compared with the PDV CT sorting with no prediction, and two prediction modes, or for PDV CT with prediction, but done only for displacement sorting (see Table 1). The values are the means over 24 patients (103 sessions) and 10 bins.
Less than 15% of the number of couch positions for the same duration of the respiratory signal could be completed for the different PDV CT scenarios when compared with retrospective phase sorting. However, this increased to 80% to 110% for the prediction scenarios of PDV CT when compared with retrospective displacement sorting—up to 180% on average over the number of points tested for the “no prediction” scenario. This increase resulted when couch positions where data gaps would have occurred for retrospective displacement sorting were eliminated, making it less efficient than retrospective phase sorting.
The displacement accuracy, measured as the RMS of the difference between the displacements of the respiratory signal corresponding with subsequent images, increased by ∼75% (decrease in RMS) for all scenarios of PDV CT when compared with retrospective phase sorting. PDV CT was, nevertheless, comparable to the accuracy measured for retrospective displacement sorting. This indicates that images acquired with PDV CT will have similar artifacts than those acquired with retrospective displacement sorting. However, an increase in velocity accuracy of ∼25% was observed for all PDV CT scenarios compared with retrospective sorting methods, which may indicate fewer artifacts and∕or artifacts smaller in magnitude.
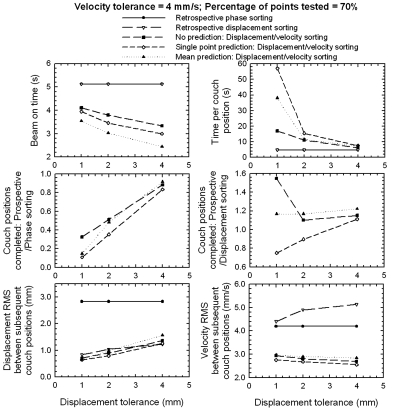
In Fig. 7, the model efficiency in acquisition time, dose, and accuracy is shown as a function of the displacement tolerance. The velocity tolerance was kept constant at 4 mm∕s, and the percentage of points tested at 70%. This figure illustrates that the displacement accuracy improves linearly as the displacement tolerance is decreased, although the beam-on time will increase. These trends are expected, because it becomes increasingly difficult to satisfy the constraints as the displacement tolerance decreases. Interestingly, the velocity accuracy increases as the displacement tolerance decreases for the PDV CT scenarios. The number of couch positions completed for the single-point prediction scenario of PDV CT, compared against retrospective phase sorting, increased from less than 10 to more than 80% as the displacement tolerance increased from 1 to 4 mm. The acquisition time per couch position increases exponentially as the displacement tolerance decreases, indicating that it can be markedly improved for larger displacement tolerances, without losing too much in accuracy. However, the displacement tolerance must not be larger than 3 mm to achieve accuracy similar to that of retrospective displacement sorting. Although a lower dose could have been delivered for the mean prediction scenario and the acquisition time per couch position was lower, the accuracy was also less than that of single-point prediction scenario. This feature allows PDV CT to be benchmarked depending on the application, e.g., radiotherapy where accuracy is more important, or for diagnostic imaging where dose is more important.
Figure 7.
Similar to Fig. 6, but as function of displacement tolerance.
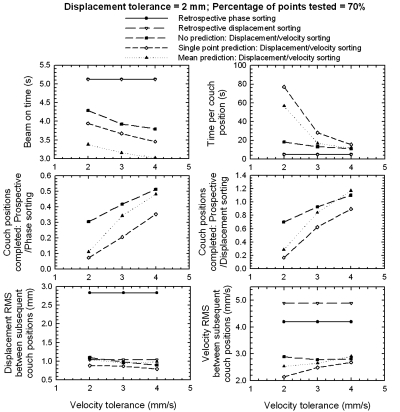
In Fig. 8, the model efficiency in acquisition time, dose, and accuracy is shown as a function of the velocity tolerance. The displacement tolerance was kept constant at 2 mm, and the percentage of points tested was 70%. This figure demonstrates, as expected, how the dose delivered decreases as the velocity tolerances increase; this is because it becomes easier to acquire images as the constraints on the velocity tolerances become less strict. Again, the exponential decrease in acquisition time per couch position is observed as the velocity tolerance increases. The number of couch positions completed for the single-point prediction scenario of PDV CT, compared with retrospective phase sorting, increased from less than 10 to more than 30%, as the velocity tolerance increased from 2 to 4 mm∕s. While the displacement accuracy stays approximately constant as a function of the velocity tolerance, the velocity accuracy increases for the prediction scenarios as the velocity tolerance increases, but decreases for the “no prediction” scenario.
Figure 8.
Similar to Fig. 6, but as function of velocity tolerance.
These results illustrate that dose delivered to the patient during 4D CT imaging can be markedly decreased, while the accuracy can substantially increase when PDV CT is used—compared with retrospective sorting methods, although the price for these gains will be an increase in acquisition time. This study has shown that accuracy, dose, and acquisition time can, however, be optimized to acceptable levels by varying the parameters of PDV CT.
Possible advantages∕disadvantages of PDV CT image acquisition are:
-
(1)
Fewer artifacts in 4D CT images, which may result in more accurate dose calculations and better structure delineation for treatment planning;
-
(2)
Dose reduction during the 4D CT scan, because no redundant data are needed to improve the retrospective sorting. This also implies that the number of required bins can be preset, e.g., two, four, etc., which could further reduce the patient dose;
-
(3)
Less data storage needed, because no redundant data are required to improve the retrospective sorting. Less data will result in faster image reconstruction (because fewer images must be reconstructed), faster data transfer, and larger regions of interest of the patient that can be scanned in one session, because this is currently constrained by an upper limit on the number of images allowed for a scan;
-
(4)
If breathing training, e.g., audio or audiovisual biofeedback, is used in the clinic, the similar respiratory motion of the patient used for the CT scan can be simulated during treatment, if the same RW is used for breathing training27 in both. This also ensures that this method will not become obsolete if multislice scanners, which can scan the complete region of interest at once, are used, because the scan can be taken during a reproducible respiratory cycle, and not during an arbitrary respiratory cycle. Baseline drift in the respiratory cycle, which causes systematic errors during treatment, can also be detected and avoided if the same respiratory motion is simulated;
-
(5)
Quality of PDV CT images may not be dependent on the regularity of the respiratory motion of a patient, i.e., a patient with irregular breathing can potentially still be scanned and treated in 4D, without losing quality of the scans and accuracy in treatment. However, more predictable respiratory motion could significantly increase the efficiency of the method;
-
(6)
Real-time phase estimation is avoided. This reduces the risk for substantial errors in phase when patients with irregular respiratory motion are scanned;
-
(7)
Flexibility and robustness. By varying the parameters of PDV CT, the efficiency and accuracy can be enhanced∕decreased depending on the application (radiotherapy or diagnostic). Retrospective methods are also essentially subsets of PDV CT. They can be reproduced by changing the magnitudes of the tolerances;
-
(8)
No postprocessing of images is required, which will reduce the stress on resources and processing time, as well as ensure that a successful 4D CT has been acquired while the patient is on the couch; this reduces the need for rescanning if significant artifacts are observed;
-
(9)
Blurring artifacts in some anatomical structures in 4D CT images can be controlled by not allowing images if the difference in displacement of the respiratory signal from the beginning to the end of the image is more than, e.g., 5 mm for any one image. These artifacts occur if the temporal resolution is insufficient, i.e., the position of any anatomical structure changes faster than the rotation of the gantry. This will, however, only apply to anatomical structures with motion correlating to respiratory motion, i.e., it may work for eliminating blurring artifacts in the diaphragm, but not in the heart;
-
(10)
System latency can be handled by increasing the number of points of the respiratory cycle that must be predicted;
-
(11)
However, the time to complete the 4D CT scan may increase, because two variables are tested against tolerances, resulting in more strict conditions than for current retrospective methods. This effect can, however, be minimized by using this method only for regions known to produce large artifacts in 4D CT images. If the respiratory signal of a patient is markedly regular, the time to complete the 4D CT scan may also decrease, because oversampling, as is currently required for data redundancy in retrospective methods, is eliminated.
CONCLUSIONS
From various studies, it follows that artifacts in 4D CT images are caused by irregularities in the respiratory motion of a patient. These artifacts are most apparent when retrospective phase-sorting algorithms are used. Even though displacement sorting leads to fewer artifacts in 4D CT images, it is not an optimal solution, because missing data for some slices may occur. Even though these slices might be acquired from interpolating the previous and subsequent slices, important information might be lost if, for example, the tumor is enclosed within a region containing artifacts. Therefore, a respiratory displacement and velocity-based prospective cine CT method was developed to trigger image acquisition in cases where both the displacement and velocity of the respiratory signal of a patient are simultaneously within predetermined tolerances, thus, essentially sorting 2D CT images in 5D parameter space. Real-time phase estimation also has known problems. The use of velocity of the respiratory signal for real-time image sorting avoids these problems. The PDV CT method described here could be a valuable tool for artifact reduction in 4D CT images, and more importantly, substantial dose reduction to the patient, although the price might be in acquisition time. This study showed that accuracy, dose, and acquisition time can, however, be optimized to acceptable levels by changing the parameters of PDV CT.
ACKNOWLEDGMENTS
The authors thank Raghu Batta Venkat of Stanford University for providing the software to calculate the representative waveform. This work was supported by P01 Grant No. 1P01CA116602-01A27117.
References
- Pan T., “Comparison of helical and cine acquisitions for 4D-CT imaging with multislice CT,” Med. Phys. 10.1118/1.1855013 32(2), 627–634 (2005). [DOI] [PubMed] [Google Scholar]
- Abdelnour A. F., Nehmeh S. A., Pan T., Humm J. L., Vernon P., Schoder H., Rosenzweig K. E., Mageras G. S., Yorke E., Larson S. M., and Erdi Y. E., “Phase and amplitude binning for 4D-CT imaging,” Phys. Med. Biol. 10.1088/0031-9155/52/12/012 52(12), 3515–3529 (2007). [DOI] [PubMed] [Google Scholar]
- Keall P., “4-dimensional computed tomography imaging and treatment planning,” Semin. Radiat. Oncol. 14(1), 81–90 (2004). [DOI] [PubMed] [Google Scholar]
- Lu W., Parikh P. J., Hubenschmidt J. P., Bradley J. D., and Low D. A., “A comparison between amplitude sorting and phase-angle sorting using external respiratory measurement for 4D CT,” Med. Phys. 10.1118/1.2219772 33(8), 2964–2974 (2006). [DOI] [PubMed] [Google Scholar]
- Keall P. J., Starkschall G., Shukla H., Forster K. M., Ortiz V., Stevens C. W., Vedam S. S., George R., Guerrero T., and Mohan R., “Acquiring 4D thoracic CT scans using a multislice helical method,” Phys. Med. Biol. 10.1088/0031-9155/49/10/015 49(10), 2053–2067 (2004). [DOI] [PubMed] [Google Scholar]
- Ehrhardt J., Werner R., Saring D., Frenzel T., Lu W., Low D., and Handels H., “An optical flow based method for improved reconstruction of 4D CT data sets acquired during free breathing,” Med. Phys. 10.1118/1.2431245 34(2), 711–721 (2007). [DOI] [PubMed] [Google Scholar]
- Mutaf Y. D., Antolak J. A., and Brinkmann D. H., “The impact of temporal inaccuracies on 4DCT image quality,” Med. Phys. 10.1118/1.2717404 34(5), 1615–1622 (2007). [DOI] [PubMed] [Google Scholar]
- Pan T., Sun X., and Luo D., “Improvement of the cine-CT based 4D-CT imaging,” Med. Phys. 10.1118/1.2794225 34(11), 4499–4503 (2007). [DOI] [PubMed] [Google Scholar]
- Rietzel E. and Chen G. T., “Improving retrospective sorting of 4D computed tomography data,” Med. Phys. 10.1118/1.2150780 33(2), 377–379 (2006). [DOI] [PubMed] [Google Scholar]
- Vedam S., Archambault L., Starkschall G., Mohan R., and Beddar S., “Determination of prospective displacement-based gate threshold for respiratory-gated radiation delivery from retrospective phase-based gate threshold selected at 4D CT simulation,” Med. Phys. 10.1118/1.2794169 34(11), 4247–4255 (2007). [DOI] [PubMed] [Google Scholar]
- Keall P. J., Vedam S. S., George R., and Williamson J. F., “Respiratory regularity gated 4D CT acquisition: Concepts and proof of principle,” Australas. Phys. Eng. Sci. Med. 30(3), 1–10 (2007). [DOI] [PubMed] [Google Scholar]
- Low D. A., Parikh P. J., Lu W., Dempsey J. F., Wahab S. H., Hubenschmidt J. P., Nystrom M. M., Handoko M., and Bradley J. D., “Novel breathing motion model for radiotherapy,” Int. J. Radiat. Oncol., Biol., Phys. 10.1016/j.ijrobp.2005.03.070 63(3), 921–929 (2005). [DOI] [PubMed] [Google Scholar]
- Keall P. J., Mageras G. S., Balter J. M., Emery R. S., Forster K. M., Jiang S. B., Kapatoes J. M., Low D. A., Murphy M. J., Murray B. R., Ramsey C. R., Van Herk M. B., Vedam S. S., Wong J. W., and Yorke E., “The management of respiratory motion in radiation oncology report of AAPM Task Group 76,” Med. Phys. 10.1118/1.2349696 33(10), 3874–3900 (2006). [DOI] [PubMed] [Google Scholar]
- Guckenberger M., Weininger M., Wilbert J., Richter A., Baier K., Krieger T., Polat B., and Flentje M., “Influence of retrospective sorting on image quality in respiratory correlated computed tomography,” Radiother. Oncol. 85(2), 223–231 (2007). [DOI] [PubMed] [Google Scholar]
- Olsen J. R., Lu W., Hubenschmidt J. P., Nystrom M. M., Klahr P., Bradley J. D., Low D. A., and Parikh P. J., “Effect of novel amplitude∕phase binning algorithm on commercial four-dimensional computed tomography quality,” Int. J. Radiat. Oncol., Biol., Phys. 10.1016/j.ijrobp.2007.09.013 70(1), 243–252 (2008). [DOI] [PMC free article] [PubMed] [Google Scholar]
- George R., Vedam S. S., Chung T. D., Ramakrishnan V., and Keall P. J., “The application of the sinusoidal model to lung cancer patient respiratory motion,” Med. Phys. 10.1118/1.2001220 32(9), 2850–2861 (2005). [DOI] [PubMed] [Google Scholar]
- Kini V. R., Vedam S. S., Keall P. J., Patil S., Chen C., and Mohan R., “Patient training in respiratory-gated radiotherapy,” Med. Dosim. 28(1), 7–11 (2003). [DOI] [PubMed] [Google Scholar]
- Ruan D., Fessler J. A., and Balter J. M., “Mean position tracking of respiratory motion,” Med. Phys. 10.1118/1.2825616 35(2), 782–792 (2008). [DOI] [PubMed] [Google Scholar]
- Christensen G. E., Song J. H., Lu W., El Naqa I., and Low D. A., “Tracking lung tissue motion and expansion∕compression with inverse consistent image registration and spirometry,” Med. Phys. 10.1118/1.2731029 34(6), 2155–2163 (2007). [DOI] [PubMed] [Google Scholar]
- Neicu T., Shirato H., Seppenwoolde Y., and Jiang S. B., “Synchronized moving aperture radiation therapy (SMART): Average tumour trajectory for lung patients,” Phys. Med. Biol. 10.1088/0031-9155/48/5/303 48(5), 587–598 (2003). [DOI] [PubMed] [Google Scholar]
- Neicu T., Berbeco R., Wolfgang J., and Jiang S. B., “Synchronized moving aperture radiation therapy (SMART): Improvement of breathing pattern reproducibility using respiratory coaching,” Phys. Med. Biol. 10.1088/0031-9155/51/3/010 51(3), 617–636 (2006). [DOI] [PubMed] [Google Scholar]
- Juhler Nottrup T., Korreman S. S., Pedersen A. N., Aarup L. R., Nystrom H., Olsen M., and Specht L., “Intra- and interfraction breathing variations during curative radiotherapy for lung cancer,” Radiother. Oncol. 10.1016/j.radonc.2007.05.026 84(1), 40–48 (2007). [DOI] [PubMed] [Google Scholar]
- Korreman S. S., Juhler-Nottrup T., and Boyer A. L., “Respiratory gated beam delivery cannot facilitate margin reduction, unless combined with respiratory correlated image guidance,” Radiother. Oncol. 86(1), 61–68 (2008). [DOI] [PubMed] [Google Scholar]
- Murphy M. J., “Tracking moving organs in real time,” Geriatr. Nephrol. Urol. 14(1), 91–100 (2004). [DOI] [PubMed] [Google Scholar]
- Chang S. D. and Adler J. R., “Robotics and radiosurgery—The cyberknife,” Stereotact. Funct. Neurosurg. 76(3–4), 204–208 (2001). [DOI] [PubMed] [Google Scholar]
- Schweikard A., Shiomi H., and Adler J., “Respiration tracking in radiosurgery,” Med. Phys. 10.1118/1.1774132 31(10), 2738–2741 (2004). [DOI] [PubMed] [Google Scholar]
- Venkat R. B., Sawant A., Suh Y., George R., and Keall P., “Development and preliminary evaluation of a prototype audiovisual biofeedback device incorporating a patient-specific guiding waveform,” Phys. Med. Biol. 10.1088/0031-9155/53/11/N01 53(11), N197–N208 (2008). [DOI] [PubMed] [Google Scholar]


