Abstract
The effects of temperature on real time changes in optical density (ΔOD) of GAFCHROMIC® EBT film were investigated. The spectral peak of maximum change in absorbance (λmax) was shown to downshift linearly when the temperature of the film was increased from 22 to 38 °C. The ΔOD values were also shown to decrease linearly with temperature, and this decrease could not be attributed to the shift in λmax. A compensation scheme using λmax and a temperature-dependent correction factor was investigated, but provided limited improvement. Part of the reason may be the fluctuations in hydration of the active component, which were found to affect both position of absorbance peaks and the sensitivity of the film. To test the effect of hydration, laminated and unlaminated films were desiccated. This shifted both the major and minor absorbance peaks in the opposite direction to the change observed with temperature. The desiccated film also exhibited reduced sensitivity to ionizing radiation. Rehydration of the desiccated films did not reverse the effects, but rather gave rise to another form of the polymer with absorbance maxima upshifted further 20 nm. Hence, the spectral characteristics and sensitivity of the film can be dependent on its history, potentially complicating both real-time and conventional radiation dosimetry.
Keywords: radiochromic film, film dosimetry, environmental conditions, temperature, humidity
INTRODUCTION
In recent years, the use of radiation-induced polymerization materials for measurement of dose has been gaining increasing importance.1, 2, 3, 4, 5, 6, 7 While many of the current polymer systems are utilized for two- or three-dimensional dose representation, high spatial resolution offers potential for successful implementation in point-based measurements. Radiochromic materials commercially available in GAFCHROMIC® films (International Specialty Products, Wayne, NJ) have the desired high spatial resolution8, 9, 10 and are able to provide sufficient signal from a subcubic millimeter volume.11, 12 Furthermore, they can be made relatively energy independent,13, 14, 15 and have been shown to respond in real time.11, 12 Ultimately, all of these characteristics make these polymer systems excellent candidates for real-time point dose measurements on or within the patient during diagnosis, treatment, and monitoring of a patient’s pathologies.
Two radiochromic films (MD-55 and EBT) previously investigated for real-time dosimetry can provide a dose measurement during the irradiation.11, 12 However, because polymerization proceeds for some time after the radiation pulse, the development of radiochromic media continues even after the source of irradiation is turned off.11, 12, 16, 17, 18, 19 This introduces some dose-rate effects in real-time measurements that need to be taken into consideration. Dose-rate dependent variations introduced during real-time measurements have been quantified for GAFCHROMIC® EBT film and are small over certain dose and dose rate ranges.20 Thus, accurate real-time measurements with a quickly polymerizing radiochromic medium, such as that in EBT film, are possible.
While dose-rate dependence can be eliminated by performing the readout 24 h after irradiation and this would be acceptable in the fractionated radiotherapy regimen, such a technique would not allow for immediate intervention in the event of severe over- or underdosing. Real-time dosimetry is also appealing if one is interested in resolving dose from multiple segments and beams in a complex IMRT treatment, whereby multiple pieces of film and several trips into the room would be necessary with conventionally used film dosimeters. Incorporating a radiochromic medium as an in vivo dosimeter may involve positioning a small volume of the medium onto a tip of an optical fiber. This optical fiber would guide the light from the appropriately selected interrogation light source to the radiochromic medium. The light transmitted through the radiochromic medium on the tip of the fiber would be reflected by a thin coating towards the same (or a second) fiber. This transmitted light would be analyzed in real time by a spectrometer, and a dose estimate would be made from the gathered spectral information. The entire dosimeter (i.e., radiochromic medium, reflective surface, optical fiber) would be encased in a biocompatible sheath, which would allow positioning on or within a patient. If the entire dosimeter is made to be less than 1 mm in diameter, positioning of the dosimeter within the patient using a high-gauge needle would be possible and would allow for real-time in vivo dose measurements at depth.
Before implementing any polymer system as a patient dosimeter, the underlying reactions and the effects of dose, dose rate, temperature, and humidity variations on the dose estimate should be understood. As indicated above, dose and dose rate dependence of real-time measurements have been characterized for the two radiochromic media (MD-55 and EBT). GAFCHROMIC® MD-55 film was also investigated for temperature and humidity effects, showing a dependence of optical density on percent relative humidity.21 The EBT film, the more sensitive medium of the two, has not been investigated for humidity dependence, and effects of temperature variations on real-time measurements have not been characterized. This article investigates the potential of GAFCHROMIC® EBT as a real-time point in vivo dosimeter by addressing the effects of temperature and humidity variations that may arise during its use.
Chemical background and general experience
The active component in MD-55 and EBT films are pentacosa-10,12-diynoic acid (PCDA) and the lithium salt of pentacosa-10,12-diynoic acid (or LiPCDA), respectively. They are from a class of materials known as diacetylenes. These organic molecules contain two conjugated acetylene groups (carbon-carbon triple bonds). When in an ordered state, for example in crystals, monomolecular layers, or micelles, some diacetylenes undergo a 1,4 polymerization reaction initiated by exposure to ionizing radiation. The resulting diacetylene polymers are intensely colored materials produced in proportion to the absorbed dose. It has been shown that for polymerization of diacetylenes similar to that used in MD-55, the diacetylene monomers should be packed so that the triple bonds in adjacent monomers are within 0.4 nm.22 The efficiency with which the polymerization proceeds is related to the intermolecular proximity and relative orientation of the diacetylene monomer molecules. It is thought to be likely that the molecular orientation and proximity factors leading to higher or lower sensitivity will be similar for the EBT and MD-55 films.
The packing of the monomers generally depends on the type and size of the end groups in the diacetylene monomer.23, 24 While the molecular packing of the active diacetylene monomer in EBT film is not the same as that of MD-55 film,12 both contain the pentacosa-10,12-diynoate ion. Thus, the packing of pentacosa-10,12-diynoate ions is also dependent on the size and chemistry of the cation associated with the carboxylate end-group and this leads to dramatic differences in sensitivity. The sodium and potassium salts of PCDA are relatively insensitive to ionizing radiation and do not undergo significant and useful polymerization at doses less than about 1 kGy. In contrast, the parent acid (the cation is H+) employed in MD-55 film is useful at doses greater than about 5 Gy, while the lithium salt of PCDA used in EBT film can be employed at doses as low as 1 cGy.
The atomic conformation of a diacetylene polymer is slightly different than the atomic conformation in the ordered monomer due to slight shifting of the acetylenic carbons upon polymerization. Initially, the structure of the polymer is constrained within the framework of the surrounding monomer. As the local polymer concentration increases the constraints on atomic movement are diminished and the atomic conformation in the polymer relaxes into a lower energy form.22 A similar effect on polymer conformation is observed when the constraints provided by the host monomer are reduced at temperatures close to the melting point. A transition in the structure of the diacetylene backbone is accompanied by a shift in the absorption peaks, and by a change in length of polymer chain.25 Such a rearrangement is observed in MD-55 with increased dose10, 21, 26, 27 and with temperature.10, 11, 28 A shift in absorption peak with dose was not observed for EBT film,12 which leads to a belief that the conformation of atoms comprising the polymer backbone of the LiPCDA polymer formed within EBT film is similar to the backbone of the monomer chain. Whether such a shift occurs with temperature, and how this would affect real-time estimation of dose still remains to be determined.
In preparing microparticles of the active LiPCDA component two of the authors (Lewis and Varma) have discovered that two distinct forms can be grown. These forms are described as “hair-like” and “plate-like.” The hair-like form describes particles that have aspect ratio (length:width) greater than 10:1, in some cases even as high as 1000:1. Depending on the aspect ratio the particles may appear literally like hairs, or, for lower aspect ratios appear more like bristles or rods. The plate-like form describes particles having an aspect ratio less than 2:1 and a thickness about 10× less than the width or length. The hair-like particles, whether hairs, bristles, or rods all exhibit much greater sensitivity to radiation exposure than particles of the plate-like form. We believe that the molecular packing and configuration in the two forms of lithium LiPCDA is different, and that the intermolecular structure of the hair-like form is conducive to higher radiation sensitivity.
It is possible that these radiochromic media will not meet every desired criterion8 of an ideal in vivo dosimeter. In this event, it may be important to understand the relationship of chemical composition and intermolecular packing to energy dependence, temperature dependence, and dose rate dependence. The results may provide useful feedback for improving the design and configuration of the dosimeter, and ultimately lead to better performance. The goal of this work was to investigate the dependence of the response of the EBT film upon temperature and its state of hydration.
METHODS AND MATERIALS
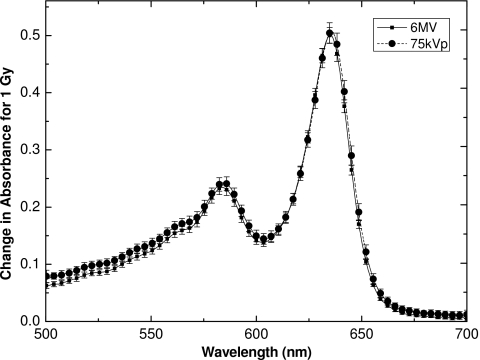
Since the radiochromic material under investigation is intended for real-time use, during which the temperature of the surroundings (i.e., tissue) and the medium can vary, it is important to look at the temperature effects in the same manner. In the real-time use of the dosimeter, the medium would be irradiated at the exact same time as the dose readout via the optical fiber would occur. That is, the temperature during irradiation and during readout is one and the same because of the simultaneity of the two. Hence, for the temperature dependence study, a real-time approach was used for measurements of ΔOD. On the other hand, humidity of the surroundings is not relevant for the intended use of the dosimeter, as the sensitive medium would be isolated from the tissue by a barrier to the penetration of water molecules. Thus, real-time measurements were unnecessary in this case, and the changes in optical density as well as spectral absorbance were obtained some time after the end of irradiation, as is typically done with these films. While care was taken to make sure the source of ionizing radiation was the same for a given experiment, this was not the case between the two sets of experiments. However, using a 6 MV beam for the temperature dependence study and a 150 kVp beam for the humidity dependence study should not matter, as EBT was shown to be energy independent.13 Figure 1 illustrates the average absorbance spectra obtained during irradiation to 1 Gy with a 6 MV and a 75 kVp beam (data adapted from another study).13
Figure 1.
Change in absorbance spectra for EBT film exposed to 1 Gy with 6 MV and 75 kVp beams. Each spectrum is an average of five spectra from five different films, with error bars representative of one standard deviation in measurement (1σ) at the given wavelength.
Temperature dependence
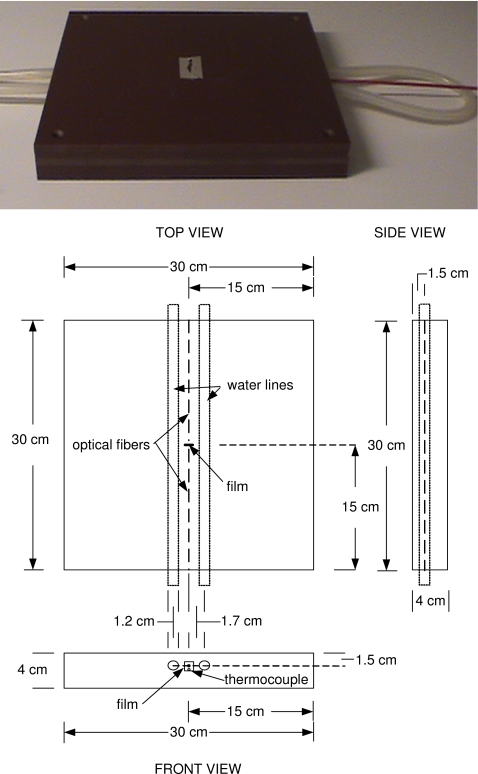
A 30 cm×30 cm×4 cm Solid Water™ phantom13 was designed to have the center (corresponding to the point of measurement) of the 1 cm×1 cm piece of radiochromic film located at 1.5 cm depth with the plane of the film perpendicular to the top surface of the phantom. Figure 2 illustrates the setup, with the top view as seen from the direction of the ionizing radiation beam. The phantom was further modified to accommodate two plastic hoses (1.2 cm diameter) for water circulation. The water flow and water temperature were controlled with a pump (Model FSe, Haake, Germany). A 50∕125 μm (core∕cladding diameter) optical fiber delivered light from a 630-nm light emitting diode (LED5 23RED, 17 nm full width at half maximum, LED Light, Inc., Carson City, NV) in perpendicular incidence with the film. A 1.50∕1.55 mm fiber on the opposite side of the film collected the transmitted light and delivered it to the spectrophotometer (SD2000, Ocean Optics, Inc., Dunedin, FL). Both delivery and collection fibers were located at 1.5 cm depth within the phantom, parallel to the top surface, and perpendicular to the EBT film (lot No. 35322-003I). Spectra of the light transmitted by the film were obtained for approximately 10 s prior to the start of an exposure, during the exposure, and for several minutes after the exposure at a rate of approximately one spectrum per second. For each spectrum, an absorbance spectrum was calculated using the initial transmitted light as the background
| (1) |
where R refers to the reference spectrum, D refers to the dark spectrum, and S refers to the sample spectrum of interest. The change in optical density (ΔOD) was then calculated by integrating the absorbance between 630 and 640 nm,
| (2) |
The ΔOD was plotted as a function of time. The data obtained during pre-exposure and postexposure intervals were fitted to linear functions; the data for the exposure interval were fitted to a third-order polynomial. Using the intercepts between these lines, and subtracting the ΔOD before exposure from the ΔOD at the end of exposure, the real-time ΔOD for the given dose was calculated.11, 20
Figure 2.
Picture and schematic of the modified phantom, with plastic water lines on either side of the film and optical fibers. The center axes of the water lines run parallel at 1.7 cm distance to the optical path, at 1.5 cm depth.
A small hole was drilled parallel to the collection fiber to accommodate the thermocouple wire. The temperature of the film was measured using a thermocouple sensor (Fluke 179, Fluke Co., Everett, WA), positioned 4.5 mm from the center of the film. In a separate set of measurements, two thermocouples were used to verify the equivalence of temperature at the two positions: one measured at the position of the center of the film and the other at the regular position of the thermocouple. It was found that the temperatures of the thermocouples were always within ±0.4 °C, and for 75% of the time they were within ±0.2 °C of each other for the entire experimental range of 22–38 °C. For the irradiations, film was inserted into the holder at least 15 min prior to measurements. The temperature measured by the thermocouple 4.5 mm from the film was recorded before and after each exposure. The temperature during the exposure was taken as the average of those two measurements.
For irradiation with a 6 MV beam, the phantom was positioned, without any extra buildup, under the linear accelerator at 100 cm SAD (98.5 cm SSD). A 10×10 cm field at SAD was used. Each film was irradiated to a nominal 100 cGy dose (no correction for lack of backscattering material was made) at 130 cGy∕min dose rate. Spectra of the light transmitted by the film were collected and used to calculate the ΔOD of the film for 100 cGy dose at the measured temperature. For part of the study, another set of films was similarly irradiated to doses 50, 100, 200, or 400 cGy.
Absorbance and sensitivity dependence on water content
For the purpose of this work, the LiPCDA was grown in two forms. The hair-like form, employed commercially as the active component in GAFCHROMIC® EBT dosimetry film, was grown in a gelatin binder and coated onto a single piece of polyester. This is referred to as unlaminated film A. The second, plate-like form, which is not used commercially, was also prepared in gelatin and coated onto polyester. It is referred to as unlaminated film B. The standard commercial GAFCHROMIC® EBT film product is constructed by laminating two pieces of the unlaminated film A to one another. Thus, several pieces (2.5×2.5 cm2) of the standard EBT configuration (fully laminated film) were made from film A. Samples of this EBT film together with the unlaminated film A were then dried over calcium chloride desiccant in a 50 °C oven for 24, 48, 60, and 126 h. The visual densities (i.e., optical density measured by a densitometer having a response weighted to that of the human eye) of the unirradiated desiccated films were measured at ambient temperature (20–24 °C) on an X-Rite 310T transmission densitometer (X-Rite, Inc., Grand Rapids, MI). The films were then irradiated to a dose of 3 Gy at a rate of approximately 2 Gy∕min in a Pantak 160 x-ray cabinet (Agfa, Mortsel, Belgium). They were positioned about 30 cm from the focal point of the tube and exposed to a 150 kVp 20 mA beam filtered through 2.0 mm of aluminum. Ten minutes after the end of the irradiation, the visual densities of the films were remeasured, and the change in visual density (ΔODv) due to the radiation exposure was calculated. The net changes in visual density of the desiccated samples were compared to the corresponding values for films which were not desiccated.
A piece of unlaminated film A was also irradiated as described above and the absorbance spectrum of this film was measured with a GBC Cintra 20 ultraviolet (UV)-visible spectrophotometer (GBC Scientific Equipment Pty., Ltd., Melbourne, Australia) 30 min after the end of irradiation. The spectrum of unirradiated unlaminated film A was also obtained and subtracted from the irradiated film spectrum to calculate the net change in absorbance due to the radiation exposure. These two films were then desiccated in a 50 °C oven and the spectra were remeasured after 24 and 48 h, with the spectrum of unirradiated film used as background. Following this, the desiccated films were rehydrated by suspending them over water in a sealed container at room temperature. The films were not in contact with liquid water. The absorbance spectra of the rehydrated unlaminated film A samples were again measured after 96 h.
In order to investigate whether an intermediate state between the regular hydrated form and the desiccated form of LiPCDA exists, a large uniform piece (7.5 cm×7.5 cm) of film from a production roll was used. This piece of film was exposed to an arbitrary dose resulting in optical density approximately equivalent to that observed for 10 Gy from high energy x rays, and then cut up into smaller pieces (2.5 cm×3.75 cm). All of these were placed into the same desiccator, with one piece removed at specified hours to measure the UV-VIS spectrum. No unirradiated films were used to subtract background.
Finally, the sample of unlaminated film B (made with the plate-like form of LiPCDA) was irradiated to 3 Gy and an absorbance spectrum was obtained for comparison to the spectrum of the unlaminated film A samples after desiccation and rehydration.
RESULTS AND DISCUSSION
Temperature dependence
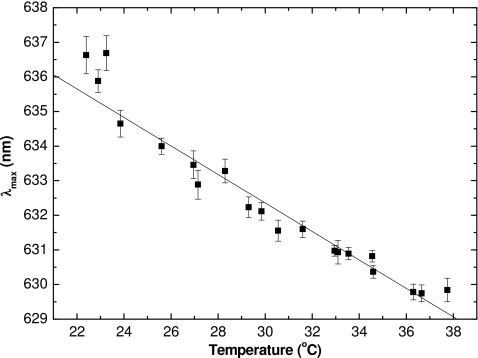
The wavelength of maximum change in absorbance (λmax) as a function of temperature for films irradiated to 1 Gy is shown in Fig. 3. Over the tested range of 22–38 °C a straight line fit to the data is given by
| (3) |
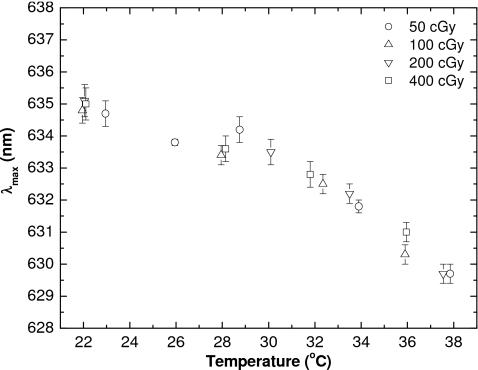
with the correlation coefficient R2 of 0.955. The trend of a decrease in λmax with increase in temperature was previously observed for other radiochromic materials.10, 11, 28 This decrease appears to be independent of the dose received by the film (Fig. 4), and this is not unexpected since λmax was previously shown to be dose level independent.12 The observed fluctuations in the measured λmax are possibly to be due to variation in water content within the sensitive layer, since the pieces of film are taken from the sheet randomly, and thus some measurements are performed closer to the initial sheet edge. As discussed in Sec. III C, the water content within the sensitive layer plays a role both in the spectral absorbance peaks and in the sensitivity of the film to ionizing radiation.
Figure 3.
Wavelength of maximum absorbance of films irradiated to 1 Gy as a function of measured temperature. For this and subsequent figures, 6 MV photons beams were used. The λmax was tracked from a few seconds after the beginning of irradiation, through to its end. The error bars represent the standard deviation of λmax over this time interval. The line is the linear regression fit to data (R2=0.955).
Figure 4.
Values of λmax for various doses as a function of measured temperature. The λmax was tracked from a few seconds after the beginning of irradiation through to the end. The error bars represent the standard deviation of λmax over this time interval.
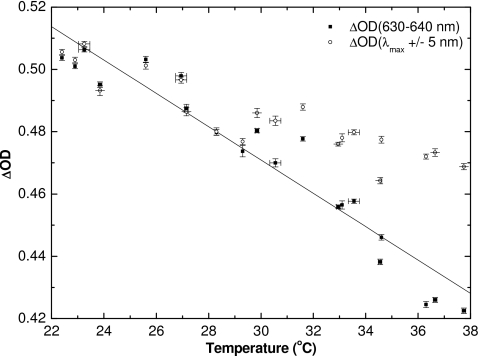
Figure 5 shows the ΔOD for a dose of 1 Gy as a function of temperature. The net change in absorbance has been calculated over the 630–640 nm range (ΔOD630–640 nm), corresponding to a range of about ±5 nm around the wavelength of maximum absorbance at room temperature. The ΔOD630–640 nm changes linearly with temperature and decreases by more than 10% over the range. The fit is described by
| (4) |
with the R2 correlation coefficient of 0.916. This line of best fit is later used as part of a temperature correction scheme. To show that the ΔOD decrease is not due to the observed shift in the wavelength of peak absorbance λmax, the ΔOD at each temperature was recalculated over a 10 nm wide band centered on the observed λmax. The ΔOD10 nm still decreases (Fig. 5) with increasing temperature. However, the slope, ΔOD10 nm∕ΔT, is less negative than that for the previous case, ΔOD630–640∕ΔT. This illustrates that the decrease in net absorbance with increasing temperature cannot be attributed solely to the shift in λmax with temperature.
Figure 5.
Change in optical density for 1 Gy dose calculated for optical range of 630–640 nm, and an optical range of 10 nm centered about λmax, vs measured temperature. The line of best fit is plotted for ΔOD630–640 nm (R2=0.916) and is later used in a temperature correction scheme.
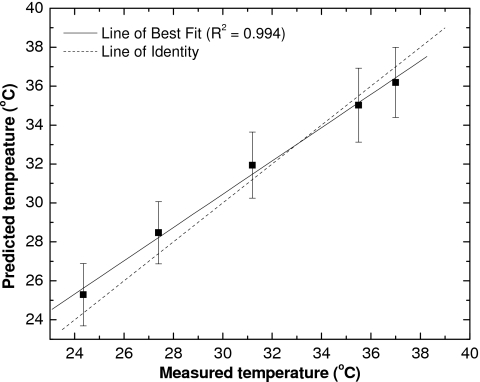
Given the linear dependence of λmax and ΔOD630–640 nm on temperature in the 22–38 °C range, a correction scheme was designed and investigated. In this scheme the value of λmax was used to correct for the decrease in ΔOD630–640 nm measured for pieces of film irradiated to 1 Gy dose. Substituting the value of λmax in Eq. 3 allows calculation of the predicted temperature Tp. A comparison between predicted and measured temperature is shown in Fig. 6, together with the lines of best fit and identity. For all five measurements, the predicted temperature is within prediction error of the true value.
Figure 6.
Temperature calculated using the position of λmax vs measured temperature, shown with a line of best fit. The error bar is a prediction error of 1σ.
The predicted temperature TP was substituted in Eq. 5 and used to calculate a correction factor. This correction factor can be applied to the change in optical density at temperature TP, ΔODTP, to determine the change in optical density at 22 °C. The correction factor is given by
| (5) |
where a and b are the intercept and the slope of Eq. 4, respectively. The change in optical density corrected to 22 °C is
| (6) |
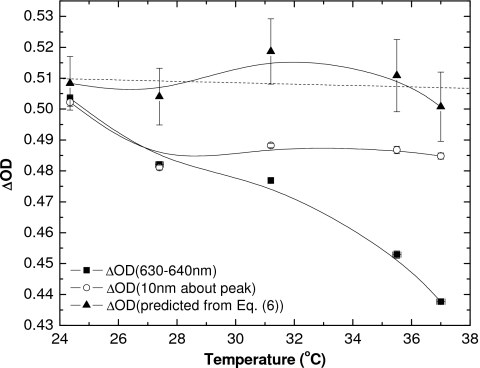
Figure 7 shows the effectiveness of this approach as well as the spectral range approach where the ΔOD is calculated over a wavelength range of ±5 nm either side of the absorption maximum. While the ΔOD(630–640 nm) decreases as seen previously (Fig. 5) by about 20% as temperature increases from 24 to 37 °C, the change of ΔOD10 is significantly less over the same temperature range. The approach of using λmax to determine the temperature and calculate a correction factor appears to partially remove the systematic error (the line of best fit has a small negative slope), and the standard errors of the corrected net optical densities are all less than 2.3%.
Figure 7.
Change in optical density for films irradiated to 1 Gy using a (◼) fixed optical integration range of 630–640 nm, (○) moving optical range of 10 nm about the peak of maximum change in absorbance, and (▲) as calculated using the peak of maximum absorbance and temperature-dependent correction factor. Solid lines are shown as a guide for the eye. Error bars indicate one standard deviation for the measured data and standard error (1σ) for calculated points, and the dashed line through the corrected ΔOD is the line of best fit (R2=0.029).
The equations describing the relationships of λmax and ΔOD(630–640 nm) to temperature are valid over the range from 22 to 38 °C for a dose of about 1 Gy. The effect of dose on the correction factors has been investigated for doses from 0.5 Gy to 4 Gy. The results are summarized in Table 1. Correction factors for doses of 1 Gy were determined twice. The values are shown in two columns. The first set (A) was used to correct the data shown in Fig. 7. The second set of values (B) were obtained from new film samples cut from the same sheet of EBT film from which set A was taken. From the data in Table 1 it can be seen that the correction factors for the two sets of 1 Gy irradiations are the same within experimental error. While the values of the correction factors for doses of 0.5, 1, and 2 Gy are in close correspondence and often within experimental error, the correction factors for 4 Gy dose are significantly smaller. The reason for this difference is unclear and it remains to be investigated further.
Table 1.
Correction factors for the temperature correction scheme, calculated for doses of 50–400 cGy and shown for a selection of predicted temperature values. The subscript denotes the dose to which the films were exposed (two sets of films were exposed to 100 cGy, denoted A and B).
| Tpred | F50 cGy | F100 cGy A | F100 cGy B | F200 cGy | F400 cGy |
|---|---|---|---|---|---|
| 25.3±1.6 | 1.04±0.02 | 1.01±0.02 | 1.03±0.01 | 1.03±0.02 | 1.010±0.005 |
| 28.5±1.6 | 1.08±0.02 | 1.05±0.02 | 1.06±0.02 | 1.07±0.02 | 1.019±0.005 |
| 31.9±1.7 | 1.12±0.02 | 1.09±0.02 | 1.10±0.02 | 1.11±0.03 | 1.030±0.005 |
| 35.0±1.9 | 1.17±0.03 | 1.13±0.03 | 1.13±0.02 | 1.15±0.03 | 1.039±0.006 |
| 36.2±1.8 | 1.18±0.03 | 1.14±0.03 | 1.14±0.02 | 1.17±0.03 | 1.043±0.006 |
In a recent paper by Lynch et al., an increase in optical density with increasing temperature over 18–33 °C range during readout was reported.29 To understand the effect that temperature has on the radiochromic medium in EBT, all the data must be considered together, taking into account the differences in measurement techniques. First, the background with respect to which optical density was measured is air,29 whereas the background used in this real-time study is unirradiated film. Second, the previous study used a red channel of a scanner, whereas the real-time study used a narrow 10 nm band corresponding to the main peak. The definition of ΔOD is also slightly different, where the previous study uses a technique that is better explained by the calculation described by Reinstein et al.30
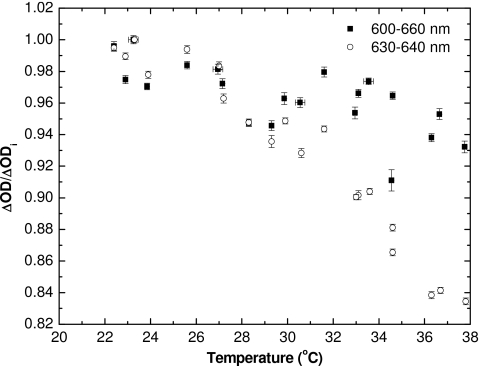
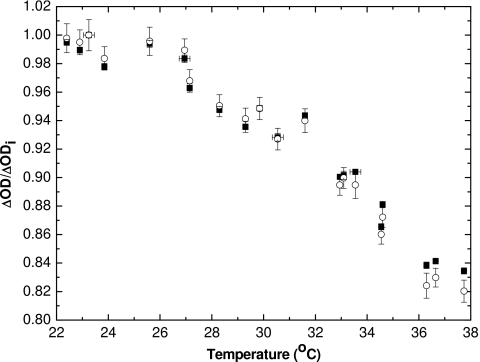
Increasing the range of wavelength to 600–660 nm and using unirradiated film as the background still shows a decrease in real-time ΔOD with temperature (Fig. 8). Using an OD calculation technique30 similar to that a densitometer or a scanner would employ, and subtracting OD of unirradiated film, also showed the same trend (Fig. 9). Thus, the combined results show that OD of the film increases with temperature during readout when compared to air and measured on a densitometer at a later time (when OD no longer increases significantly after irradiation), but decreases with temperature when compared to unirradiated film at that temperature and measured immediately at the end of irradiation which is also performed at that temperature.
Figure 8.
Normalized ΔOD (with respect to ΔOD at ∼23 °C) vs temperature for the real-time measurements, performed within 5 s after the end of irradiation. The data are shown both using the 630–640 nm range for ΔOD calculations (circles) and the 600–660 nm range (squares). Error bars represent 1σ of a single ΔOD measurement and error in temperature readout.
Figure 9.
Normalized ΔOD of real-time measurements. The method of calculating ΔOD used in this article is shown with squares (◼); the method described by Reinstein et al. (Ref. 30) of predicting ΔOD measured by a densitometer or scanner is shown with circles (○). Error bars represent 1σ of a single ΔOD measurement and error in temperature readout.
Generally speaking, two explanations for the observed temperature dependence can be proposed. First, a real-time ΔOD decrease could be due to a decrease in sensitivity or kinetics with increase in temperature. However, in most cases it is expected that an increase in the temperature at which irradiation occurs will result in increased sensitivity and polymerization kinetics, so long as the temperature is lower than that at which a phase change occurs. This increase in sensitivity relates to greater atomic motion within the solid phase at higher temperature and the increased likelihood that polymerization will be initiated between adjacent molecules. On the other hand, if the temperature increases sufficiently (above the melting point) to cause a phase change, dramatic changes in sensitivity may result (diminishing to zero) due to the loss of intermolecular order between the diacetylene molecules. While it may be theoretically possible for liquid phase to have increased sensitivity compared to solid phase, the authors do not know of any diacetylenes exhibiting this characteristic. The melting point of the lithium salt of PCDA used in EBT film is approximately 150 °C. Since increasing temperatures up to 37 °C does not approach the melting point, we believe it is unlikely that the negative change in net optical density is due to a decrease in the intrinsic sensitivity or polymerization kinetics of the active component.
An alternate explanation is that the absorption and reflection coefficients of the multiple components of the film (plastic coating, adhesive, radiochromic suspension) are temperature dependent. When the optical density of the film is measured with respect to air, it increases with temperature.29 However, when the unirradiated film at that temperature is subtracted as background, and only the increase in OD of the newly formed polymers is measured, this ΔOD shows a decrease with temperature. It is possible that the absorption coefficients or reflection coefficients of the other components in the film increase with temperature, while the absorption and reflection coefficient of the polymer suspension decrease with temperature. For real-time measurements, only the ΔOD due to newly formed polymers is relevant to the dose, as the optical properties of the film immediately prior to irradiation are subtracted. However, for other uses of the radiochromic film, understanding how the optical properties vary with temperature may be important. To resolve this issue, temperature dependence of absorbance spectra as well as individual components should be investigated using a developed irradiated film, where optical density is no longer increasing significantly with time for the duration of the experiment. This type of experiment will be useful in understanding these materials, but is outside of the scope of this article, which primarily focuses on real-time use of the radiochromic medium.
Absorbance and sensitivity dependence on water content
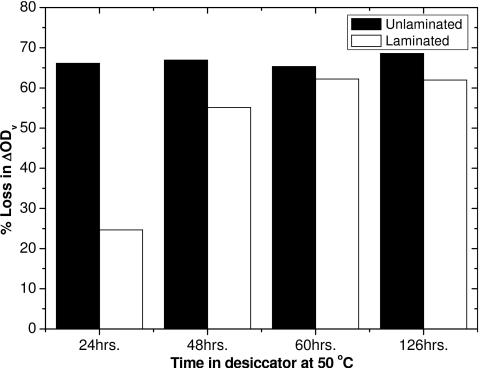
When films containing the lithium salt of pentacosa-10,12-diynoic acid as the active component are desiccated they undergo a significant change in sensitivity. The change in visual density (ΔODv) for regular (laminated) GAFCHROMIC® EBT film and the unlaminated film A are shown in Fig. 10, plotted as percent loss in sensitivity compared to the ΔODv for nondesiccated films. It can be seen that the loss of sensitivity for the unlaminated film A occurs much faster (within 24 h), dropping by approximately 66%, but thereafter remains stable. In comparison, the sensitivity of the regular laminated EBT film decreases by roughly 25% after 24 h. It continues to lose sensitivity at longer times, stabilizing at just over 60% decrease in sensitivity at 60 h. In the unlaminated film the active layer is coated on one side of a polyester substrate and exposed to the environment. In the regular EBT film the active layer is protected on both sides by the polyester substrate. Presumably, the laminated film loses water from the sensitive layer more slowly because moisture must diffuse through polyester or through the active layer and out the sides. The permeability of polyester to water vapor is about 1.5×10⁻⁸ cm3 cm∕(cm2 s kPa).33 This is more than two orders of magnitude less than the value of 8.6×10⁻⁶ cm3 cm∕(cm2 s kPa) reported for mammalian gelatin.31 The active layers in EBT film are composed of about 60% gelatin and 40% active component. Since the active component is significantly more hydrophobic than gelatin, the permeability of the active layer to water is expected to be less than that of gelatin alone.
Figure 10.
Percent decrease in ΔODv for a 3 Gy dose, following different times in a desiccator at 50 °C.
Because the polyester is relatively thin (97 μm), loss of water through the polyester of the film samples will not be negligible even though the permeability of polyester is much lower than gelatin The EBT samples were about 2.5 cm×2.5 cm, therefore loss of moisture from the center to the sides is also slow. The distance over which a water molecule must diffuse from center to edge is 1.25 cm (i.e., a distance about 130× greater than the distance through the polyester) partially offsetting the higher permeability of gelatin.
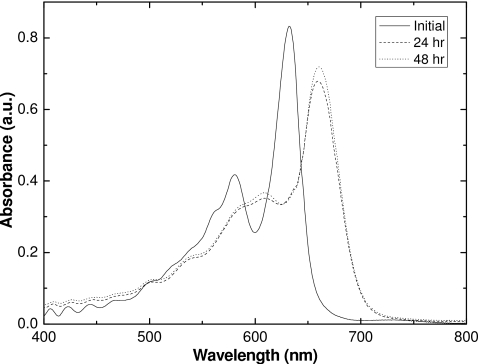
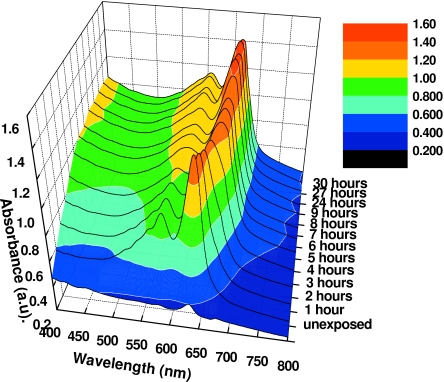
Since the sensitivity of the films containing the lithium salt of PCDA as the active component change so dramatically when desiccated, we believe that water molecules are an integral part of the molecular structure. Further evidence for this can be seen in the changes in the spectral absorbance of the lithium PCDA polymer when irradiated film samples are desiccated. Figure 11 shows the changes in the absorbance spectra of exposed unlaminated film A after desiccation at 50 °C. The changes in the absorption spectrum occur within 24 h. The absorbance peaks do not shift on further desiccation thereafter. Figure 12 also illustrates this transition from hydrated to desiccated form at shorter time intervals. Seemingly, at 4 h both forms exist, and after 5 h at this temperature, the active component is desiccated.
Figure 11.
Spectral comparisons of absorbance of desiccated and initial unlaminated EBT film.
Figure 12.
Absorbance of unlaminated EBT film after time in desiccator at 50 °C (arbitrary dose, equivalent to about 10 Gy, but delivered using 254 nm UV light).
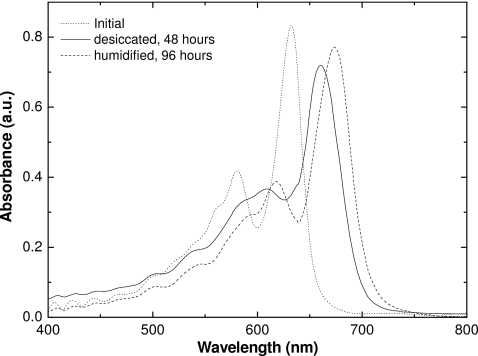
When the desiccated film is reintroduced to a humid environment, the sensitive layer absorbs water. However, instead of reverting to the spectrum prior to desiccation, a further shift to longer wavelength occurs (Fig. 13). We believe this signifies reintegration of water into the molecular structure. Because the spectral absorbance differs from that prior to desiccation, we believe that the conformation and structure of the polydiactylene after rehydration differs from that prior to desiccation.
Figure 13.
Spectral comparisons of absorbance of desiccated, rehydrated, and normal unlaminated EBT film irradiated to 3 Gy.
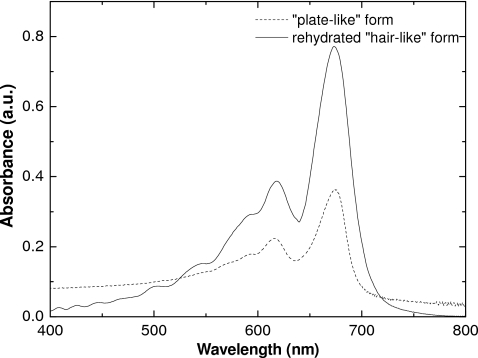
It has also been found that the visible absorption spectra of the diacetylene polymers formed by radiation exposure of the two particle forms are different. The polymer from the hair-like form exhibits two peaks with the principal peak having an absorbance maximum at about 635 nm. The spectra of polymer from the plate-like form is qualitatively similar, but the main peak is at approximately 670 nm.
Figure 14 shows absorbance spectra for the plate-like form of polymerized lithium PCDA superimposed on the spectrum of the polymerized hair-like form after desiccation and rehydration. This rehydrated hair-like form has similar absorbance maxima as the unlaminated film B, that contains the plate-like arrangement of the active component. We take this to indicate that the structure of the polymerized diacetylene is the same in each.
Figure 14.
Absorbance spectra of exposed unlaminated films using plate-like form of polymer and the rehydrated form of hair-like polymer.
The data suggest that water is an important part of the structure of the monomers and polymers formed from the hair-like and plate-like of lithium pentacosa-10,12-diynoic acid. It is likely that water molecules are important in establishing the molecular structure of the hair-like form and that in this form the spacing and orientation of the diacetylene units (LiPCDA) in adjacent diacetylene molecules is at least partly responsible for the high sensitivity observed for EBT. When the polymerized hair-like form loses water, it undergoes a reconfiguration. The spectral shift suggests that the conjugated polymer backbone has undergone a twisting leading to a change in the molecular π-orbital system, which is formed from an overlap of electrons in atomic p orbitals.32 When this desiccated polymer is then exposed to moisture, the water molecules are reintroduced in the polymer structure with further changes in the molecular configuration. It appears that the resulting structure may be similar to the plate-like form of the lithium PCDA.
Although outside the scope of this article, some brief comments on the importance of state of hydration of these films during conventional dosimetry should be made. First, the above results show the importance of state of hydration on the structure of the diacetylene molecules, and thus on their ability to polymerize. Since the state of hydration can be altered by various events, such as elevated temperatures or time in a desiccator, it is important to know the history of the dosimeters prior to their use. Furthermore, it is important to calibrate each batch separately, even if the sensitivity difference between batches is low, as they may have different histories. The time between calibration and use of the dosimeter should also be short enough to not allow significant change in the state of hydration of the remainder of the batch, although the above results indicate that drastic steps would need to be taken to greatly alter the films’ response. And last, these results may have implications on the dosimetric procedure undertaken, as small pieces of films left for a long time are more likely to dehydrate than films left as manufactured. Although these effects would be small and likely negligible over short periods of time, persons using these dosimeters should be aware of the possible complications if care is not taken to keep them at reasonable environmental conditions.
CONCLUSION
Real-time ΔOD of GAFCHROMIC® EBT film (measured over 630–640 nm, corresponding to the main absorbance peak at 22 °C, using unirradiated film as background) for 1 Gy dose was shown to decrease by more than 10% when the temperature was increased from 22 to 38 °C. This decrease could not be attributed to a decrease in wavelength of maximum change in absorbance, λmax. A correction algorithm, using the shifting position of λmax with temperature and a temperature-dependent correction factor, was tested, but showed only moderate improvement over using a 10 nm range centered about λmax. The decrease in ΔOD is suspected to be due to a decrease in absorption coefficient of the polymers with increase in temperature, but requires verification. The sensitivity of EBT to ionizing radiation was shown to also be a function of the hydration of the sensitive layer. Water influences the three-dimensional structure of the monomer crystals and desiccating the samples shifted both the absorbance peak to a higher wavelength and decreased sensitivity. Rehydrating the samples created an alternate three-dimensional arrangement seemingly similar to that observed in MD-55 film, the predecessor to EBT film, along with a similar position in λmax and sensitivity to radiation.
ACKNOWLEDGMENTS
The authors would like to thank Matt Filletti and Jason Smale of Princess Margaret Hospital for their work on the phantom, Dr. Kai Zhang of the Laboratory for Applied Biophotonics for fibercoupling the LED, and also Shelley Shih and Xiang Yu of the Advanced Materials Group of International Specialty Products. This work was in part funded by Research Studentship of The Terry Fox Foundation through an Award No. 016646 from the National Cancer Institute of Canada, Scace Prostate Cancer Award, National Institutes of Health∕National Institute on Aging (No. R21∕R33 AG19381), and by the Fidani Center for Radiation Physics.
References
- Maryanski M. J., Ibbott G. S., Eastman P., Schulz R. J., and Gore J. C., “Radiation therapy dosimetry using magnetic resonance imaging of polymer gels,” Med. Phys. 10.1118/1.597717 23, 699–705 (1996). [DOI] [PubMed] [Google Scholar]
- Low D. A., Dempsey J. F., Venkatesan R., Mutic S., Markman J., Haacke E. M., and Purdy J. A., “Evaluation of polymer gels and MRI as a 3-D dosimeter for intensity modulated radiation therapy,” Med. Phys. 10.1118/1.598650 26, 1542–1551 (1999). [DOI] [PubMed] [Google Scholar]
- Berg A., Ertl A., and Moser E., “High resolution polymer gel dosimetry by parameter selective MR-microimaging on a whole body scanner at 3 T,” Med. Phys. 10.1118/1.1358304 28, 833–843 (2001). [DOI] [PubMed] [Google Scholar]
- Wuu C. S., Schiff P., Maryanski M. J., Liu T., Borzillary S., and Weinberger J., “Dosimetry study of Re-188 liquid balloon for intravascular brachytherapy using polymer gel dosimeters and laser-beam optical CT scanner,” Med. Phys. 10.1118/1.1533749 30, 132–137 (2003). [DOI] [PubMed] [Google Scholar]
- Oldham M., Siewerdsen J. H., Kumar S., Wong J., and Jaffray D. A., “Optical-CT gel dosimetry I: Basic investigations,” Med. Phys. 10.1118/1.1559835 30, 623–634 (2003). [DOI] [PMC free article] [PubMed] [Google Scholar]
- Chiu-Tsao S., Duckworth T. L., Patel N. S., Pisch J., and Harrison L. B., “Verification of Ir-192 near source dosimetry using GAFCHROMIC film,” Med. Phys. 10.1118/1.1637733 31, 201–207 (2004). [DOI] [PubMed] [Google Scholar]
- Hirata E. Y., Cunningham C., Micka J. A., Keller H., Kissick M. W., and De Werd L. A., “Low dose fraction behavior of high sensitivity radiochromic film,” Med. Phys. 10.1118/1.1883565 32, 1054–1060 (2005). [DOI] [PubMed] [Google Scholar]
- Devic S., Seuntjens J., Sham E., Podgorsak E. B., Schmidtlein C. R., Kirov A. S., and Soares C. G., “Precise radiochromic film dosimetry using a flat-bed document scanner,” Med. Phys. 10.1118/1.1929253 32, 2245–2253 (2005). [DOI] [PubMed] [Google Scholar]
- Butson M. J., Yu P. K. N., Cheung T., and Metcalfe P. E., “Radiochromic film for medical radiation dosimetry,” Mater. Sci. Eng., R. 10.1016/S0927-796X(03)00034-2 R41, 61–120 (2003). [DOI] [Google Scholar]
- McLaughlin W. L., Chen Y.-D., Soares C. G., Miller A., Van Dyk G., and Lewis D. F., “Sensitometry of the response of a new radiochromic film dosimeter to gamma radiation and electron beams,” Nucl. Instrum. Methods Phys. Res. A 10.1016/0168-9002(91)90506-L 302, 165–176 (1991). [DOI] [Google Scholar]
- Rink A., Vitkin I. A., and Jaffray D., “Suitability of radiochromic medium for real-time optical measurements of ionizing radiation dose,” Med. Phys. 10.1118/1.1877832 32, 1140–1155 (2005). [DOI] [PubMed] [Google Scholar]
- Rink A., Vitkin I. A., and Jaffray D. A., “Characterization and real-time optical measurements of the ionizing radiation dose response for a new radiochromic medium,” Med. Phys. 10.1118/1.1951447 32, 2510–2516 (2005). [DOI] [PubMed] [Google Scholar]
- Rink A., Vitkin I. A., and Jaffray D. A., “Energy dependence (75 kVp to 18 MV) of radiochromic films assessed using a real-time optical dosimeter,” Med. Phys. 10.1118/1.2431425 34, 458–463 (2007). [DOI] [PubMed] [Google Scholar]
- Butson M. J., Cheung T., and Yu P. K. N., “Weak energy dependence of EBT gafchromic film dose response in the 50 kVp–10 MVp x-ray range,” Appl. Radiat. Isot. 10.1016/j.apradiso.2005.07.002 64, 60–62 (2006). [DOI] [PubMed] [Google Scholar]
- Chiu-Tsao S., Ho Y., Shankar R., Wang L., and Harrison L. B., “Energy dependence of response of new high sensitivity radiochromic films for megavoltage and kilovoltage radiation energies,” Med. Phys. 10.1118/1.2065467 32, 3350–3335 (2005). [DOI] [PubMed] [Google Scholar]
- Todorovic M., Fischer M., Cremers F., Thom E., and Schmidt R., “Evaluation of GafChromic EBT prototype B for external beam dose verification,” Med. Phys. 10.1118/1.2188077 33, 1321–1328 (2006). [DOI] [PubMed] [Google Scholar]
- Fuss M., Sturtewagen E., De Wagter C., and Georg D., “Dosimetric characterization of GafChromic EBT film and its implication on film dosimetry quality assurance,” Med. Phys. 10.1088/0031-9155/52/14/013 52, 4211–4225 (2007). [DOI] [PubMed] [Google Scholar]
- Ali I., Costescu C., Vicic M., Dempsey J. F., and Williamson J. F., “Dependence of radiochromic film optical density post-exposure kinetics on dose and dose fractionation,” Med. Phys. 10.1118/1.1587611 30, 1958–1967 (2003). [DOI] [PubMed] [Google Scholar]
- Ali I., Williamson J. F., Costescu C., and Dempsey J. F., “Dependence of radiochromic film response kinetics on fractionated doses,” Appl. Radiat. Isot. 10.1016/j.apradiso.2004.07.014 62, 609–617 (2005). [DOI] [PubMed] [Google Scholar]
- Rink A., Vitkin I. A., and Jaffray D. A., “Intra-irradiation changes in the signal of polymer-based dosimeter (GAFCHROMIC EBT) due to dose rate variations,” Phys. Med. Biol. 10.1088/0031-9155/52/22/N03 52, N523–N529 (2007). [DOI] [PubMed] [Google Scholar]
- Chu R. D. H., Van Dyk G., Lewis D. F., O’Hara K. P. J., Buckland B. W., and Dinelle F., “GafChromic dosimetry media: A new high dose, thin film routine dosimeter and dose mapping tool,” Radiat. Phys. Chem. 35, 767–773 (1990). [Google Scholar]
- Guillet J., “Photopolymerization,” in Polymer Photophysics and Photochemistry: An Introduction to the Study of Photoprocesses in Macromolecules (Cambridge University Press, New York, 1985), pp. 295–313. [Google Scholar]
- Baughman R. H., “Solid-state synthesis of large polymer single crystals,” J. Polym. Sci., Part B: Polym. Phys. 12, 1511–1535 (1974). [Google Scholar]
- Baughman R. H. and Yee K. C., “Solid-state polymerization of linear and cyclic acetylenes,” J. Polym. Sci. Macromol. Rev. 13, 219–239 (1978). [Google Scholar]
- Tsibouklis J., Pearson C., Song Y. P., Warren J., Petty M., Yarwood J., Petty M. C., and Feast W. J., “Pentacosa-10,12-diynoic acid/Henicosa-2,4-diynylamine alternate-layer Langmuir–Blodgett films: Synthesis, polymerization and electrical properties,” J. Mater. Chem. 10.1039/jm9930300097 3, 97–104 (1993). [DOI] [Google Scholar]
- Saylor M. C., Tamargo T. T., and McLaughlin W. L., “A thin film recording medium for use in food irradiation,” Radiat. Phys. Chem. 31, 529–536 (1988). [Google Scholar]
- Mack A., Mack G., Weltz D., Scheib S. G., Böttcher H. D., and Seifert V., “High precision film dosimetry with GafChromic® films for quality assurance especially when using small fields,” Med. Phys. 10.1118/1.1593634 30, 2399–2409 (2003). [DOI] [PubMed] [Google Scholar]
- Klassen N. V., van der Zwan L., and Cygler J., “GafChromic MD-55: Investigated as a precision dosimeter,” Med. Phys. 10.1118/1.598106 24, 1924–1934 (1997). [DOI] [PubMed] [Google Scholar]
- Lynch B. D., Kozelka J., Ranade M. K., Li J. G., Simon W. E., and Dempsey J. F., “Important considerations for radiochromic film dosimetry with flatbed CCD scanners and EBT GAFCHROMIC® film,” Med. Phys. 10.1118/1.2370505 33, 4551–4556 (2006). [DOI] [PubMed] [Google Scholar]
- Reinstein L. E. and Gluckman G. R., “Predicting optical densitometer response as a function of light source characteristics for radiochromic film dosimetry,” Med. Phys. 10.1118/1.598107 24, 1935–1942 (1997). [DOI] [PubMed] [Google Scholar]
- Avena Bustillos R., Olsen C., Olsen D., Chiou B., Yee E., Bechtel P., and McHugh T., “Water vapor permeability of mammalian and fish gelatin films,” J. Food. Sci. 71, E202–E207 (2006). [DOI] [PubMed] [Google Scholar]
- “The molecular-orbital theory of electronic structure and the spectroscopic properties of diatomic molecules,” in Chemical Structure and Bonding, edited by DeKock R. L. and Gray H. B. (University Science Books, Sausalito, 1989), pp. 183–271. [Google Scholar]
- http://www.goodfellow.com/csp/active/static/e/polyethylene_terephthalate.html.


