

Abstract
Urea plays a critical role in the concentration of urine, thereby regulating water balance. Vasopressin, acting through cAMP, stimulates urea transport across rat terminal inner medullary collecting ducts (IMCD) by increasing the phosphorylation and accumulation at the apical plasma membrane of UT-A1. In addition to acting through protein kinase A (PKA), cAMP also activates Epac (exchange protein activated by cAMP). In this study, we tested whether the regulation of urea transport and UT-A1 transporter activity involve Epac in rat IMCD. Functional analysis showed that an Epac activator significantly increased urea permeability in isolated, perfused rat terminal IMCD. Similarly, stimulating Epac by adding forskolin and an inhibitor of PKA significantly increased urea permeability. Incubation of rat IMCD suspensions with the Epac activator significantly increased UT-A1 phosphorylation and its accumulation in the plasma membrane. Furthermore, forskolin-stimulated cAMP significantly increased ERK 1/2 phosphorylation, which was not prevented by inhibiting PKA, indicating that Epac mediated this phosphorylation of ERK 1/2. Inhibition of MEK 1/2 phosphorylation decreased the forskolin-stimulated UT-A1 phosphorylation. Taken together, activation of Epac increases urea transport, accumulation of UT-A1 at the plasma membrane, and UT-A1 phosphorylation, the latter of which is mediated by the MEK–ERK pathway.
Urea plays a crucial role in the urinary concentrating mechanism, and therefore, in the regulation of water balance. Urea's importance to the generation of a concentrated urine has been appreciated since at least 1934.1,2 Several studies have shown that maximal urine concentrating ability is decreased in protein-deprived mammals and is restored by urea infusion.3 More recently, a UT-A1/UT-A3 knock-out mouse,4,5 a UT-A2 knock-out mouse,6 and a UT-B knock-out mouse7–9 were each shown to have urine concentrating defects. Thus, any hypothesis regarding the mechanism by which the kidney concentrates urine needs to include some effect derived from urea.
The UT-A1 urea transporter is expressed in the terminal inner medullary collecting duct (IMCD).10 Vasopressin stimulates urea transport across perfused rat terminal IMCDs by increasing UT-A1 phosphorylation and apical plasma membrane accumulation.11–15 Vasopressin acts by binding to V2 receptors in the basolateral plasma membrane, stimulating adenylyl cyclase, increasing cAMP production, and increasing urea transport.11,16–18 Forskolin, which directly activates adenylyl cyclase,19 also increases urea transport in perfused rat terminal IMCDs.20
cAMP is traditionally thought to act through protein kinase A (PKA). However, when we stimulate the PKA activity by increasing cAMP with forskolin in MDCK cells that are stably transfected with UT-A1 (UT-A1-MDCK cells), only 50% of the forskolin-stimulated urea flux is inhibited by H-89, a PKA inhibitor.21 Vasopressin and forskolin work in a similar manner to increase the cAMP levels, so this partial inhibition by H-89 suggests that vasopressin may signal through two cAMP-dependent pathways: one involving PKA and one that is independent of PKA. Because the UT-A1-MDCK cells reproduce many of the properties of native rat IMCDs,13,21,22 these findings raise the possibility that vasopressin may signal through a second cAMP-dependent, but non–PKA-dependent, pathway in rat IMCDs.
In addition to PKA, cAMP can activate Epac (exchange protein activated by cAMP), which signals by activating Rap1, a Ras-related small molecular weight G protein, which in turn signals through mitogen-activated protein kinase kinase (MEK) and extracellular signal-related kinase (ERK)23,24 (Figure 1). There are two closely related exchange proteins activated by cAMP (Epac) proteins, Epac1 and Epac2, and both have been detected in rat IMCDs, although one or the other predominates in different studies.25–28 The purpose of this study was to determine whether activation of the Epac pathway resulted in a functional change in urea transport in perfused rat terminal IMCDs.
Figure 1.

Vasopressin signaling diagram.
Results
Urea Permeability
To determine whether stimulation of the Epac pathway has a functional effect, urea permeability was measured in perfused rat terminal IMCDs. Urea permeability was significantly increased by 29% from 31 ± 5 to 40 ± 5 × 10⁻⁵ cm/s by addition of the Epac activator Sp-8-pCPT-2′-O-Me-cAMPS (200 μM) to the bath solution (n = 4, P < 0.02; Figure 2A). To ensure that the increase in urea permeability was related to the addition of the Epac activator and not treatment time, we performed a time control study in which urea permeability was measured in the presence of vehicle (0.5% DMSO) only during the second period. Figure 2B shows that there was no change in urea permeability (30 ± 12 versus 31 ± 12 × 10−5 cm/s, n = 4, P = not significant) with vehicle alone.
Figure 2.

Activation of the Epac pathway increases urea permeability of terminal inner medullary collecting ducts. (A) Urea permeability changes from the permeability in 0.5% DMSO alone (vehicle) to the permeability after 20-min activation of the Epac pathway with 200 μM Sp-8-pCPT-2′-O-Me-cAMPS (Epac + vehicle). Each line represents a separate IMCD from a different rat. (B) Vehicle control for the activator treatment. Provided is the urea permeability over time when exposed only to vehicle (0.5% DMSO) for the 20 min of treatment time. Significance: (A) *P < 0.05; (B) n.s. = not statistically different.
As a second means to stimulate Epac, forskolin was added after inhibiting PKA with H-89 (Figure 1). Basal urea permeability was unaffected by adding 5 μM H-89 (21 ± 3 to 20 ± 4 × 10⁻⁵ cm/s, n = 5, P = NS; Figure 3). Subsequent addition of 10 μM forskolin (with H-89 present) to the bath significantly increased urea permeability by 115% to 43 ± 7 × 10⁻⁵ cm/s (n = 5, P < 0.01; Figure 3).
Figure 3.

Activation of Epac by initially blocking PKA and then stimulating cAMP with forskolin increases urea permeability of terminal inner medullary collecting ducts. Adding 5 μM H-89, a PKA inhibitor, had no effect on basal urea permeability. Subsequent addition of 10 μM forskolin (Fsk) to the bath significantly increased urea permeability. Each line represents a separate IMCD from a different rat. Significance: *P < 0.05; n.s. = not statistically different.
UT-A1 Protein
To determine whether the increased urea permeability in response to Epac stimulation might reflect an increase in UT-A1–mediated urea transport, we first determined whether Epac stimulation resulted in an increase in UT-A1 accumulation in the plasma membrane using fresh suspensions of rat IMCDs. Biotinylated UT-A1 increased by 47% from 38 ± 4 to 55 ± 6 arbitrary units (n = 9, P < 0.03) after Epac stimulation (Figure 4).
Figure 4.
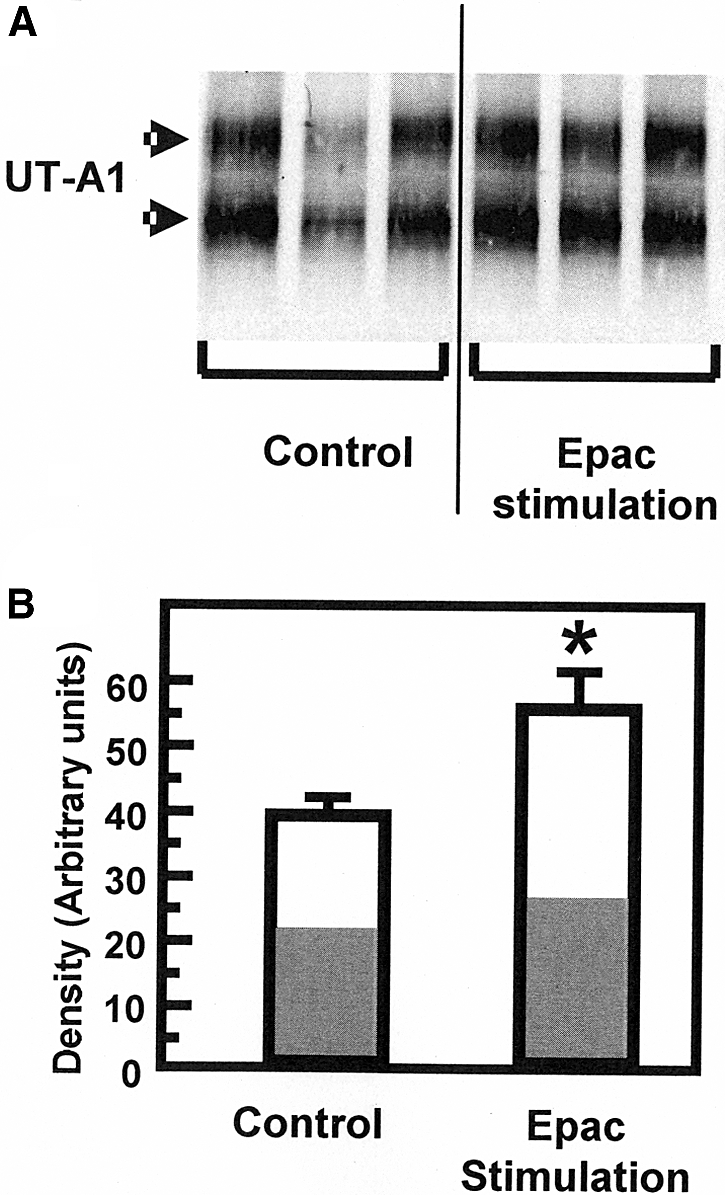
UT-A1 is accumulated in the plasma membrane in response to Epac stimulation. (A) Representative Western blot of biotinylated UT-A1 in IMCDs incubated with and without the Epac stimulant Sp-8-pCPT-2′-O-Me-cAMPS (75 μM) for 30 min. Arrows indicate UT-A1 bands at 97 and 117 kD. (B) Bar graph showing the UT-A1 densitometry results of three separate experiments with a total of nine animals per group presented as density in arbitrary units with SEM bars. There was a 47% increase in the amount of biotinylated UT-A1 (from 38 ± 4 to 55 ± 6 arbitrary units, n = 9) after stimulation with the Epac activator. Bars = mean ± SEM; *P < 0.05. The white portion of each bar indicates the percent of the density caused by the 117-kD band and the gray portion represents percent caused by the 97-kD band.
We next tested whether Epac stimulation altered the phosphorylation state of UT-A1 by metabolically labeling fresh suspensions of rat IMCDs with 32P-orthophosphate. The Epac activator increased UT-A1 phosphorylation by 91 ± 37% from a ratio of 78 to 151 arbitrary density units of phosphorylation per unit protein (n = 8, P < 0.05; Figure 5).
Figure 5.
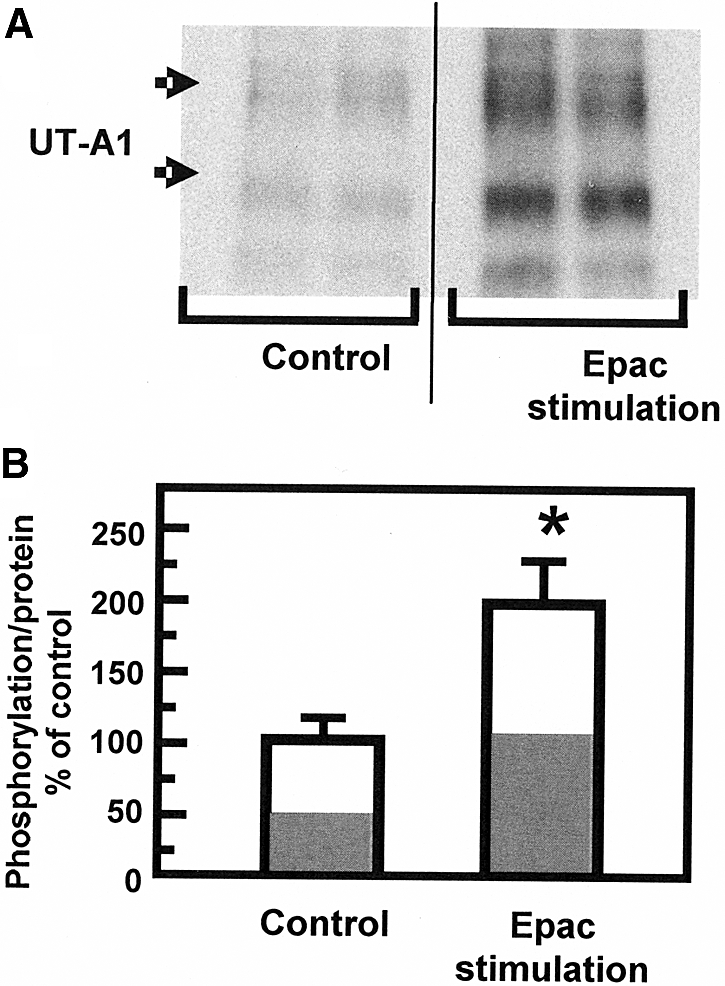
UT-A1 is phosphorylated on stimulation by Epac. (A) Representative autoradiogram of immunoprecipitated UT-A1 from 32P-labeled IMCDs that were exposed to 75 μM Epac stimulant. Arrows indicate UT-A1 bands at 97 and 117 kD. (B) Bar graph showing combined results. The phosphorylation of both 117- and 97-kD isoforms of UT-A1 under control conditions was increased by 91 ± 37% (n = 8) in the presence of the Epac stimulator. Data: 32P-UT-A1/total UT-A1 presented as percent above average control (set to 100%). Bars = mean ± SEM; *P < 0.05. The white portion of each bar indicates the percent of the density caused by the 117-kD band and the gray portion represents percent caused by the 97-kD band.
Epac Signals Through ERK
To ensure that the effect of the Epac activator was specific for the Epac pathway and was not influencing the PKA pathway, we determined the abundance of phospho-CAMP response element-binding protein (CREB) in IMCD suspensions that were treated with the Epac stimulator. Phospho-CREB is phosphorylated exclusively by PKA.29 When we stimulated the cAMP pathway with forskolin, we saw an increase in phospho-CREB (Figure 6). However, we did not see an increase in phospho-CREB when we added the Epac activator, confirming the specificity of the Epac activator in rat IMCD suspensions (Figure 6).
Figure 6.

The Epac activator does not alter the abundance of phospho-CREB in IMCD suspensions. Phospho-CREB was determined in Western blots using an antibody to the phosphoprotein (left panels) or total CREB (data not shown). The samples were lysates from inner medullary collecting duct suspensions that were treated with forskolin or Epac stimulator for 30 min and then solubilized in 1% SDS, sheared, and electrophoresed. The Western blots provide three representative samples per condition. The bar graph provides the percent change in the ratio of phospho-CREB to total CREB with each treatment relative to the untreated controls. The bars provide the mean ± SEM; n = 7 for forskolin, n = 4 for Epac stimulator, n = 11 for control. *P < 0.05 relative to control.
Next, we determined whether treating rat IMCD suspensions with forskolin results in stimulation of the Epac pathway. Phosphorylation of ERK 1/2 is a consequence of Epac stimulation.24 Figure 7A shows that forskolin stimulates ERK 1/2 phosphorylation by 25% (n = 7, P < 0.05). The increase in ERK 1/2 phosphorylation is not inhibited by the PKA inhibitor, H-89, indicating that forskolin stimulates ERK 1/2 phosphorylation through Epac and not PKA. This result is consistent with findings in nonrenal cells.30–32
Figure 7.

Forskolin stimulates the Epac pathway in the IMCDs. (A) Phosphorylation of ERK 1/2. (Left) Representative Western blot of lysates from suspended IMCDs treated with forskolin (Fsk) with or without PKA inhibitor H-89 (Fsk+H-89), MEK 1/2 inhibitor U0126 (Fsk+U0126), or its inactive analog U0124 (Fsk+U0124). Blots were probed with an antibody to phospho-ERK (p-ERK). Arrows indicate p-ERK bands at 41 and 42 kD. (Right) Bar graph comparing control group to forskolin treatment (Fsk) and forskolin in the presence of U0126 (Fsk+U0126). Graph combines the results of five separate experiments (n = 7 rats/condition). *P < 0.05 versus control. (B) Phosphorylation of UT-A1. (Left) Autoradiogram of immunoprecipitated radiolabeled UT-A1, identified by arrows. Phosphorylation of UT-A1 was increased by 57 ± 15% by forskolin (versus control), and this phosphorylation was decreased to 62 ± 8% of control levels by U0126. U0126 alone reduced basal phosphorylation levels by 30 ± 23%. These data are representative of three separate experiments. (Right) Bar graph combining the results of three separate experiments (n = 4 rats/condition). *P < 0.05 versus control.
To further examine this pathway, we tested the effect of a MEK 1/2 inhibitor, U0126, because it effectively inhibits ERK 1/2 phosphorylation.24 U0126 inhibited forskolin-stimulation of ERK 1/2 phosphorylation by 72% (n = 7, P < 0.01; Figure 7A). As a control, we tested the effect of the inactive compound U0124 and found that it did not inhibit forskolin stimulation of ERK 1/2 phosphorylation.
Finally, we determined whether inhibition of the MEK-ERK pathway by U0126 would inhibit forskolin stimulation of UT-A1 phosphorylation. U0126 inhibited forskolin stimulation of UT-A1 phosphorylation from 157 ± 15 to 62 ± 8% of control phosphorylation levels (100%; n = 4 animals per group, P < 0.05; Figure 7B).
Discussion
The major finding in this study is that activation of the Epac pathway results in a functional change in urea transport in perfused rat terminal IMCDs. The increase in urea transport results, at least in part, from Epac-stimulated increases in UT-A1 phosphorylation and plasma membrane accumulation. To our knowledge, this is the first demonstration that the Epac pathway regulates urea transport in the kidney.
We used two different approaches to stimulate Epac: direct activation using the Epac activator Sp-8-pCPT-2′-O-Me-cAMPS and blocking PKA with H-89 and then activating cAMP with forskolin, which should primarily activate Epac (Figure 1). Both approaches significantly increased urea permeability, although the percent increase was less than with vasopressin.11 However, vasopressin stimulates both PKA and Epac. Because activation of Epac alone results in a smaller stimulation of urea permeability than vasopressin, this suggests that maximal stimulation of urea transport requires activation of both the PKA and Epac pathways by vasopressin.
The percent increases in biotinylated UT-A1 (47%) and phosphorylated UT-A1 (91%) were between the percent increases in urea transport in response to Sp-8-pCPT-2′-O-Me-cAMPS (29%) and H-89/forskolin (115%). We do not know why the percent increases differ. One possibility is a difference in Epac activation by Sp-8-pCPT-2′-O-Me-cAMPS versus H-89/forskolin. This could be related to differences in the ability of these compounds to enter the IMCD cells. Similarly, there may be a difference in Epac activation by Sp-8-pCPT-2′-O-Me-cAMPS when added to the bath of a perfused IMCD versus addition to a preparation of suspended IMCDs. Finally, we cannot exclude the possibility that that H-89 did not inhibit 100% of PKA activity, and if so, that some of the subsequent stimulation by forskolin may have occurred through PKA, in addition to Epac.
The Epac signaling pathway has been shown to regulate transport of a few other molecules or ions. In lung cells, dopamine stimulates Epac, which in turn stimulates sodium transport through the epithelial sodium channel; this stimulation involves the MEK–ERK pathway.24 In rat cortical collecting ducts (CCDs), calcitonin stimulates Epac, which in turn stimulates H,K-ATPase; this stimulation also involves the MEK–ERK pathway.26 In mpkCCDc14 cells, vasopressin stimulates Epac, which in turn stimulates aquaporin-2 expression; this stimulation involves the MEK–ERK pathway.33 In rat IMCDs, vasopressin stimulates Epac, which in turn stimulates aquaporin-2 accumulation in the apical plasma membrane; this stimulation involves an increase in intracellular calcium.28 Finally, in opossum kidney cells and brush-border membranes from mouse proximal tubules, cAMP stimulates Epac, which in turn inhibits sodium-proton exchanger 3 activity.27
A recent study of components of the vasopressin signaling network in rat IMCDs showed that the MEK–ERK pathway was part of this network.34 However, this study found that cAMP decreased the phosphorylation of MEK 1/2 and ERK 1/2.34 Vasopressin was also shown to decrease ERK 1/2 phosphorylation in MDCK cells.35 Another study found no effect of vasopressin on ERK 1/2 phosphorylation in mouse cortical collecting ducts.36 In contrast, we found that forskolin stimulates ERK 1/2 phosphorylation, similar to the studies in lung cells, rat CCDs, and mpkCCDc14 cells cited above.24,28,33 We also found that a MEK 1/2 inhibitor reduced Epac-stimulation of UT-A1 phosphorylation. We do not have an explanation for the different responses of ERK 1/2 phosphorylation to vasopressin in these various studies. EGF stimulation also phosphorylates ERK in rat the IMCD,37 but it is not known if it stimulates urea permeability.
In conclusion, these studies showed that activation of Epac increases urea transport, UT-A1 phosphorylation, and UT-A1 plasma membrane accumulation. The increase in UT-A1 phosphorylation involves the MEK–ERK pathway. These findings suggest that there are two cAMP-dependent signaling pathways in the rat IMCD that increase urea transport: one through PKA and one through Epac–MEK–ERK.
Concise Methods
Animals
All animal protocols were approved by the Emory University Institutional Animal Care and Use Committee. Male Sprague-Dawley rats (Charles River Laboratories, Wilmington, MA), weighing 50 to 75 g for IMCD perfusion studies and 100 to 150 g for IMCD suspensions, received free access to water and standard rat chow (Purina).
Tubule Perfusion
Terminal IMCDs were dissected, mounted on glass pipettes, and perfused as described previously.11,38 To measure basal urea permeability, three collections were made 45 min after warming the tubules to 37°C.11,38 Next, an activator of the Epac pathway (Sp-8-pCPT-2′-o-methyl-cAMPS, 200 μM final concentration) or vehicle was added to the bath solution. After a 20-min equilibration period, three collections were made. Collected solutions were assayed for urea content by ultramicrofluorometry.38 Urea flux was calculated as described previously.11,38
As a second means to stimulate Epac, forskolin was added after PKA was inhibited with H-89. Basal urea permeability was measured first. Next, H-89 (5 μM) was added to the bath, and urea permeability was measured. Third, forskolin (10 μM) was added to the bath (with H-89 still present), and urea permeability was measured.
Biotinylation
Kidneys were removed, and the inner medulla was collected. Fresh suspensions of rat IMCDs were prepared as described previously.12–15 After washing the IMCDs free of digestion enzymes, they were resuspended in 1 ml of treatment buffer (biotinylation buffer without biotin: 215 mM NaCl, 4 mM KCl, 1.2 mM MgSO4, 2 mM CaCl2, 5.5 mM glucose, 10 mM triethanolamine, 2.5 mM Na2HPO4) and treated with the Epac activator (75 μM) or vehicle for 30 min at 37°C. IMCD membrane proteins were biotinylated, and the biotinylated protein fraction was collected as described previously.13–15 We previously showed that this biotinylation protocol identifies the apical plasma membrane.13
Phosphorylation
Inner medullas, sectioned into small pieces (20 pieces), were metabolically labeled with 32P-orthophosphate for 3 h as described previously.12 The tissue was incubated for a further 30 min with 75 μM Epac activator or vehicle. UT-A1 was immunoprecipitated from the radiolabeled tissue samples as described previously.12 Precipitated proteins were separated by SDS-PAGE, and radiolabeled UT-A1 was determined by autoradiography of the dried gel. Parallel Western blots were performed to ensure uniform protein content per lane (data not shown).
Western Blot Analysis
Proteins (20 μg/lane) were size separated by SDS-PAGE and analyzed by Western blotting as detailed previously.39 All Western blots were visualized using infrared detection with the Licor Odyssey protein analysis system.
Statistics
All data are presented as mean ± SEM. Data from tubule perfusion studies were analyzed using a paired t test. Data from other studies were analyzed using an unpaired t test (for two groups) or using an ANOVA (for more than two groups) followed by the Fisher least significant difference (protected t test).40 The criterion for statistical significance is P < 0.05.
Disclosures
None.
Acknowledgments
This work was supported by National Institutes of Health Grants R01-DK41707, P01-DK61521, and R01-DK62081.
Footnotes
Published online ahead of print. Publication date available at www.jasn.org.
References
- 1.Gamble JL, McKhann CF, Butler AM, Tuthill E:An economy of water in renal function referable to urea. Am J Physiol 109: 139–154, 1934 [Google Scholar]
- 2.Fenton RA, Chou CL, Sowersby H, Smith CP, Knepper MA:Gamble's “economy of water” revisited: Studies in urea transporter knockout mice. Am J Physiol Renal Physiol 291: F148–F154, 2006 [DOI] [PubMed] [Google Scholar]
- 3.Sands JM, Layton HE:The urine concentrating mechanism and urea transporters. In: The Kidney: Physiology and Pathophysiology, 4th Ed., edited by Alpern RJ, Hebert SC.San Diego, Academic Press, 2008, pp 1143–1178 [Google Scholar]
- 4.Fenton RA, Chou C-L, Stewart GS, Smith CP, Knepper MA:Urinary concentrating defect in mice with selective deletion of phloretin-sensitive urea transporters in the renal collecting duct. Proc Natl Acad Sci U S A 101: 7469–7474, 2004 [DOI] [PMC free article] [PubMed] [Google Scholar]
- 5.Fenton RA, Flynn A, Shodeinde A, Smith CP, Schnermann J, Knepper MA:Renal phenotype of UT-A urea transporter knockout mice. J Am Soc Nephrol 16: 1583–1592, 2005 [DOI] [PMC free article] [PubMed] [Google Scholar]
- 6.Uchida S, Sohara E, Rai T, Ikawa M, Okabe M, Sasaki S:Impaired urea accumulation in the inner medulla of mice lacking the urea transporter UT-A2. Mol Cell Biol 25: 7357–7363, 2005 [DOI] [PMC free article] [PubMed] [Google Scholar]
- 7.Yang B, Bankir L, Gillespie A, Epstein CJ, Verkman AS:Urea-selective concentrating defect in transgenic mice lacking urea transporter UT-B. J Biol Chem 277: 10633–10637, 2002 [DOI] [PubMed] [Google Scholar]
- 8.Yang B, Verkman AS:Analysis of double knockout mice lacking aquaporin-1 and urea transporter UT-B. J Biol Chem 277: 36782–36786, 2002 [DOI] [PubMed] [Google Scholar]
- 9.Klein JD, Sands JM, Qian L, Wang X, Yang B:Upregulation of urea transporter UT-A2 and water channels AQP2 and AQP3 in mice lacking urea transporter UT-B. J Am Soc Nephrol 15: 1161–1167, 2004 [DOI] [PubMed] [Google Scholar]
- 10.Nielsen S, Terris J, Smith CP, Hediger MA, Ecelbarger CA, Knepper MA:Cellular and subcellular localization of the vasopressin-regulated urea transporter in rat kidney. Proc Natl Acad Sci U S A 93: 5495–5500, 1996 [DOI] [PMC free article] [PubMed] [Google Scholar]
- 11.Sands JM, Nonoguchi H, Knepper MA:Vasopressin effects on urea and H20 transport in inner medullary collecting duct subsegments. Am J Physiol 253: F823–F832, 1987 [DOI] [PubMed] [Google Scholar]
- 12.Zhang C, Sands JM, Klein JD:Vasopressin rapidly increases the phosphorylation of the UT-A1 urea transporter activity in rat IMCDs through PKA. Am J Physiol Renal Physiol 282: F85–F90, 2002 [DOI] [PubMed] [Google Scholar]
- 13.Klein JD, Froehlich O, Blount MA, Martin CF, Smith TD, Sands JM:Vasopressin increases plasma membrane accumulation of urea transporter UT-A1 in rat inner medullary collecting ducts. J Am Soc Nephrol 17: 2680–2686, 2006 [DOI] [PubMed] [Google Scholar]
- 14.Blount MA, Klein JD, Martin CF, Tchapyjnikov D, Sands JM:Forskolin stimulates phosphorylation and membrane accumulation of UT-A3. Am J Physiol Renal Physiol 293: F1308–F1313, 2007 [DOI] [PubMed] [Google Scholar]
- 15.Blount MA, Mistry AC, Froehlich O, Price SR, Chen G, Sands JM, Klein JD:Phosphorylation of UT-A1 urea transporter at serines 486 and 499 is important for vasopressin-regulated activity and membrane accumulation. Am J Physiol Renal Physiol 295: F295–F299, 2008 [DOI] [PMC free article] [PubMed] [Google Scholar]
- 16.Star RA, Nonoguchi H, Balaban R, Knepper MA:Calcium and cyclic adenosine monophosphate as second messengers for vasopressin in the rat inner medullary collecting duct. J Clin Invest 81: 1879–1888, 1988 [DOI] [PMC free article] [PubMed] [Google Scholar]
- 17.Sands JM, Schrader DC:An independent effect of osmolality on urea transport in rat terminal IMCDs. J Clin Invest 88: 137–142, 1991 [DOI] [PMC free article] [PubMed] [Google Scholar]
- 18.Nielsen S, Knepper MA:Vasopressin activates collecting duct urea transporters and water channels by distinct physical processes. Am J Physiol Renal Fluid Electrolyte Physiol 265: F204–F213, 1993 [DOI] [PubMed] [Google Scholar]
- 19.Seamon KB, Padgett W, Daly JW:Forskolin: Unique diterpene activator of adenylate cyclase in membranes and intact cells. Proc Natl Acad Sci U S A 87: 3363–3367, 1981 [DOI] [PMC free article] [PubMed] [Google Scholar]
- 20.Gillin AG, Sands JM:Characteristics of osmolarity-stimulated urea transport in rat IMCD. Am J Physiol 262: F1061–F1067, 1992 [DOI] [PubMed] [Google Scholar]
- 21.Fröhlich O, Klein JD, Smith PM, Sands JM, Gunn RB:Regulation of UT-A1-mediated transepithelial urea flux in MDCK cells. Am J Physiol Cell Physiol 291: C600–C606, 2006 [DOI] [PubMed] [Google Scholar]
- 22.Fröhlich O, Klein JD, Smith PM, Sands JM, Gunn RB:Urea transport in MDCK cells that are stably transfected with UT-A1. Am J Physiol Cell Physiol 286: C1264–C1270, 2004 [DOI] [PubMed] [Google Scholar]
- 23.Bos JL:Epac: A new cAMP target and new avenues in cAMP research. Nat Rev Mol Cell Biol 4: 733–738, 2003 [DOI] [PubMed] [Google Scholar]
- 24.Helms MN, Chen X-J, Ramosevac S, Eaton DC, Jain L:Dopamine regulation of amiloride-sensitive sodium channels in lung cells. Am J Physiol Lung Cell Mol Physiol 291: L610–L618, 2006 [DOI] [PubMed] [Google Scholar]
- 25.Li Y, Konings IBM, Zhao J, Price LS, de Heer E, Deen PMT:Renal expression of exchange protein directly activated by cAMP (Epac) 1 and 2. Am J Physiol Renal Physiol 295: F525–F533, 2008 [DOI] [PubMed] [Google Scholar]
- 26.Laroche-Joubert N, Marsy S, Michelet S, Imbert-Teboul M, Doucet A:Protein kinase A-independent activation of ERK and H,K-ATPase by cAMP in native kidney cells. Role of Epac I. J Biol Chem 277: 18598–18604, 2002 [DOI] [PubMed] [Google Scholar]
- 27.Honegger KJ, Capuano P, Winter C, Bacic D, Stange G, Wagner CA, Biber J, Murer H, Hernando N:Regulation of sodium-proton exchanger isoform 3 (NHE3) by PKA and exchange protein directly activated by cAMP (EPAC). Proc Natl Acad Sci U S A 103: 803–808, 2006 [DOI] [PMC free article] [PubMed] [Google Scholar]
- 28.Yip KP:Epac-mediated Ca2+ mobilization and exocytosis in inner medullary collecting duct. Am J Physiol Renal Physiol 291: F882–F890, 2008 [DOI] [PubMed] [Google Scholar]
- 29.Enserink JM, Christensen AE, de Rooij J, van Triest M, Schwede F, Genieser HG, Doskeland SO, Blank JL, Bos JL:A novel Epac-specific cAMP analogue demonstrates independent regulation of Rap1 and ERK. Nat Cell Biol 4: 901–906, 2002 [DOI] [PubMed] [Google Scholar]
- 30.Fang Y, Olah ME:Cyclic AMP-dependent, protein kinase A-independent activation of extracellular signal-regulated kinase 1/2 following adenosine receptor stimulation in human umbilical vein endothelial cells: Role of exchange protein activated by cAMP 1 (Epac1). J Pharmacol Exp Ther 322: 1189–1200, 2007 [DOI] [PubMed] [Google Scholar]
- 31.Lotfi S, Li Z, Sun J, Zuo Y, Lam PPL, Kang Y, Rahimi M, Islam D, Wang P, Gaisano HY, Jin T:Role of the exchange protein directly activated by cyclic adenosine 5-monophosphate (Epac) pathway in regulating proglucagon gene expression in intestinal endocrine L cells. Endocrinology 147: 3727–3736, 2006 [DOI] [PubMed] [Google Scholar]
- 32.Adams JP, Roberson ED, English JD, Selcher JC, Sweatt JD:MAPK regulation of gene expression in the central nervous system. Acta Neurobiol Exp 60: 377–394, 2000 [DOI] [PubMed] [Google Scholar]
- 33.Umenishi F, Narikiyo T, Vandewalle A, Schrier RW:cAMP regulates vasopressin-induced AQP2 expression via protein kinase A-independent pathway. Biochim Biophys Acta 1758: 1100–1105, 2006 [DOI] [PubMed] [Google Scholar]
- 34.Pisitkun T, Jacob V, Schleicher SM, Chou C-L, Yu M-J, Knepper MA:Akt and ERK1/2 pathways are components of the vasopressin signaling network in rat native IMCD. Am J Physiol Renal Physiol 295: F1030–F1043, 2008 [DOI] [PMC free article] [PubMed] [Google Scholar]
- 35.Yamada T, Terada Y, Homma MK, Nonoguchi H, Sasaki S, Yuasa Y, Tomita K, Marumo F:AVP inhibits EGF-stimulated MAP kinase cascade in Madin-Darby canine kidney cells. Kidney Int 48: 745–752, 1995 [DOI] [PubMed] [Google Scholar]
- 36.Michlig S, Mercier A, Doucet A, Schild L, Horisberger JD, Rossier BC, Firsov D:ERK1/2 controls Na,K-ATPase activity and transepithelial sodium transport in the principal cell of the cortical collecting duct of the mouse kidney. J Biol Chem 279: 51002–51012, 2004 [DOI] [PubMed] [Google Scholar]
- 37.Harris RC:Response of rat inner medullary collecting duct to epidermal growth factor. Am J Physiol Renal Physiol 256: F1117–F1124, 1989 [DOI] [PubMed] [Google Scholar]
- 38.Sands JM, Knepper MA:Urea permeability of mammalian inner medullary collecting duct system and papillary surface epithelium. J Clin Invest 79: 138–147, 1987 [DOI] [PMC free article] [PubMed] [Google Scholar]
- 39.Naruse M, Klein JD, Ashkar ZM, Jacobs JD, Sands JM:Glucocorticoids downregulate the rat vasopressin-regulated urea transporter in rat terminal inner medullary collecting ducts. J Am Soc Nephrol 8: 517–523, 1997 [DOI] [PubMed] [Google Scholar]
- 40.Snedecor GW, Cochran WG: Statistical Methods, 8th Ed., Ames, IA, Iowa State University Press, 1980 [Google Scholar]