Abstract
Purpose
Improvements in computed tomography (CT) technology, with shorter scan times and better image quality, have contributed to an increase in the use of CT in the United States in recent years. This increased use has implications both for health policy and radiation risk assessment. The purpose of this study was to evaluate trends in CT utilization.
Methods
The CT performance records at a university-based, tertiary care, level 1 trauma center hospital were evaluated from 1998 through 2005. The hospital’s decision support infrastructure was used to track overall patient visits and stays. From these data sets, the age and sex dependency of CT utilization rates were evaluated for out-patients, in-patients, and emergency room patients.
Results
Out-patient utilization rates averaged over the age groups of 21–30 years old, 41–50 years, and 61–70 years were 20, 59, and 87 CT scans per 1000 out-patient visits, respectively. In-patient use for these same age group were 88, 148, and 162 CT scans per 1000 in-patient-days. CT utilization rates for emergency room (ER) patients were 705, 687, and 394 CT scans per 1000 ER patient visits, for the same 3 age groups. Male patients outnumbered female patients for both emergency room and in-patient CT utilization from the early teens through the mid-40s.
Conclusions
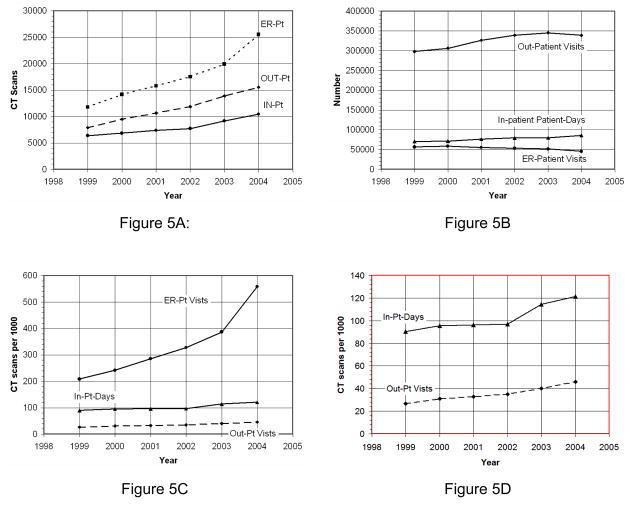
Overall use of computed tomography increased 27% from 2000 to 2004 for out-patient visits, and 48% over the same period for in-patients. CT utilization in our very high volume emergency room (ER), from 2000 to 2004, increased 131%. Part of the ER increased CT utilization may be due to the installation of two CT scanners near the ER.
Keywords: Computed Tomography, Radiology Practice, Emergency Medicine
Introduction
National trends suggest that CT utilization is rapidly growing[1–4]. This is a source of concern to the radiology community from the perspective of increased cost and increased radiation dose to the patient population. CT is already known to be greatest source of the collective radiation dose in the US, and approximately 75% of radiation exposure (excluding background sources) in the US has been attributed to CT[5]. For these reasons, detailed analysis of CT utilization in clinical practice may be valuable for identifying the underlying factors which are driving these increases in CT usage. Such data are particularly important in the face of the recent clinical deployment of extreme multi slice (64+ slices) CT scanners, which will likely cause further increases in CT use due to additional clinical applications such as cardiothoracic imaging.
Data bases in the radiology information system and hospital records system at our institution were used to study trends in CT utilization, over a period from 1999 to 2004. These trends included the age and sex-distribution of patients undergoing CT procedures in the out-patient, in-patient, and emergency room (ER) settings, normalized to the calendar year 2004. The purpose of this study was to evaluate the trends in CT utilization, for our institution which is typical of a large urban academic center with a large emergency room service.
Methods and Materials
Data Acquisition and Analysis
The radiology information system (RIS, IDX Imagecast, Burlington, VT) database at our institution was queried for all CT studies performed from July 1998 through December 2005. More than 286,000 CT scans were performed during this 7.5-year timeframe. Data retrieved included the patient’s medical record number, date of birth, the date of the CT study, gender, and the CPT code that indicates the type of CT procedure (head, abdomen, etc.). Patient age at the time of the CT study was tallied with a resolution of 1 year. CT scans were tallied per CPT code, although the individual CPT codes were not evaluated. In most cases patients underwent several CPT-code defined procedures at one setting, for example an abdomen and pelvis study performed simultaneously. The research comprised by this study was a retrospective analysis of patient records and was conducted under an existing internal review board (IRB) protocol (approved Jan 19, 2005). Patient consent was not required.
While the CT scan data was available from July 1998 through December 2005, the 1998 data was not used in trend analysis because it was only for a partial year. Although the 2005 data was available, a change of our RIS system during this year led to changes in how in-patient, out-patient, and ER-patient data were tallied, so to be consistent the 2005 data was excluded from the annual trend analysis.
The 1999 data was used for long term trend analysis, however to reflect more recent trends in usage, the 2000 – 2004 data was used for age-based metrics. The distribution of patient age at the time of CT study is important because of the age-dependency of radiation risk. For the CT scan data base, the age distribution between calendar year 2004 was compared with the age distribution of each year 2000 through 2003, and no significant differences were found (p values ranged from 0.31 to 0.81, Wilcoxon Signed Rank Test). Thus, the data over this 5 year period were summed and then renormalized to the 2004 patient volume. This procedure allowed us to leverage the larger patient count over the 2000–2004 time frame to reduce statistical fluctuations, while analyzing trends for the 2004 calendar year.
The hospital decision support system (PowerBuilder, Sybase, Dublin, CA) was used to tally the number of patients classified as in-patients, out-patients, and ER patients from 1999 to 2004. The ER and out-patient data were tallied as patient visits, while the in-patient data was tallied as the product of Patient × Hospital Stay Duration (“patient-days”). Both metrics were used to normalize the CT utilization data. The data base was also used to evaluate the age and sex distribution of our patient population, however the age and sex breakdowns were only available over the 2003–2005 period. The age distribution was tallied with a resolution of 1 year.
One of the principle focuses of this study was to better understand the age-dependencies in CT utilization, however the age-specific data for the two data sets (CT usage and hospital visitations) were available over two slightly different time periods (1999–2004 for CT usage, and 2003–2005 for patient hospital statistics). To accommodate these differences, the age categories were summed for the CT data set over the years 2000 to 2004, and rescaled to the overall number of scans in 2004. The patient visitation data was summed over the 2003–2005 period in each age category, and rescaled in terms of overall patient visit numbers to 2004 as well. This weighted averaging was used to reduce the statistical fluctuations in the age categories, however by prorating both data sets to the same year, consistent utilization statistics could be determined. Noise reduction per age category is particularly important in computing the ratio (CT scans per patient visits), a process which amplifies noise in the data.
U.S. Census Bureau data for calendar year 2004 were accessed on the internet[6] and the age distribution of the local population was used in this study. This population data was categorized in non-uniform age intervals (0–4, 5–9, … 25–34, etc.), and thus multi-year data averaging was necessary for comparison with the Census data.
Computer programs custom written in C (Microsoft Corporation, Redmond, WA, C/C++ 6.0 service pack 5) were used to extract and evaluate the data from the RIS system. Processed data was also evaluated using a commercially available spreadsheet (Excel, Microsoft Corporation, Redmond, WA).
All graphs having age as the abscissa used 3 element box car averaging to reduce statistical noise in the presentation.
Clinical Setting
The University of ____ Medical Center is a large tertiary care facility serving the metropolitan and outlying areas of the City of ___. The population of the Medical Center’s surrounding four county metropolitan area in 2005 was 1.93 million. The institution is a level I trauma center, and is one of the five busiest trauma centers in the United States. The university runs a number of outlying clinics in the suburban areas surrounding the central city area, however there are no CT scanners associated with these clinics and visits to the clinics were not included in the tallies reported here. However, some fraction of the clinic patients are referred to the main medical center for their imaging needs, and this may enrich (increase) the out-patient imaging utilization rates reported here.
In calendar year 2004, the institution ran a total of five CT scanners, including one in an on-campus out-patient facility (a 4-detector row scanner, General Electric, Waukesha, WI), one CT scanner that is associated with a PET system (a 16 detector row scanner, General Electric Discovery, Waukesha, WI), and a 4 detector row system (Toshiba Aquilion) in the main hospital. Two 16 detector row scanners (General Electric, Waukesha, WI) are located in the main hospital, immediately adjacent to the emergency room, and these two systems were installed together in March 2003.
Results
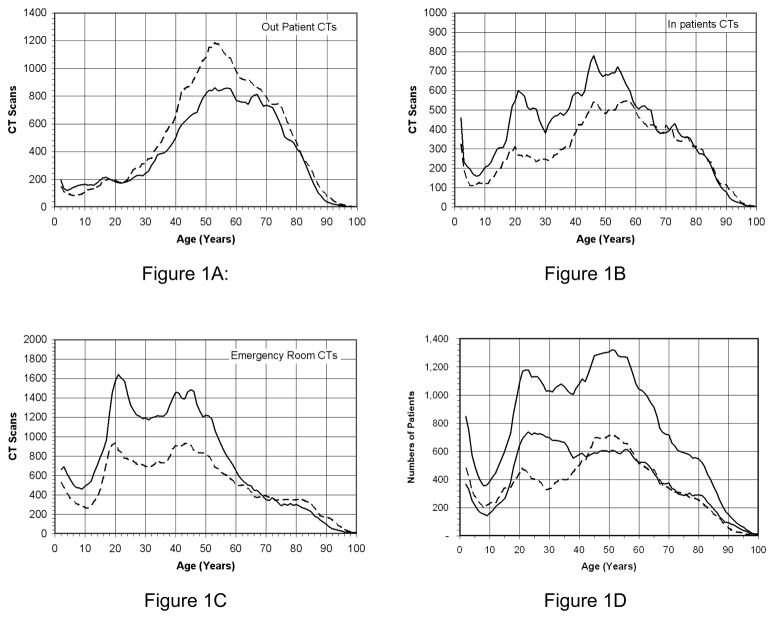
Between 1999 and 2005, 286,753 CT procedures were performed on 99,661 unique patients (Figure 1). Figure 1A illustrates the out-patient CT scans, as a function of patient age. Each line corresponds to sex, and in the out-patient population females are seen to have a larger number of CT scans in the midlife (40 – 60 years) timeframe. CT scans for in-patients are shown in Figure 1B, with male patients receiving substantially more CT scans from late adolescence through midlife in this category. CT scans performed as a result of emergency room visits are illustrated in Figure 1C, and here again male patient CT scans substantially outnumber female patient CT scans until approximately age 60. A large spike in CT scan utilization in the 17 – 25 age group is seen in Figure 1C, which is quite pronounced for male patients. These trends reflect incidence statistics for motor vehicle accidents and other forms of traumatic injury in that demographic[7]. Figures 1A–C show the unnormalized demographics for the population of patients having CT scans at our institution (1998–2005), that is, the raw data uncorrected by admissions and visit data. Figure 1D illustrates the age distribution for all patients seen at our institution (2003–2005) – not just those having CT scans. These data represent the extent of the raw data available to us in the radiology data base (1998–2005) and the hospital data base (2003–2005). For subsequent analyses, shown in later figures, subsets of these data were used.
Figure 1.
The number of CT scans performed at our institution over the timeframe 1998–2005 is illustrated as a function of the age of the patient. Male patients (solid line) are shown separately from female patients (dashed line). Figure 1A shows these data for out-patient CT examinations, and Figure 1B illustrates these data for in-patient CTs. Figure 1C illustrates Emergency Room CT utilization. Figure 1D: The age distributions for both male and female patients (and total) are illustrated. These data were acquired from the hospital’s decision support system. Each curve was smoothed slightly using a boxcar average.
The increased incidence of hospitalization and visits in the male population from age 17 through age 40 reflect trends seen in the CT utilization as well. Patients around age 10 have the lowest incidence of hospital utilization, other than the declining population of the very old.
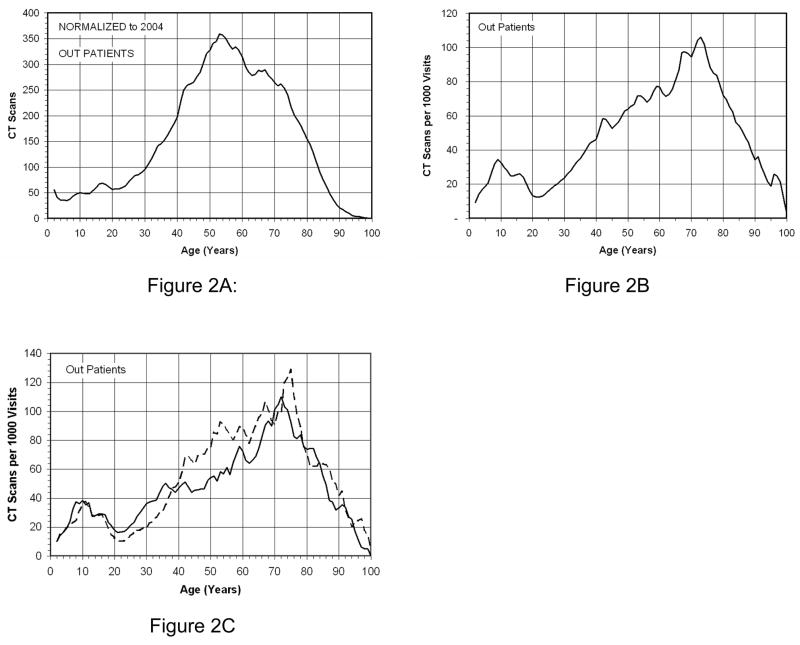
Figure 2A illustrates the age distribution for out-patient CT scans for calendar year 2004. Figure 2B illustrates the CT scans per thousand visits, as a function of age. This graph demonstrates a gradually increasing CT examination rate with age, with accelerating use of CT around age 20. Linear regression on this curve from age 25 to 72 yields a slope of 1.72 additional CT scans / year of age / 1000 visits (r2 = 0.94). Similar analysis on the population from age 75 through 95 shows a slope of −3.6 CT scans / year of age / 1000 visits (r2 = 0.93), indicating declining CT utilization after age 75. Figure 2C illustrates the sex-related differences in out-patient CT utilization, with a slight increase in out-patient female CT utilization/1000 visits from age 40 to 60.
Figure 2.
Figure 2A illustrates the total number of CT scans as a function of patient age for both sexes, normalized to the 2004 calendar year, for out patients. Figure 2B illustrates the CT utilization in terms of the number of CT scans per 1,000 visits as a function of age for our out-patient population. In Figure 2C, the number of CT scans performed per 1,000 patient visits is illustrated for both female (broken line) and male (solid line) patients as a function of age.
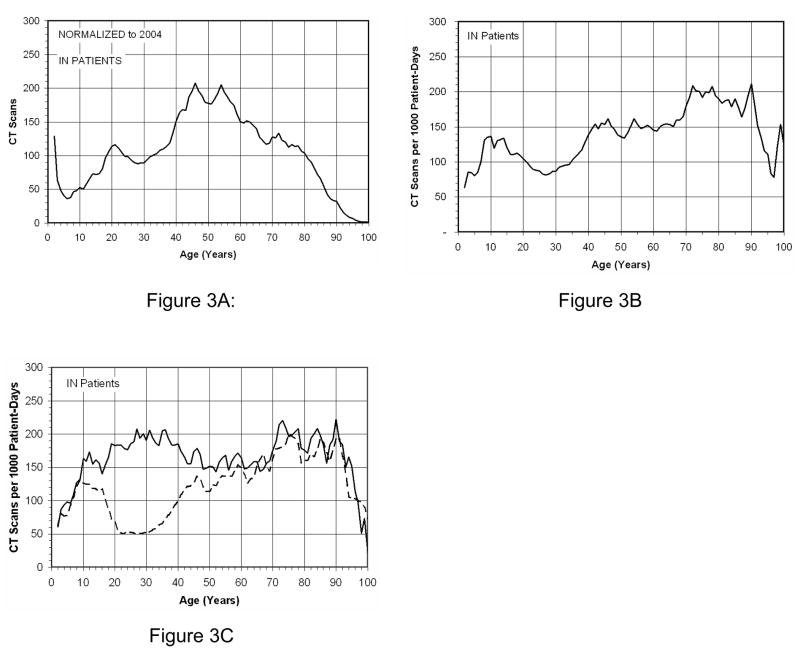
Figure 3A illustrates the age breakdown for CT scans for in-patients in calendar year 2004. The total number of CT scans in the in-patient population is less than that of the out-patient population, reflecting the large number of out-patient visits to our tertiary care facility. Figure 3B illustrates the number of CT scans per thousand patient days as a function of patient age. The breakdown by sex in Figure 3C illustrates that male patients dominate in-patient CT scan utilization in the mid-teen to midlife age range.
Figure 3.
The in-patient CT statistics are shown in this figure. Figure 3A illustrates the age distribution of CT scans performed in the calendar year 2004. Figure 3B illustrates the number of CT scans per 1,000 patient days as a function of age. The number of CT scans per 1,000 patient days is illustrated in Figure 3C for inpatients, broken down by sex.
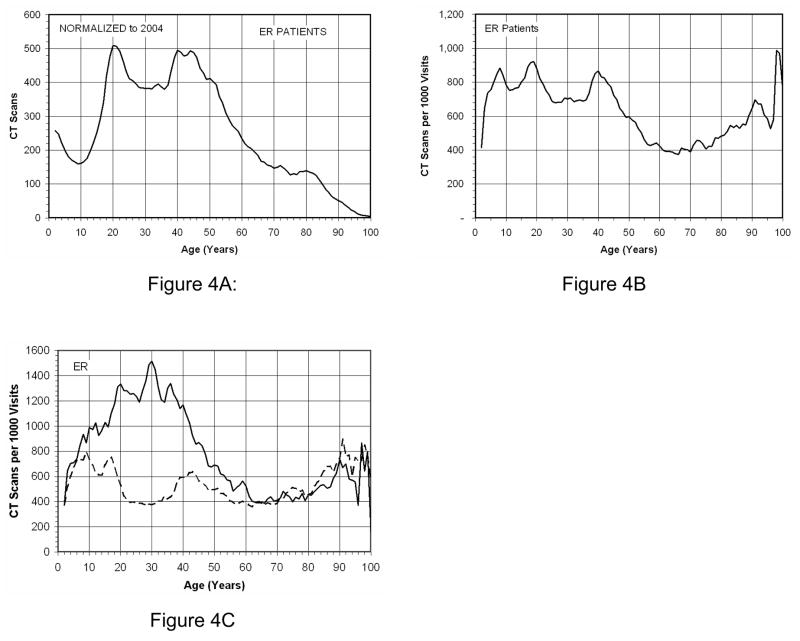
Figure 4A illustrates the CT scans for emergency room patients for calendar year 2004, as a function of age. The large increase in CT scans in the 16 – 25 year age range clearly reflects the higher incidence of motor vehicle accidents and other trauma in this population[8]. The CT utilization rate is illustrated in Figure 4B, which demonstrates the number of CT scans per thousand ER visits as a function of age. This curve has a markedly different overall shape than the corresponding curve for out-patients and in-patients (Figures 2B and 3B), with CT utilization rates declining after age 40 until the eighth decade. Figure 4C shows ER CT utilization by sex, and here again males dominate CT use in the age range from 10 to 50 (approximately).
Figure 4.
The Emergency Room CT utilization is illustrated in this figure. Figure 4A shows CT scans as a function of age for ER patients, while Figure 4B illustrates the CT scans per 1,000 visits as a function of age. Figure 4C shows the number of CT scans per 1,000 visits for Emergency Room patients as a function of age, by sex.
Figure 5A illustrates the growth in CT scans at our institution for the in-patient, out-patient, and ER populations from 1999 – 2004. These data reflect all CT scans performed on these three classes of patients in each calendar year, with no correction for annual hospital usage or population growth. Figure 5B illustrates the annual fluctuations in hospital usage by our out-patient, in-patient, and ER patient subpopulations. Figure 5C illustrates the CT scan per thousand visits or patient stays for the in-patient, out-patient, and ER populations. Figure 5C is essentially the data in Figure 5A divided by the corresponding data in Figure 5B. When corrected for hospital visits, the out-patient CT utilization rate shows a small increase of 27% (121.2/95.6) from 2000 to 2004, and the in-patient CT utilization rate increased by 48% (45.9/31.0)) over this same period. However, as the upper curve in Figure 5C illustrates, CT utilization rate in the emergency room patient population has grown steadily from 1999 to 2003, with a precipitous jump in 2004. The growth in CT use in the ER from 2000 through 2003 was 60% (386.8/241.8), approximately 20% per year. ER use in CT from 2003 to 2004 grew by 44%, likely driven in part due to the installation of two 16 detector row CT scanners, immediately adjacent to the ER. These CT scanners began clinical service in March 2003. The overall growth in the use of CT in the ER from 2000 to 2004 was 131% (558.6/241.8).
Figure 5.
Figure 5A: The raw (unnormalized) CT scan use is shown as a function of year. Figure 5B: The number of out-patient and ER-patient visits are illustrated, along with the number of In-patient patient-days. Figure 5C: The CT utilization rates are illustrated for out-patients, in-patients, and ER-patients. Figure 5D: an expansion of the in-patient and out-patient data shown in Figure 5C. The metric for out-patients and ER-patients is CT scans per 1000 visits, whereas the metric for in-patients is CT scans per 1000 Patient-Days.
Figure 6 illustrates the trends in the sum total of in-patient, out-patient, and ER-patient visits as a function of age. This curve reflects the overall hospital use (by In-, out- and ER patients) per 1000 members (not age sorted) of the population in the local 4 county region that is served (in part) by our institution. It is apparent from this nearly linear graph that age is a major factor in the use of in-patient, out-patient, and ER-patient visits.
Figure 6.
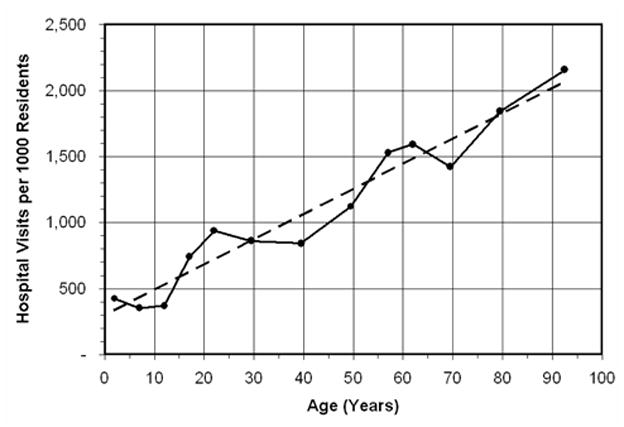
The number of hospital visits (including in-, out-, and ER patients) as a function of age, per 1000 residents (of the same age group) in the 4 county catchment area of the medical center (population 1.93 million) is illustrated. The linear fit (dashed line) corresponds to Y = 297.66 + 19.173 X (r2 = 0.940).
Figure 7 is a histogram, plotted with semi-logarithmic axes, showing the frequency distribution of the number of individual CT studies (as CPT codes) performed on patients undergoing CT. The average patient who had a CT received 2.88 CT scans over the period evaluated, while the median number received by each CT patient was 4 CT studies. Eighty percent of CT patients had 9 CT studies or less, and 95% received 20 CT studies or fewer. One patient had 70 CT studies, and another 88 (off scale on this graph). Figure 8 illustrates the age trends pertaining to the number of CT studies each patient receives. There is a steady increase in the number of CT studies performed per patient from early adulthood through age 68, with a steady decrease in this trend in the last 3 decades shown.
Figure 7.
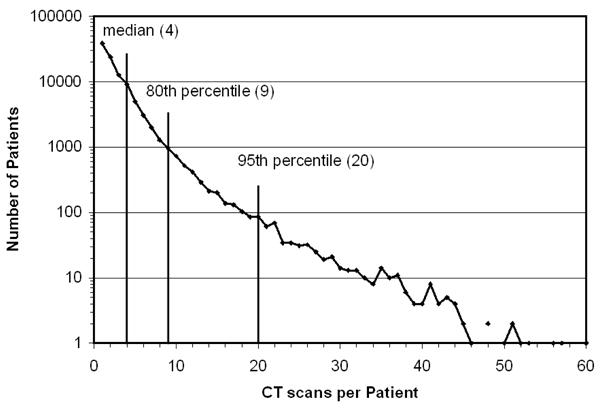
A histogram showing the frequency distribution of the number of CT scans per patient undergoing CT is shown. The average CT patient received 2.88 CT studies. The ordinate axis is logarithmic, which is necessary to show the large range of data. Fifty percent of patients received 4 CT scans or less, while 80% of patients had 9 scans or less. Five percent of patients had more than 20 CT studies.
Figure 8.
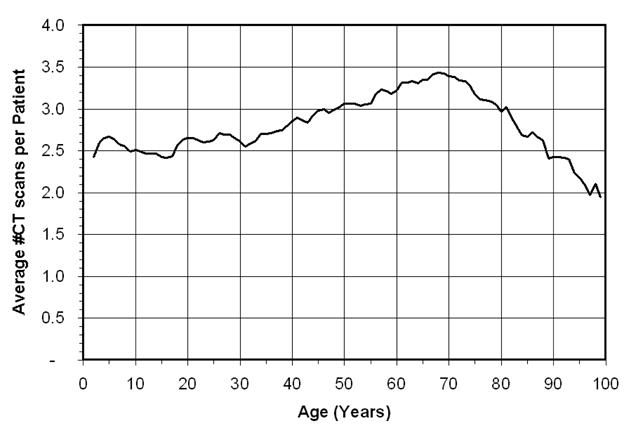
The average number of CT studies performed, per patient who had a CT scan, is illustrated as a function of patient age.
Discussion
The trends which emerge from the analysis of CT utilization rate by age, sex, and patient status (in-patient, out-patient, or ER patient) are not surprising. The relative utilization trends in our tertiary care hospital are biased by the busy trauma service that our institution runs –one of the top five busy trauma centers in the United States. Thus, the results from this study may not be representative for other institutions which serve different clinical populations.
The sex-specific utilization of CT in the out-patient arena is largely similar between males and females, with females having a higher CT utilization rate during midlife (approximately ages 40–60) than males. Male patients outnumber female patients in both the in-patient and emergency room populations from early adolescence through approximately age 60. These trends are explained in part by the more accident prone (motor vehicle and otherwise) behavior of men and boys[7]. Differences between male and female CT utilization rates in ER and in-patient populations tend to disappear at approximately age 60. CT utilization rates for out-patients steadily climbs from age 20 through age 70, and CT utilization rates (CT scans per 1,000 visits) decline relatively rapidly after age 75. There is more restrained use of CT in the pediatric population (0–18 years).
The university runs a number of out-patient clinics in the suburban areas, however none of these has CT capability. While some fraction of these patients (mostly the capitated patients) are sent to the medical center for CT imaging, the exact number of these suburban clinic patients referred for CT imaging is not known. Because of this, the out-patient CT utilization rates reported here may be slightly higher than from facilities which have a less significant CT referral base from outlying clinics.
Figure 5 illustrates the annual trends in CT utilization from 1999–2004. While slight increases in the use of CT are evident for both out-patients and in-patients, it is clear from Figure 5C for the 1999–2004 period of time that the emergency room is a major factor in driving up CT utilization rates at this institution. Figure 5D shows a close-up of the outpatient and inpatient data shown in Figure 5C. The increasing technical performance of CT scanners over this time period may have contributed to some of this increase, and local issues of proximity of CT to the emergency room may have impacted more recent trends (2003–2004). Gradual changes in clinical practice trends in emergency room and trauma medicine are likely to be at least partially responsible for the increasing CT utilization rate for the ER patient. It is the anecdotal observation at our institution that radiographic procedures in many cases are being replaced by CT scans, with the cerebral spine radiograph and intravenous pylegram being examples of this. Additionally, in recent years (i.e. 2002–2005), emergency room availability in our region has failed to keep pace with the growing population, resulting in hospital diversion practices where only the sickest or most seriously injured patients are accepted in the ER. As the severity of ER patients increases, it is logical that CT utilization rates would increase. It is also likely that emergency room physicians increasingly use CT for triaging trauma patients, in order to expedite the disposition and discharge of those patients with minor injuries.
Although emergency room patients made up only 9.6% of patient visits in 2004, 49.5% of all CT scans were performed on ER patients. In 2004, CT utilization rates integrated over all ages were 45.9 CT scans per 1000 out-patient visits, 121.2 CT scans per 1000 in-patient-days, and 558.6 CT scans per 1000 emergency room patient visits.
Radiation Consequences
BEIR 7[9] risk data suggest that females are more sensitive to radiation induced cancer than males, with the incidence of radiation-induced cancer being 1.8 times higher at age 10, 1.7 times higher at age 20, and 1.5 times higher at age 30. Radiation risk for males steadily decreases with age, from 14.4 fatal cancers per 1000 exposed people at 100 mGy exposure at age 10, to 4.92 cancers at age 60. For females, the radiation incidence is 26.0 per 1000 exposed individuals at age 10, to 5.87 per 1000 at age 60. The decline in radiation induced cancer risk is steepest for males and females from birth to about age 40, and is less steep until gradually tapering to zero at about age 86.
The age and sex dependencies of radiation risk suggest that from the perspective of avoiding cancer induction by CT, that CT be used sparingly for younger patients. The utilization data shown for outpatients (Figure 2C) demonstrates that CT utilization rates slowly climb from age 20 to age 75 for both male and female patients. At age 40, the CT utilization rate is about 50 CT scans per 1000 patient visits. ER patients are typically sicker or more gravely injured than outpatients, and the CT utilization rates are much higher and show less conservative CT use trends with age (Figure 4C). For example, males visiting the ER have an incidence of over 1200 CT scans per 1000 visits from age 20 to 40, while female ER patients have an incidence averaging around 450 CT scans per 1000 visits over this same age range. The higher CT utilization rate for ER patients relative to out-patients likely reflects a perceived change in risk-benefit ratio from CT by referring physicians.
Limitations of this study
This was a retrospective study which utilized two separate databases, one kept by the radiology department and the other by the hospital. Inconsistencies in the categorical assignment between in-patient, out-patient, and ER-patient will result in biases in the data presented. While every effort was made to reduce the impact of this (by normalizing both data sets to the year 2004), the impact of remaining biases is not known. In this study, an analysis of the type of CT scans was not performed. Such a study would reveal age-specific trends for specific examinations, and would potentially illuminate changing CT referral patterns among clinical specialties such as neurology and pulmonary medicine.
Footnotes
Publisher's Disclaimer: This is a PDF file of an unedited manuscript that has been accepted for publication. As a service to our customers we are providing this early version of the manuscript. The manuscript will undergo copyediting, typesetting, and review of the resulting proof before it is published in its final citable form. Please note that during the production process errors may be discovered which could affect the content, and all legal disclaimers that apply to the journal pertain.
Reference List
- 1.CT scanner services in Western New York 2004. Finger Lakes Health Systems Agency. 2004. Niagara Health Quality Coalition. 1-23-2006. Ref Type: Electronic Citation
- 2.Mettler FA, Jr, Wiest PW, Locken JA, Kelsey CA. CT scanning: patterns of use and dose. J Radiol Prot. 2000;20:353–359. doi: 10.1088/0952-4746/20/4/301. [DOI] [PubMed] [Google Scholar]
- 3.Mitchell DG, Parker L, Sunshine JH, Levin DC. Body MR imaging and CT volume: variations and trends based on an analysis of medicare and fee-for-service health insurance databases. AJR Am J Roentgenol. 2002;179:27–31. doi: 10.2214/ajr.179.1.1790027. [DOI] [PubMed] [Google Scholar]
- 4.Bhargavan M, Sunshine JH. Utilization of radiology services in the United States: levels and trends in modalities, regions, and populations. Radiology. 2005;234:824–832. doi: 10.1148/radiol.2343031536. [DOI] [PubMed] [Google Scholar]
- 5.Wiest PW, Locken JA, Heintz PH, Mettler FA., Jr CT scanning: a major source of radiation exposure. Semin Ultrasound CT MR. 2002;23:402–410. doi: 10.1016/s0887-2171(02)90011-9. [DOI] [PubMed] [Google Scholar]
- 6.US Census Bureau. 2006 http://www.census.gov/ 1-6-2006. Ref Type: Electronic Citation.
- 7.Barancik JI, Chatterjee BF, Greene-Cradden YC, Michenzi EM, Kramer CF, Thode HC, Jr, Fife D. Motor vehicle trauma in northeastern Ohio. I: Incidence and outcome by age, sex, and road-use category. Am J Epidemiol. 1986;123:846–861. doi: 10.1093/oxfordjournals.aje.a114314. [DOI] [PubMed] [Google Scholar]
- 8.Barancik JI, Chatterjee BF, Greene-Cradden YC, Michenzi EM, Kramer CF, Thode HC, Jr, Fife D. Motor vehicle trauma in northeastern Ohio. I: Incidence and outcome by age, sex, and road-use category. Am J Epidemiol. 1986;123:846–861. doi: 10.1093/oxfordjournals.aje.a114314. [DOI] [PubMed] [Google Scholar]
- 9.Health Risks from Exposure to low levels of ionizing radiation: BEIR VII - Phase 2, Committee to assess health risks from exposure to low levels of ionizing radiation. National Research Council, National Academies Press; Bethesda, MD: 2005. [PubMed] [Google Scholar]


